CLASSIFICATION OF EMOTIONS IN INDONESIAN TEXTS
USING K-NN METHOD
Arifin
Electrical Engineering Department
Institute of Technology Sepuluh Nopember Surabaya Kampus ITS, Sukolilo, Surabaya 60111
Ketut Eddy Purnama Electrical Engineering Department
Institute of Technology Sepuluh Nopember Surabaya Kampus ITS, Sukolilo, Surabaya 60111
Abstract -- This paper aims to classify texts in Indonesian language into emotion expression classes. The data were taken from 6 basic emotion classes whose training documents and test documents were obtained from articles in www.kompas.com, www.suaramerdeka.com, and www.detik.com. The text weighing was processed by using TFID method which is an integration of Term Frequency (TF) and Inverse Document Frequency (IDF). In the classification process, K-Nearest Neighbor (K-NN) was used to see how far this method could classify emotion expression of Indonesian language. The test shows that the classification of the Indonesian texts for the six basic emotion classes by using K-NN method results in accurateness percentage of 71.26%, obtained at k=40 as the optimum value.
Keywords: basic emotions, K-Nearest Neighbor, Indonesian language, TFIDF
I. INTRODUCTION
Human’s facial character animation is important especially in shaping face expression. This character animation is a difficult object to be animated. Facial movement in a specific pattern is called facial expression, and this is a complex matter in creating animation [1].
The emergence of intelligent agent technology has made us realize that there is an opportunity to develop an interface to improve a model of human and computer interaction, virtual character simulation for different applications such as entertainment, education, and so on. Nowadays, human and computer interaction has been done through texts, mouse, or keyboard simultaneously, and along with the rapid development in graphic computing and speech recognition technology, this interaction becomes more adaptive, flexible, and human-oriented [2]. A successful computer human interaction system should be able to recognize, interpret and process human emotions. Affective computing could offer benefits in an almost limitless range of applications. human emotion recognition is multimodal in nature, and includes textual, visual and acoustic features. Text seems to be the most studied modality since the text is relatively easier to process than others. Human Emotion Recognition from text can be simply envisioned to be a classification
An agent can be said to be intelligent if it is equipped with emotion [3], therefore the agent needs to be given emotions. Meanwhile, communication can be done through verbal and non-verbal information. Verbal information can be in the form of writings obtained from words, sentences, paragraphs, etc., while non-verbal one in the form of body gesture [4].
A facial expression represents an emotion, for example a smile means happiness. To create better
emotion interpretation, verbal information needs to be considered [5]. In this paper, the way to understand verbal communication is determined by given text classification.
II. INDONESIAN LANGUAGE
In Kamus Besar Bahasa Indonesia (KBBI/Indonesian language dictionary), a word is defined as the smallest element in a spoken or written language, and is a realization of feelings and thought when using a language. Meanwhile, a text can be defined as a written material delivered in classes, speech, etc. In general, Indonesian text structure can be shown in figure 1.
Based on its form, a word can be classified into four: base form, derivative form, reduplication form, and compound form. Base forms or root words are words that become the basis of derivational forms or affixed forms. The change in derivative forms is due to affixes in the initial position (prefix) medial position (infix), or final position (suffix). Reduplication forms are base forms which are reduplicated, either partially or wholly, while compound forms are the combination of different base forms which constitute a new meaning.
Figure 1. Text Structure
III. BASIC EMOTIONS
An emotion can be described as a state generally caused by a certain event experienced by a subject. An emotion includes (a) conscious mental state, indicated by the ability to know the quality of feelings and is directed to several subjects, (b) physical disorder in several body parts, (c) expression recognition to face, voice, and gesture, and (d) readiness to perform certain action [5].
Some studies on human emotion have been done so there is an agreement on basic emotions [6], they are (1) fear is described as a physical or social threat for the self, (2) anger as a dissatisfaction or frustration from a role or goal achieved by other people, (3) disgust as one’s distance, omission, or rejection of idea to oneself, (4) sadness as failure or infliction on role and goal, (5) happiness or joy as success or movement to the accomplishment of valuable role.
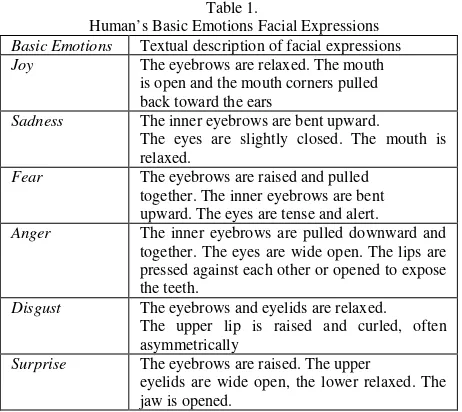
Psychologists have been trying to explain human’s emotions for some decades, and some facial expressions that describe basic human’s emotions can be seen in Table 1. These basic emotions include joy, anger, fear, sadness, disgust, and surprise.
Table 1.
Human’s Basic Emotions Facial Expressions Basic Emotions Textual description of facial expressions
Joy The eyebrows are relaxed. The mouth
is open and the mouth corners pulled back toward the ears
Sadness The inner eyebrows are bent upward. The eyes are slightly closed. The mouth is relaxed.
Fear The eyebrows are raised and pulled together. The inner eyebrows are bent upward. The eyes are tense and alert.
Anger The inner eyebrows are pulled downward and together. The eyes are wide open. The lips are pressed against each other or opened to expose the teeth.
Disgust The eyebrows and eyelids are relaxed. The upper lip is raised and curled, often asymmetrically
Surprise The eyebrows are raised. The upper
eyelids are wide open, the lower relaxed. The
In this paper, we perform several steps in the process of classification of text documents in Indonesian language, namely pre-processing, feature extraction and selection, weighting, learning and classification, and evaluation. In general, a series of stages is shown as figure 2.
Figure 2. Classification Process Overview
B. Pre-processing
Text document that will be processed generally have some characteristics such as they have high dimension, there are noises, and they have bad structure. Therefore, pre-processing step is conducted. This step consists of case folding, tokenizing, filtering, and stemming. In case folding, all letters in the text document are converted into small case, and non-letter characters such as numbers and punctuations are omitted. In tokenizing/parsing step, the text is selected based on words constituting it, as included in the list of words that will be omitted. In order to maintain the meaning of the text document containing these words, they need to be modified in the form of an affixed word by taking out its affixes. Porter Algorithm used for Indonesian language in this paper is based on Fadillah Tala’s research [9]. It has 5 groups of rule, they are:
C. Text Document Representation
A text document contains a group of words so a process of transforming it into a form that can be used in classification process is needed. By modelling in vector form, every document C will be transformed into vector in term-space (group of words that appear in all documents) [5].
C = (t1, t2, ... , tn) (1)
tn is an event of n word in a document. There are two
bases to create a vector [10].
a. Binary – only based on the presence of a word in the document.
b. Frequency – the frequency of a word to appear in the text document.
The weighing of document processed in vector form by using term that can be recognized is calculated based on TFIDF method. This method is an integration of Term Frequency (TF) and Inverse Document Frequency (IDF) by using the following formula:
�(�,�) =��������,���=���,��. log|�| First, a model is built by depicting a group of data class or concept of data population which has been determined before. This model is built by analyzing training data described by attributes. Every tuple is assumed to be owned by a defined class, as determined by one attribute, called class label attribute.
classifying test data. After it is measured, the decision maker can decide to use the model or repeat creating model by using training data.
E. K-Nearest Neighbor (K-NN)
K-Nearest Neighbor (K-NN) is a method of supervised classification, in which the query result classification is based on class majority. Assume that there is a j training class C1, C2, C3,..Cj and the number of
training sample is N. After being pre-processed, each document will become feature vector with m dimension. Then, the steps to apply this method are as follows: 1. Convert X document from all training sample into
the same feature vector (X1, X2, ...., Xm)
2. Calculate the similarity of all training samples and X document. Take the i-th document of di (di1, di2, ....,
3. Choose a sample k which is bigger than similarity N from SIM(X,di), (i=1,2,....,N). Treat them as a set of
K-NN from X. Then, calculate the probability of X to each category by using the following formula:
���,���= ∑��∈������(�,��).�(��.��) (4)
4. Test X document to find out the category by looking at the biggest P(X,Cj).
F. K-NN Algorithm
K-NN will process data resulted from preprocessing. This process is done to find out the data’s category by the following steps:
a. Calculate the similarity between sample document and test document by using formula (3).
b. Based on formula (3), do matrix multiplication BTn,k.Ak,m. This yields Cn,m matrix. The i-th line of
Cn,m matrix shows the similarity of the i-th test
document and all sample categories.
c. Calculate the distance of Ji and Ki of matrix vector each sorted line vector. The selection of this biggest k value represents the k value of the nearest neighbor. Each of the biggest k values is evaluated in term of its class membership by using formula (5). g. By using formula (4), calculate the probability of
each test document to each class by multiplying the k-th vector with the result of process f.
h. Determin the biggest probability and result class.
G. Evaluation
The evaluation of the similarity of documents can be based on recall, precision, and F-measure. In the classification result (prediction classI), there is a probability whether the classification belongs to its class (class1 true) or not, or it belongs to another class (class2 true). In this case, the above parameter will be used to calculate the evaluation parameter, that is [13]:
1. Recall is the level of success to recognize a class that is supposed to be recognized.
2. Precision is the level of precision of classification result of all documents.
Therefore, recall entails the number of entity recognitions having true value that is done by the system, divided by the number of entities that is supposed to be recognized by the system; while precision is calculated from the number of recognitions having true value, divided by the number of the whole recognitions done by the system.
F-measure is the value representing all systems performance and is a mathematically combined recall and precision values in a certain value [14]. F-measure can be calculated by using the following formula [15]:
��������= �∗�∗�
��� (6) where P is precision and R is recall.
V. EXPERIMENT
A. Text Document
In this study, which text documents are used for training and testing process is not based on a text document from ISEAR (International Survey on Emotion Antecedents and Reactions), WordNet-Affect and WPARD datasets. However, the text documents employed in the training and test processes were taken from www.suaramerdeka.com, www.kompas.com, and www.detik.com. The text documents were chosen manually and their class were written down and saved in text file format. This data of this research were six either training or test, into TFIDF numeric representation as in formula (2). The next step is feature extracting by deleting case folding, filtering stoplist words, and stemming to determine base forms.
C. Result
The result of the test is used to obtain a maximum k value in order to yield an optimum success. Therefore, precision and recall parameters were used related to a certain category.
Table 2. Recall of Each Class
From table 2, it can be seen that the recall of ‘marah’ class of all k’s is fairly low, while for other classes are relatively rational.
Table 3. Precision of Each Class
The precision value at k > 20 is relatively good, except in ‘takut’ class which has lower precision value than other classes.
From the recall values shown in figure 4, it can be seen that ‘jijik’ class has relatively better recall value at all k values, except k = 20.
Figure 4. Recall of Each Class
Figure 5. Precision of Each Class
In general, precision and recall values of some classes increase up to k = 40. On the other hand, after k = 40 the precision and recall values tend to decrease. It can also be seen from figure 5 that ‘senang’ class has the highest precision value at all k values.
Based on formula (6) the F-measure value can be calculated, as shown in table 4. The result of F-measure calculation for k = 5 to k = 20 and k > 50 is not significant, so it is not shown.
Table 4.
F-measure of Each Category
From the F-measure result of each class as in figure 6, it can be seen that the highest F-measure is ‘jijik’ class. This demonstrates that the best K-NN method performance is ‘jijik’ class.
Figure 6. F-measure of Each Class
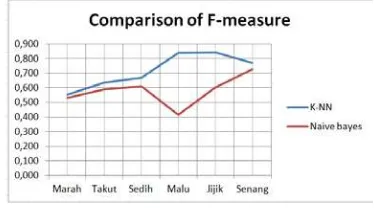
Table 5.
Comparison of F-measure K-NN and Naive Bayes
The accuracy percentage is obtained at k = 40, that is 71.26%. This figure represents the number of text documents which failed to classified, that is 39 out of 188 text documents. This percentage is higher that that of resulted from Naïve Bayes method, which yields accuracy percentage of 58.01% for similar text documents.
From Table 5 shows that the overall F-measure values for the K-NN method with a value of k = 40 has better performance than Naive Bayes method. Comparison of the performance results of both methods is also shown as figure 7.
Figure 7. Comparison of F-measure
VI. CONCLUSION
From the explanation above, it can be concluded that: 1. K-NN method could classify 188 Indonesian text
documents, yielding accuracy percentage of 71.26% at k = 40. This result is higher than that yielded from Naïve Bayes method which is 58.01%.
2. The optimum k value was achieved at the range of 30 to 50.
3. The success of classification method of text documents varied among classes.
VII.REFERENCES
[1] Abraham Ranardo Sumarsono, Iping Supriana Suwardi, “Facial Expression Control of 3-Dimensional Face Model Using Facial Feature Extraction”, International Conference on Electrical Engineering and Informatics, Bandung, Indonesia, 2011. [2] Casell, J., Sullivan, J., Prevost, S., and Churchill, E., “Embidied
Conversational Agent”, MIT Press editors, 2000
[3] Minsky, M.L. “The Society of Mind” William Heinemann Ltd., London, 1987.
[4] P. Ekman, W. V Friesen, “The repertoire of nonverbal behaviour”, Semiotica, Vol.1, pp.49-98, 1969
[5] Destuardi, Surya Sumpeno, “Klasifikasi Emosi untuk Teks Bahasa Indoensia Menggunakan Metode Naive Bayes”, Seminar Nasional Pascasarjana ITS, Surabaya, Indonesia, 2009. [6] Wibisono Yudi dan Masayu Leylia Khodra, “Clustering Berita
Berbahasa Indonesia”, Konferensi Nasional Sistem Informasi, UNPAS, Februari, 2006.
[7] Surya Sumpeno, Mochamad Hariadi and Mauridhi Hery Purnomo, “Facial Emotional Expressions of Life-like Character Based on Text Classifier and Fuzzy Logic”, IAENG International Journal of Computer Science, 38:2, IJCS_38_2_04, 2011.
[8] ——, Emotion in the Human Face, 2nd ed. Cambridge University Press, 1982.
[9] Tala Fadillah Z, “A Study of Stemming Effect on Information Retrieval in Bahasa Indonesia’, Master of Logic Project Institut for Logic, Language and Computation, Universiteit van Amsterdam The Netherlands.
[10] W. James.,”The Principles of Psychology” Henry Holt, New York, NY, 1890.
[11] N. Cristianini, and J. Shawe-Taylor, “An Introduction to Support Vector Machines” Cambridge, UK: Cambridge University Press, 2000.
[12] Dewi Y. Liliana, Agung Hardianto dan m. Ridok, “Indonesian News Classification Using Support Vector Machine”, World Academy of Science, Engineering and Technology 81, 2011. [13] Yong Z, Youwen L, Xhixion X., “An Improve K-NN Text
Classification Based on Clustering”, Journal of Computer, Vol 4. No. 3 Conference on Neural Information Processing, 347-351, 2009.