REDISTILLED LIQUID SMOKE FROM OIL-PALM SHELLS
AND ITS APPLICATION AS NATURAL
RUBBER COAGULANT
MUHANA NURUL HIDAYAH
DEPARTMENT OF CHEMISTRY
FACULTY OF MATHEMATICS AND NATURAL SCIENCES BOGOR AGRICULTURAL UNIVERSITY
DECLARATION
I declare that this bachelor thesis entitled “Redistilled Liquid Smoke from Oil-Palm Shells and Its Application as Natural Rubber Coagulant” is my own work under direction from committee of supervisors and have not been published in any form to any university. Information and quotes that were sources from journals and books have been acknowledged and mentioned where in the bachelor thesis they appear. All complete references are given at the end of the paper.
I have given the copyright of this paper to Bogor Agricultural University. Bogor, December 2014
Muhana Nurul Hidayah
ABSTRAK
MUHANA NURUL HIDAYAH. Redistilasi Asap Cair dari Tempurung Kelapa Sawit dan Aplikasinya sebagai Koagulan Karet Alam. Dibimbing oleh SUMINAR SETIATI ACHMADI dan ADI CIFRIADI.
Jumlah limbah tempurung kelapa sawit yang setiap tahunnya terus bertambah akibat peningkatan produksi minyak sawit dapat dimanfaatkan sebagai bahan baku dalam pembuatan asap cair. Kandungan asam dalam asap cair berpotensi sebagai koagulan karet alam. Tujuan penelitian ini adalah mendistilasi ulang asap cair pada suhu 80, 90, and 100 ºC dan menguji sifat koagulasi redistilat dibandingkan dengan asam format sebagai koagulan komersial. Selama proses redistilasi di setiap suhu, 2 tampungan redistilat terkumpul. Tampungan pertama dikumpulkan pada 5 menit pertama dan tampungan kedua dikumpulkan pada 5 menit berikutnya. Sebanyak 5 L redistilat diperoleh dari tiap tampungan. Uji sifat fisik pada lembaran karet menunjukkan bahwa redistilat 100 ºC dari tampungan kedua disarankan untuk digunakan sebagai koagulan karet alam karena menghasilkan nilai plastisitas Wallace yang memenuhi standar dan memiliki nilai indeks retensi plastisitas yang memenuhi persyaratan Standar Nasional Indonesia. Redistilat tidak terbukti dapat mencegah proses pengerasan karet selama penyimpanan.
Kata kunci: karet alam, koagulasi, redestilasi, tempurung kelapa sawit
ABSTRACT
MUHANA NURUL HIDAYAH. Redistilled Liquid Smoke from Oil-Palm Shells and Its Application as Natural Rubber Coagulant. Supervised by SUMINAR SETIATI ACHMADI and ADI CIFRIADI.
Abundant oil-palm shells waste which is generated annually as the result of the increasing production of palm oil can be utilized as source of liquid smoke. The acidic property of liquid smoke shows its potency as natural rubber coagulant. The objectives of this study are to redistill liquid smoke at 80, 90, and 100 ºC and also to examine the coagulation property of the RLS as compared to formic acid as a commercial coagulant. During redistillation, two collections of RLS were obtained from each temperature. The first collection was gathered at the first 5 min and the second one was gathered at the next 5 min. Each collection gave 5 L of RLS. The physical properties test showed that the RLS 100 ºC from the second collection was recommended as the natural rubber coagulant. This coagulant produced Wallace plasticity value that met the the Indonesian standard and high plasticity retention index value. The assumption of constituents in RLS which can prevent the storage hardening in rubber was not proven.
Bachelor Thesis
in partial fulfillment of the requirements for the degree of Bachelor of Chemistry
in
the Department of Chemistry
MUHANA NURUL HIDAYAH
REDISTILLED LIQUID SMOKE FROM OIL-PALM SHELLS
AND ITS APPLICATION AS NATURAL
RUBBER COAGULANT
DEPARTMENT OF CHEMISTRY
FACULTY OF MATHEMATICS AND NATURAL SCIENCES BOGOR AGRICULTURAL UNIVERSITY
Bachelor Thesis Title: Redistilled Liquid Smoke from Oil-Palm Shells and Its Application as Natural Rubber Coagulant
Name : Muhana Nurul Hidayah Student ID : G44100114
Approved by
Prof Ir Suminar Setiati Achmadi, PhD First Supervisor
Adi Cifriadi, MSi Second Supervisor
Acknowledged by
Prof Dr Dra Purwantiningsih Sugita MS Head of Department
ACKNOWLEDGMENT
Praise to Allah subhanahuwata’ala. The title of this bachelor thesis is
“Redistilled Liquid Smoke from Oil-Palm Shell and Its Application as Natural
Rubber Coagulant”. This scientific paper was written according to the experiment
carried out in February to August 2014 in the Process Laboratory, Center for Agro-Based Industry, the Organic Chemistry Laboratory, Department of Chemistry, Bogor Agricultural University (IPB), and the Bogor Research Center for Rubber Technology.
I sincerely would like to express my gratitude to my supervisors Prof Ir Suminar Setiati Achmadi, PhD for her suggestions, guidance, and support on research and Mr. Adi Cifriadi MSi for his helpfulness and guidance throughout this work. I profoundly thank my parents, Mr. Auzar and Mrs. Rustini, my sister Fitriana Amani, and my brother Ahmad Ibrahim for unconditional love and encouragement.
Furthermore, I would like to thank Mr. Bambang Handoko for his advice and suggesstion, Mr. Kosasih and Mr. Guring Pohan, who kindly helped redistillation process. Mr. Aos for his help throughout the research in Puslit Karet, and also thank to Mr. Jaenal for his help in plasticity analysis. I also thank to Mr. Deni who kindly help tapping the rubber trees. I would like to thank Mrs. Yenni who provided reagents for this experiment and Mr. Sabur for his advice and help during my work in Organic Laboratory. Most of all I would like to thank Ihsan Anggara, partner in liquid smoke research, for his cooperative work, to Krisnawati for her help during working at Puslit Karet Laboratory. I would like to thank Mutiara Pratiwi for giving correction to the script and her support, Lesya Agness and Meira Mawati for their support, Mr. Budi Arifin MSi, Novi Luthfiana Putri and Vicky Oktriviani for checking the script.
This study is a part of program “Establishing the Indonesian National
Standard for Masoyi Essential Oil and Wood Liquid Smoke Commodities” which is funded by BOPTN IPB in 2014 and lead by Prof Suminar S Achmadi, PhD.
Bogor, October 2014
TABLE OF CONTENT
LIST OF TABLES vi
LIST OF FIGURES vi
LIST OF APPENDICES vi
INTRODUCTION 1
METHODS 2
Redistillation of Liquid Smoke 2
Characterization of RLS 2
Coagulation of Natural Rubber 3
Physical Property Testing of Sheet Rubber 3
RESULTS AND DISCUSSION 5
Redistilled Liquid Smoke 5
Chemical Constituents in The RLS 6
Coagulation of Natural Rubber 9
Physical Properties of Sheets Rubber 10
CONCLUSIONS 14
REFERENCES 14
APPENDICES 17
LIST OF TABLES
1 pH and total acid content of RLS and CLS 6
2 Volume of coagulant and serum separation 9
3 SNI 06-1903-2000 for Standard Indonesian Rubber 3L 10
LIST OF FIGURES
5 Chemical constituents in CLS 8
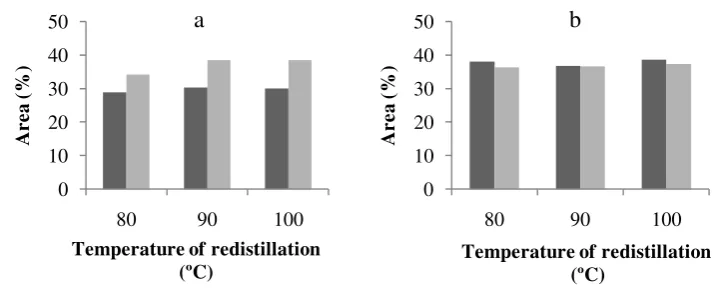
6 The comparation of acetic acid ( ) and phenol ( ) area between first
(a) and second (b) collection of RLS 9
7 Sheet rubber coagulated by using formic acid 1% (a), RLS 90 ºC (b),
CLS (c) 10
8 Effect of coagulants on initial plasticity of sheet rubber 11 9 PRI values on rubber sheet using different coagulants 11 10 Nitrogen content on rubber sheet using different coagulants 12 11 Volatile matter on rubber sheet using different coagulants 13 12 Accelerated storage hardening values on rubber sheet 14
LIST OF APPENDICES
1 Total acid content 16
2 GC-MS result of RLS 80 ºC from the first collection 17 3 GC-MS result of RLS 80 ºC from the second collection 18 4 GC-MS result of RLS 90 ºC from the first collection 19 5 GC-MS result of RLS 90 ºC from the second collection 20 6 GC-MS result of RLS 100 ºC from the first collection 21 7 GC-MS result of RLS 100 ºC from the second collection 22
8 GC-MS result of CLS 23
9 Sheet rubbers that were coagulated by formic acid, RLS, and CLS 24 10 Wallace plasticity (Po) and plasticity retention index (PRI) 25
11 Statistical analysis for Wallace plasticity (Po) 26
12 Statistical analysis for plasticity retention index (PRI) 27
13 Nitrogen content 28
14 Statistical analysis for nitrogen content 29
16 Statistical analysis for volatile matter content 31
INTRODUCTION
Indonesia is one of the world’s largest producers and exporters of palm oil,
producing over 18 million tons of palm oil, annually. Global demand for palm oil is expected to grow further in the future; palm oil offers promising economic prospects for Indonesia (World Growth 2011). According to Directorate General Estate Crop, Ministry of Agriculture (2010), oil palm plantation in Indonesia cover approximately 8.4 million hectares in 2010 and this area is expected to increase to 13 million hectares by 2020. Despite the significant benefit, oil palm mill also generates wastes, among them are empty fruit bunches (EFB), mesocarp fruit fibers (MF), palm oil mill effluent (POME), and oil-palm shells (Sulaiman et al. 2010). Currently, in some plantations EFB and POME are used as fertilizer for plantation, while fibers and shells are burnt to generate fuel to produce power for the mill operations. However, burning the bio-wastes contributes to air pollution (Hayashi 2007).
One of the strategic ways to utilize oil-palm shells is by converting it into liquid smoke. The pyrolysis of lignocelullosic materials produces liquid smoke or also known as wood vinegar. The liquid smoke is generally dark brown in color, viscous, and composed of a very complex mixture of oxygenated hydrocarbons. The dominant constituents in liquid smoke based on their functional groups are carboxylic acids, phenols, and carbonyls (Ramakrishnan and Moeller 2002; Ratanapisit et al. 2009).
Indonesia also has the largest area of rubber plantation in the world which is dominated by smallholders which make up for 84.5% of 3.2 million hectare of cultivated land (Setiawan and Andoko 2005). Hence, rubber is a potential commodity that plays important role in economic growth. Natural rubber (Havea
brasiliensis) can be processed into primary rubber product such as sheet rubber
through coagulation by acid, then followed by certain processes to produce various final rubber products (White and De 2001). Formic acid is one of available coagulants recommended by the prevailing regulation (BSN 2000). Beside formic acid, acetic acid is also recommended as coagulant. Both are preferred due to their volatile nature and being noncorrosive (White and De 2001). Asni et al. (2012) reported various coagulants which are commonly used, but not really recommended for natural rubber coagulation, i.e. sulfuric acid, phosphate fertilizer, and alum. Those coagulants are known to cause low quality of natural rubber products and result in lower price of the final products.
Acid content in liquid smoke is potential to be utilized as natural rubber coagulant. The predominant acid in liquid smoke derived from oil-palm shells is acetic acid (Achmadi et al. 2013). Utilization of liquid smoke as natural rubber coagulant as reported by Baimark et al. (2008) indicates that raw and tar-extracted liquid smoke prepared from Eucalyptus globulus can be used as coagulant for natural rubber. According to Prasertsit et al. (2011), crude coconut shell liquid smoke improves the physical properties of sheet rubber and can prevent fungal growth on sheet rubber due to phenolics and acetic acid contents.
2
smoke was redistilled at 80, 90, and 100 ºC. At those temperatures more acids content can be obtained. The coagulation property of the redistilled liquid smoke (RLS), crude liquid smoke (CLS), and formic acid were examined.
METHODS
The experiment was done in 5 steps, starting with redistillation of CLS; characterization of the redistillate which consists of pH measurement, total acid content; and identification of chemical constituents using gas chromatography-mass spectrometer (GC-MS) instrument; coagulation of natural rubber; and finally physical properties test for the rubber sheets.
CLS was obtained from PT Global Deorub Industry, located in Palembang, and was redistilled using a concentration boule type TA62D in the Laboratory of Process, available in the Center for Agro-Based Industry (BBIA), Cikaret, Bogor. The temperature of redistillation was 80, 90, and 100 ºC. Chemical constituents in RLS were identified using GC-MS instrument in the Center for Forensic Laboratory (Puslabfor), Police Head quarters (Mabes Polri), Jakarta. RLS, CLS, and formic acid were individually used to coagulate natural rubber latex. The latex was tapped from rubber plantation owned by the Center for Plantation Biotechnology Research (BPBP) in Ciomas, Bogor. Physical properties determination of rubber sheet were the Wallace plasticity, plasticity retention index, nitrogen content, accelerated storage hardening test, and volatile matter. Statistical analysis was done using SPSS 16.0 for Windows.
Redistillation of Liquid Smoke
Approximately 60 L of CLS from oil-palm shells was filtered and was divided into 3 separate containers. CLS was redistilled using a concentration boule type TA62D at 80, 90, and 100 ºC. RLS were collected in separate closed containers. The collection of RLS was repeated twice. The first collection was done at the first 5 min and the second was done for the next 5 min. Each collection was 5 L of RLS (modification of Achmadi et al. 2013).
Characterization of RLS Measurement of pH
The pH of RLS was measured by calibrated pH meter using buffer solution of pH 4 and 7. Fifty mL of RLS was measured for its pH.
Total Acid Content (AOAC 2005)
3
GC-MS Analysis (Achmadi et al. 2013)
Chemical constituents in RLS were identified using a gas chromatography (GC-17A Shimadzu) mass spectrometry (MS QP 5050A) instrument. The GC-MS was equipped with 60-meter HP5 column. Detector temperature was at 250, 280, 290 ºC, respectively. Helium was used as carrier gas with flow rate of 23.7 mL min-1 at 17.56 psi pressure. The injected volume of RLS was 1 µL.
Coagulation of Natural Rubber
Fresh natural rubber was tapped and collected in a container that has been filled with ammonia to preserve the field latex for the transportation to the laboratory. The amount of ammonia that should be added has to be precalculated properly; the dose of ammonia used was determined as 0.05%. The field latex was filtered and the dry rubber content (DRC) of latex was determined. Subsequently, the field latex was diluted with water until DRC of latex reached 20%. Fifteen beaker glasses were prepared and each beaker was filled with approximately 300 mL of latex. Coagulants that used in the experiment were 1% formic acid as the standard coagulant for natural rubber (Cecil and Mitchell 2005), 25% RLS 80, 90, 100 ºC, and 25% CLS, respectively. Each coagulant treatment was performed in triplicates.
The coagulant was added to beaker glass dropwise until pH of the latex reached 5.0. The pH value was checked using universal pH paper. The amount of coagulant added to gain the favorable pH was then used as the standard to coagulate the other replicates. The field latex formed coagulum as the result of coagulation. The coagulum was left for about 19 hours to complete the coagulation. Serum separation was observed, then the coagulum was compressed between 2 rolls, washed with water, and it turned into sheet rubber. Sheet rubber was air-dried for 1 hour and followed by oven-drying for 11 hours at 50−60 ºC (modification of Baimark et al. 2008). Physical properties of sheet rubber were determined according to Indonesia National Standard (SNI) 06-1903-2000, including Wallace plasticity, plasticity retention index, nitrogen content, accelerated storage hardening test (ASHT), and volatile matter.
Physical Property Testing of Sheet Rubber
Wallace Plasticity and Plasticity Retention Index (SNI 06-1903-2000)
Test portion of about 15−25 g from the homogenized sample was taken and it was passed at maximum 3 times between mill rolls at room temperature with adjusted rolls so that the final the sheet thickness was approximately 1.6−1.8 mm. The process was repeated if the sheets thickness did not met the requirement. The sheet was doubled and the two halves were pressed lightly together. Six test specimens from the doubled sheet were formed with the Wallace punch and their thickness were measured until six test pellets were obtained with thickness of
4
and the other for testing after aging for 30 min at 140 ºC. After that, the test-pieces were removed from the oven. Then, they were allowed to cool down to room temperature.
Two pieces of tissue paper were placed between the heated platens and the thickness measuring device was set to zero when the platens are closed. A pellet was inserted at room temperature between the two pieces of tissue paper and the whole assembly was placed centrally between the heated platens. The machine lever was put into operation after 15 seconds conditioning period; the timing device automatically releases the force 100 N to compress the specimen. This load period will automatically adjust, exactly in 15 seconds duration. The final thickness was expressed in units equivalent to 0.01 mm, remains locked after the 15-s period on the dial micrometer until the operation handle was moved to open the instrument. The measured thickness was recorded from the dial micrometer. That process was repeated for each specimen, both aged and in original condition.
The plasticity in original condition is called initial plasticity (Po) or also
known as Wallace plasticity. Plasticity retention index (PRI) can be calculated by the percentage ratio between aged plasticity (Pa) and Po.
Nitrogen Content (SNI 06-1903-2000)
About 0.3 g sample of the homogenized sheet rubber was weighed accurately and was placed in a Kjeldahl flask. Approximately 1.95 g catalyst mixture and 9 mL of concentrated H2SO4 were added. The flask was heated until
the solution turned into clear green color (or colorless) and there was no yellow color appears, and then it cooled, and transferred to distillation apparatus. The flask was rinsed with 30 mL distilled water and 30 mL of 3% boric acid solution and 2−3 drops of indicator (mixture of methylene blue and methyl red) were added into the distillate container.
67% NaOH solution (30 mL) was added to the steam distillation apparatus, and the funnel was washed with 30 mL distilled water. The distillation was run to collect distillate of 100 to 200 mL. The distillate was titrated with 0.2 N H2SO4.
The endpoint was confirmed when the color of the solution changed from green to red-purple. A blank test was performed in the same manner.
Accelerated Storage Hardening Test (SNI 06-1903-2000)
Sample preparation of accelerated storage hardening (ASH) test was similar
to that for the PRI test. The speciments were prepared until 6 test pellets were
obtained with thickness of 3.2−3.6 mm (precision was 0.01 mm) and diameter of ±13 mm. Weighing bottle and the pellets should be clean and dry. The 6 test pellets were divided into 2 groups (test pellets number 1 and 2). 6−8 g of phosphorus pentaoxide (P2O5) and test pellets number 2 were put into the
weighing bottle and were arranged so that each of the test pellets were apart from each other.
Silicon grease was spread on the weighing bottle cap. The weighing bottle was heated in an oven at 60 ± 1 ºC for 24 ± 1 hour. After 30 min, the bottle was checked as it should be airtight; the time was recorded afterward. Plasticity of test pellets number 1 (Po) and number 2 (PH) were measured, and the difference
5 Volatile Matter (SNI 06-1903-2000)
Sample preparation of volatile matter was similar to that for the PRI test. About 10 g of sample was cut, weighed, and passed through the mill rolls until its thickness reached 1.55 mm. Then it was cut until the size was about 2.5 mm × 2.5 mm. The samples were then placed on an preweighed porcelain crucible and was heated in oven at 100 ± 3 ºC for 3 hours, after being allowed to cool for 30 min, the samples were weighed.
Statistical Analysis
The observed data on physical properties of rubber sheets were subjected to analysis of variance (One-Way ANOVA) and if there was any significant difference, then Duncan multiple range test at α = 0.05 was used to determine the difference among the treatment means.
RESULTS AND DISCUSSION
Redistilled Liquid Smoke
The CLS turned into clear yellowish (Figure 1) after the redistillation. Dark color in CLS comes from tar, which is one of the products of the pyrolyzed lignocellulosics. The temperature of redistillation was set at 80, 90, and 100 ºC, and as the boiling point of tar is above 300 ºC, this component presumably did not vapourize, so that it could be separated from the RLS (White and De 2001).
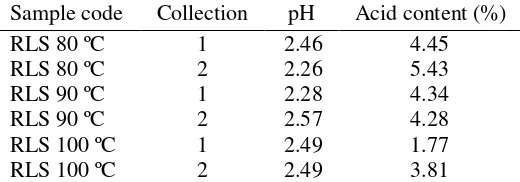
The pH value and total acid content of RLS and CLS are shown on Table 1. The calculation of total acid content is displayed in Appendix 1. The pH of RLS ranged from 2.26 to 2.57 and pH for CLS was 2.30. The CLS has higher total acid content than RLS. Total acid content of RLS ranged from 1.77 to 5.43%. Among the samples, RLS 80 ºC from first collection had the highest total acid content, i.e. 5.43%.
Figure 1 Color of the crude liquid smoke (CLS, a) and the redistilled liquid smoke (RLS, b)
6
Table 1 pH and total acid content of RLS and CLS Sample code Collection pH Acid content (%)
RLS 80 ºC 1 2.46 4.45 hemicelluloses. The composition of lignocellulosic determines the acid content in liquid smoke. Kadir et al. (2010) compares CLS from coconut hybrid containing cellulose and hemicelluloses up to 53.05%. The acid content reachs 12.57%. On the other hand, with cellulose and hemicellulose content in oil-palm shells of 42.8 % (Shibata et al. 2008), the acid content is only 7.70%.
Achmadi et al. (2013) reported that redistillation of liquid smoke from oil-palm shells at 80±5 ºC, result in pH of 3.2 and total acid of 9.14%. Another experiment carried out by Irsaluddin (2010) showed that RLS of coconut shells at 111.5, 112.5 and 114.5 ºC resulted in pH ranging from 2.65 to 3.00. The difference of chemical components in liquid smoke is affected by several factors, such as composition of biomass, temperature and atmosphere of pyrolysis, rate of heat transfer, vapor and particle residence time, as well as particle size (Ramakhrisnan and Moeller 2002).
Redistillation is one of the available ways to purify the original liquid smoke from undesirable components such as tar and polyaromatic hydrocarbons (PAH) (Darmaji 2002). This way, the purity of acids as the main component of liquid smoke to coagulate natural rubber, can be enhanced.
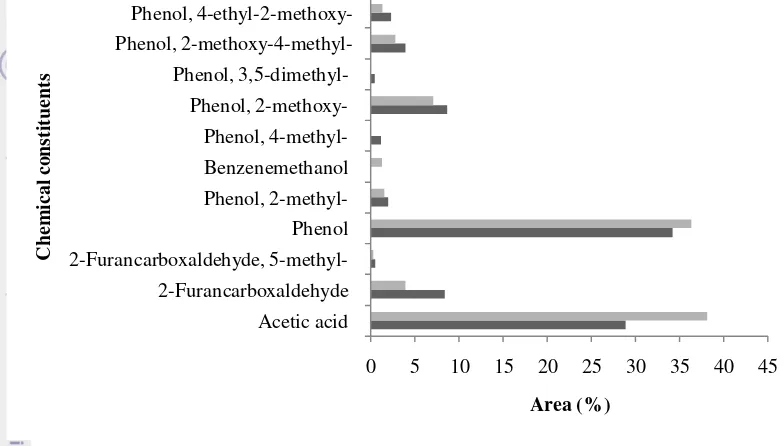
Chemical Constituents in The RLS
The chemical constituents of the RLS as identified by using GC-MS instruments are displayed in Figure 2, 3, and 4, each for the the first and the second collection. While, chemical constituents in CLS is displayed in figure 5. Those chemical constituents were chosen due to their similarities (higher than
90%) with the instrument’s database. The area, retention time, and similarity
percentage of chemical constituents of each RLS can be seen in Appendix 2−7, and CLS in Appendix 8.
7 Lignin is the predominant constituent of oil-palm shells which make up for 51.5% (wt), followed by hemicellulose (22.3% wt), and cellulose (20.5% wt) (Shibata et al. 2008). Oil-palm shell is lignin-rich source, therefore, phenol may be the main pyrolysis product that predominate the liquid smoke. This fact is in line with our results, being the phenols and acetic acid predominate. Acids and phenols also contribute to acidic property of the RLS.
Figure 2 Chemical constituents in RLS 80 ºC; the first collection area ( ), and the second collection area ( )
8
Figure 4 Chemical constituents in RLS 100 ºC; the first collection area ( ) and ( ) the second collection area
Figure 5 Chemical constituents in CLS
In the process of redistillation, RLS was collected twice at each temperature. The chemical constituents in the first collection is richer that that of the second collection of RLS 80 ºC and RLS 90 ºC. The opposite happens in RLS 100 ºC, being the first collection is richer in constituents than that of the second. During the redestillation, constituents with lower boiling point vapourize first and followed by that with higher boiling point. Hence, the first collection generally coagulant in the following step for preparing sheet rubber.
9
Chemical constituents in the second collection of RLS 80 °C that were similar to RLS 90 °C. There are 9 constituents in RLS 80 °C and RLS 90 °C. While, RLS 100 ºC has less constituents (8 constituents). Benzenemethanol only appears in RLS 80 °C and RLS 100 °C, 2-furancarboxaldehyde, 5-methyl- appears in RLS 80 °C and RLS 90 °C and phenol, 4-methyl only appears in RLS 90 ºC. needed to reach that pH was different for each treatment.
Natural rubber or latex is a colloidal system of rubber globules suspended in aqueous serum and surrounded by a protective layer of protein and phospholipids. Negative charge which is present on the protective layer stabilizes the latex. Coagulation is achieved by neutralizing the negative charge on the rubber particle so that they coalesce. Formic acid is preferred as coagulant based on its volatile nature and non-corrosive characteristic. Besides formic acid, acetic acid is also
Table 2 Volume of coagulant and serum separation Coagulants Volume of coagulant
(mL) Serum colour
Formic acid 17 Not sufficiently clear
10
recommended to be used as coagulant (White and De 2001). Acetic acid and phenol that are predominant constituents in RLS contribute in natural rubber coagulation.
The concentration of RLS for coagulation used in this experiment was much higher than that of the formic acid due to several chemical constituents that affect the acidity of coagulant. In this experiment, 25% of RLS was used; on the other hand, only 1% formic acid was used.
The objective of diluting latex before coagulation is to produce a liquid with a standard DRC 15−20% (Cecil and Mitchell 2005). In the experiment, the latex was diluted until the DRC reached 20%. It is desirable to coagulate latex with the maximum DRC and to make a sheet as large and as thin as possible. Coagulum made with maximum DRC will not be easy to deform during handling in sheeting machines. After coagulation, the coagulum should be completely uniform, with the correct texture, plasticity, and density. This will ensure the best results on machining and drying. The residual serum should be clear (Kurian and Peter 2002; Cecil and Mitchell 2005). In the experiment, complete serum separation was not observed.
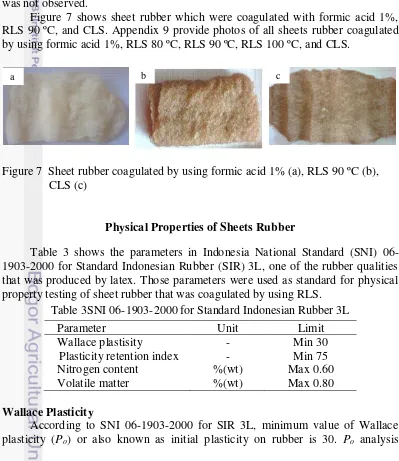
Figure 7 shows sheet rubber which were coagulated with formic acid 1%, RLS 90 ºC, and CLS. Appendix 9 provide photos of all sheets rubber coagulated by using formic acid 1%, RLS 80 ºC, RLS 90 ºC, RLS 100 ºC, and CLS.
Figure 7 Sheet rubber coagulated by using formic acid 1% (a), RLS 90 ºC (b), CLS (c)
Physical Properties of Sheets Rubber
Table 3 shows the parameters in Indonesia National Standard (SNI) 06-1903-2000 for Standard Indonesian Rubber (SIR) 3L, one of the rubber qualities that was produced by latex. Those parameters were used as standard for physical property testing of sheet rubber that was coagulated by using RLS.
Table 3SNI 06-1903-2000 for Standard Indonesian Rubber 3L
Parameter Unit Limit
Wallace plastisity - Min 30
Plasticity retention index - Min 75
Nitrogen content %(wt) Max 0.60
Volatile matter %(wt) Max 0.80
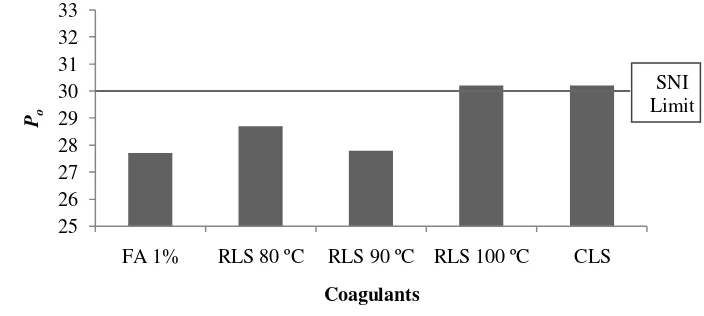
Wallace Plasticity
According to SNI 06-1903-2000 for SIR 3L, minimum value of Wallace plasticity (Po) or also known as initial plasticity on rubber is 30. Po analysis
11 showed that only RLS 100 ºC and CLS as coagulant that fulfilled the requirement. Figure 8 shows that the highest Po was obtained by using RLS 100 ºC and CLS,
then followed by RLS 80 ºC, 90 ºC, and formic acid 1%.
Figure 8 Effect of coagulants on initial plasticity of sheet rubber
The analysis of variance figured that coagulants gave significant difference on Po values. Duncan test revealed that RLS 100 ºC and CLS had high influence
on Po compare to other coagulants. The data of Po measurement can be seen on
Appendix 10, while statistical analysis for Po in the Appendix 11.
Plasticity Retention Index
Minimum value of PRI on rubber is 75 according to SNI 06-1903-2000 for SIR 3L. Figure 9 shows that the highest PRI value was obtained by using formic acid 1% as coagulant, while other coagulants had slightly similar PRI value. All coagulants produced PRI that fulfilled the SNI requirement.
Figure 9 PRI values on rubber sheet using different coagulants
12
formic acid, RLS 100 ºC was the second best coagulant that produced high PRI value.
According to Baimark et al. (2008), PRI value of sheet rubber that was coagulated by raw wood vinegar or CLS of Eucalyptus globulus, tar-extracted CLS, formic acid, and acetic acid were 95.40, 104.70, 90.30, and 104.60, respectively. In the experiment, the PRI value of sheet rubber coagulated by formic acid, RLS 80 ºC, RLS 90 ºC, RLS 100 ºC, and CLS were 119.03, 99.43, 102.37, 104.43, and 99.47, respectively.
High PRI values are generally associated with rubbers that possess good resistance to thermal oxidative breakdown. Both Po and PRI are basic parameters
to determine the quality of sheet rubber. According to Po test, RLS 100 ºC and
CLS fulfilled SNI requirement, while in PRI test, formic acid had the highest PRI value and the followed by RLS 100 ºC. This result indicated that RLS 100 ºC gave a good performance to coagulate natural rubber compared to other RLS.
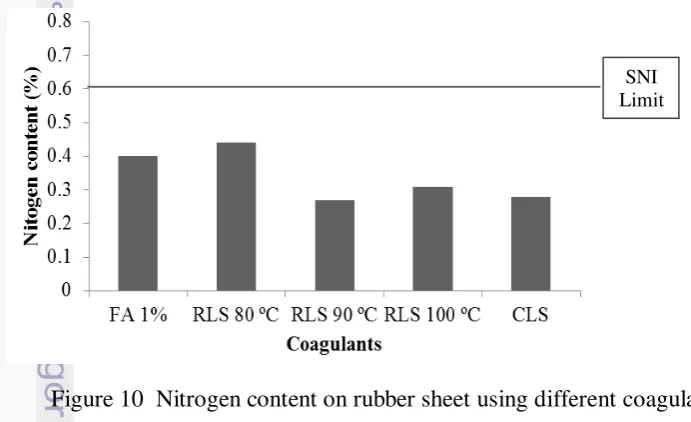
Nitrogen Content
According to SNI 06-1903-2000 for SIR 3L, nitrogen content in rubber should not exceed 0.60%. All coagulants produced nitrogen content lower than 0.60%. Figure 10 shows that RLS 80 ºC had the highest nitrogen content compared to other coagulants. The data of nitrogen measurement can be seen in Appendix 13. The analysis of variance showed that coagulants also gave significant difference on nitrogen content. Duncan test revealed that RLS 80 ºC gave high influence on nitrogen content as compared to other coagulants. Statistical analysis of nitrogen content is shown in Appendix 14.
Figure 10 Nitrogen content on rubber sheet using different coagulants Volatile Matter
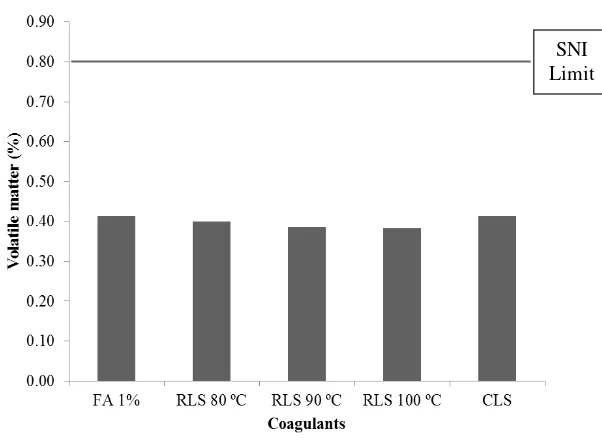
SNI 06-1903-2000 for SIR 3L states that volatile matter in rubber should not exceed 0.80%. Figure 11 shows that all coagulants produced volatile matter content lower than 0.80%. Volatile matter measurement is shown in Appendix 15. The analysis of variance showed that coagulants gave no significant difference on the volatile matter (Appendix 16).
13
Figure 11 Volatile matter on rubber sheet using different coagulants Volatile matter test was done to confirm whether high PRI values related to incomplete drying process. If the drying was not complete, the heat on PRI test would be used to vaporize the water instead of oxidizing the rubber. Thus, the result of PRI test would not represent the actual resistance of rubber toward thermal oxidation. In the experiment, all coagulants produced volatile matter values that were below 0.80%, which means that the drying process was complete and high PRI value does not relate to incomplete drying process.
Accelerated Storage Hardening Test
Stabilization of viscosity is commonly evaluated by accelerated storage hardening (ASH) test. The increase on initial plasticity should be less than eight. Figure 12 shows that all coagulants produced ASH value higher than eight. ASH measurement is shown in Appendix 17. Natural rubber undergoes hardening during storage, especially under low humidity. The increase of viscosity is caused by crosslinking reaction involving the randomly distributed carbonyl groups on the rubber molecules. Amnuaypornsri et al. (2009) reports that interaction of fatty acid ester group in phospholipids at chain ends of rubber molecules is responsible
for the formation of crosslinking during storage. It was assumed that there are
RLS constituents preventing the storage hardening. The assumption was not proved in this experiment; the ASH values produced by applying RLS exceed 8 magnitudes.
14
Figure 12 Accelerated storage hardening values on rubber sheet
CONCLUSIONS
The result showed that RLS 100 ºC from the second collection was recommended as natural rubber coagulant, as this coagulant produced Wallace plasticity that meet the standard and high plasticity retention index value. The assumption of constituents in RLS that can prevent the storage hardening in rubber was not proved. For further research, it is recommended to study more about the redistillation to enhance the acid content recovery, i.e by prolonging the holding temperature of redistillation. In this research, only one concentration of coagulant that was used. It is also recommended to vary the coagulant preservatives. J Appl Sci. 13(3):401-408. doi:10.3923/jas.2013.401-408. Amnuaypornsri S, Nimpalboon A, Sakdapipanich J. 2009. Role of phospolipid on
gel formation and physical properties of NR during accelerated storage.
KGK·März. 88-92.
[AOAC] Association of Official Analytical Chemist. 2005. Official Methods of
Analysis. 18th Ed. Washington DC (US): AOAC.
Asni N, Firdaus, Endrizal. 2012. Identifikasi dan analisa mutu lateks asalan (slab) di provinsi Jambi. Jambi (ID): BPTP Jambi.
15 [BSN] Badan Standardisasi Nasional. 2000. SNI 06-1903-2000. Standard
Indonesian Rubber (SIR). Jakarta (ID): BSN.
Cecil J, Mitchell P. 2005. Processing of Natural Rubber FAO [Internet]. [downloaded 2014 Feb 16th]. Available at: http://ecoport.org/ep?SearchType = earticleView&earticleId=644&page=-2.
Darmaji P. 2002. Optimasi permunian asap cair dengan metoda redestilasi. J
TeknolIndust Pangan. 13(3):267-271.
Directorate General Estate Crop, Ministry of Agriculture. 2010. Agricultural
Statistics Database. Jakarta (ID): Ministry of Agriculture.
Girrard JP. 1992. Smoking in Technology of Meat and Meat Products. New York (US): Ellis Harwood.
Hayashi K. 2007. Environmental impact of palm oil industry in Indonesia. In:
Proceedings of International Symposium on EcoTopia Sciences 2007
ISETS07 [Internet]. [Time and place of meeting are unknown]. Nagoya (JP):
Nagoya University. p 646-65; [downloaded 2014 Nov 26th]. Available at: www.esi.nagoya-u.ac.jp/h/isets07/Contents/Session05/1003Hayashi.pdf. Irsaluddin. 2010. Kajian teknik penyulingan ulang (redistilasi) untuk
meningkatkan mutu asap cair [skripsi]. Bogor (ID): Institut Pertanian Bogor. Kadir S, Darmadji P, Hidayat C, Supriyadi. 2010. Fraksinasi dan identifikasi senyawa volatil pada asap cair tempurung kelapa hibrida. Agritech. 30(2):57-67.
Kurian A, Peter KV. 2007. Commercial Crops Technology. Peter KV, editor. New Dehli (IN): New India Pub.
Maga JA. 1988. Smoke in Food Processing. Boca Raton (US): CRC Pr.
Prasertsit K, Rattanawa N, Ratanapisit J. 2011. Effect of wood vinegar as an additive for natural rubber products. Songklanakarin J Sci Technol. 33(4):425-430.
Ramakrishnan S, Moeller P. 2002. Liquid smoke: product of hardwood pyrolysis.
Fuel Chem Division Preprint.47(1):366-367.
Ratanapisit J, Apiraksakul S, Rerngnarong A, Chungsiriporn J, Bunyakorn C. 2009. Preliminary evaluation of production and characterization of wood vinegar from rubberwood. Songklanakarin J Sci Technol. 31(3):343-349. Setiawan DH, Andoko A. 2005. Petunjuk Lengkap Budidaya Karet. Jakarta (ID):
Agromedia Pustaka.
Shibata M, Varman M, Tono Y, Miyafuji H, Saka S. 2008. Characterization in chemical composition of the oil palm (Elaeis guineensis). J Jpn Inst Energy.
87(5):383-388.
Sulaiman F, Abdullah N, Gerhauser H, Shariff A. 2010. A perspective of oil palm and it wastes. J Phys Sci. 21(1):67-77.
White JR, De SK. 2001. Rubber Technologist’s Handbook. Shawbury (UK): Rapra Technology.
16
Appendix 1 Total acid content
Samples Collection Volume of NaOH (mL) Acid content (%w/v) pH
1 2 3
RLS 80 ºC 1 7.75 7.75 7.80 4.45 2.46
RLS 80 ºC 2 9.50 9.50 9.50 5.43 2.26
RLS 90 ºC 1 7.60 7.60 7.60 4.34 2.28
RLS 90 ºC 2 7.50 7.50 7.50 4.28 2.57
RLS 100 ºC 1 3.10 3.10 3.10 1.77 2.49
RLS 100 ºC 2 6.70 6.65 6.65 3.81 2.49
CLS - 13.50 13.50 13.45 7.70 2.30
Calculation:
N NaOH= 0.0952 N
Volume of sample = 1.00 mL Molecular weight (gram/mol)= 60
% Total acid content= VNaOH ×NNaOH ×60×100%
1000 ×Vsample
= 7.75 mL ×0.0952 N×60×100%
1000 ×1.00 mL
= 4.43%
Average of total acid content = 4.43%+4.43%+4.48%
3
17
Chemical constituents Retention time (min)
2-Furancarboxaldehyde 5.15 8.39 91
2-Furancarboxaldehyde, 5-methyl- 6.22 0.49 91
Phenol 6.39 34.23 94
Phenol, 2-methyl- 7.09 1.95 97
Phenol, 4-methyl- 7.31 1.16 97
Phenol, 2-methoxy- 7.46 8.63 97
Phenol, 3,5-dimethyl- 8.03 0.46 97
Phenol, 2-methoxy-4-methyl- 8.46 3.90 95
Phenol, 4-ethyl-2-methoxy- 9.28 2.29 95
1 . 0 0 2 . 0 0 3 . 0 0 4 . 0 0 5 . 0 0 6 . 0 0 7 . 0 0 8 . 0 0 9 . 0 0 1 0 . 0 0
18
Chemical constituents Retention time (min)
2-Furancarboxaldehyde 5.16 3.91 91
2-Furancarboxaldehyde, 5-methyl- 6.22 0.27 91
Phenol 6.40 36.34 94
Appendix 3 GC-MS result of RLS 80 ºC from the second collection
19
Chemical constituents Retention time (min)
2-Furancarboxaldehyde 5.16 8.38 91
2-Furancarboxaldehyde, 5-methyl- 6.22 0.46 91
Phenol 6.37 38.60 91
20
Chemical constituents Retention time (min)
2-Furancarboxaldehyde 5.16 4.87 91
2-Furancarboxaldehyde, 5-methyl- 6.22 0.29 91
Phenol 6.39 36.70 91
21 Appendix 6 GC-MS result of RLS 100 ºC from the first collection
1 . 0 0 2 . 0 0 3 . 0 0 4 . 0 0 5 . 0 0 6 . 0 0 7 . 0 0 8 . 0 0 9 . 0 0 1 0 . 0 0
Chemical constituents Retention time (min)
2-Furancarboxaldehyde 5.15 7.35 90
Phenol 6.37 38.60 91
Phenol, 2-methyl- 7.09 1.80 97
Phenol, 2-methoxy- 7.45 8.04 97
Phenol, 2-methoxy-4-methyl- 8.45 3.26 95
22
Appendix 7 GC-MS result of RLS 100 ºC from the second collection
Chemical constituents Retention time (min)
2-Furancarboxaldehyde 5.15 4.11 91
23 Appendix 8 GC-MS result of CLS
2.00 4.00 6.00 8.00 10.00 12.00 14.00 16.00 18.00 20.00 22.00 1000000
2-Furancarboxaldehyde 5.81 2.62 90
Phenol 7.02 40.91 91
2-Cyclopenten-1-one, 2-hydroxy-3-m 7.53 1.02 96
Phenol, 2-methyl- 7.74 0.83 96
Phenol, 4-methyl- 7.94 0.95 96
Phenol, 2-methoxy- 8.16 4.02 97
24
Coagulant: Formic acid 1% Coagulant: RLS 80 °C
Coagulant: RLS 90 °C Coagulant: RLS 100 °C
Coagulant: CLS
25 Appendix 10 Wallace plasticity (Po) and plasticity retention index (PRI)
Samples
Speciment thickness (mm)
Speciment thickness (mm)
Median of
Median of PRI
Po Pa Po Pa
FA 27.0 27.0 27.0 34.0 34.0 33.0 27.0 34.0 125.9
1% 28.0 28.0 27.0 32.5 33.0 32.0 28.0 32.5 116.1
28.0 28.5 28.0 34.0 33.5 33.5 28.0 33.5 119.6 RLS 28.0 28.0 27.5 28.0 27.5 27.0 28.0 27.5 98.2 80 ºC 29.0 30.0 29.5 29.0 29.0 28.5 29.5 29.0 98.3 29.0 28.5 28.5 28.5 29.0 29.0 28.5 29.0 101.8 RLS 27.5 28.0 26.5 28.0 27.0 26.5 27.5 27.0 98.2 90 ºC 27.5 27.0 27.5 28.5 29.0 28.0 27.5 28.5 103.6
28.5 28.0 29.0 30.0 30.0 29.5 28.5 30.0 105.3 RLS 30.0 30.0 30.5 32.0 32.0 32.0 30.0 32.0 106.7 100 ºC 30.0 30.0 30.5 32.0 31.5 30.5 30.0 31.5 105.0 30.0 31.0 30.5 31.0 31.0 30.5 30.5 31.0 101.6 CLS 31.0 29.5 30.0 30.5 31.0 30.0 30.0 30.5 101.7 30.0 30.0 30.5 29.0 30.0 29.5 30.0 29.5 98.3 30.0 30.5 30.5 30.0 30.0 29.5 30.5 30.0 98.4 Calculation:
PRI = (Pa/Po) × 100
where
Po = plasticity original
26
Appendix 11 Statistical analysis for Wallace plasticity (Po)
ANOVA
Sum of Squares df Mean
Square F Sig.
Between groups 17.767 4 4.442 15.676 0.000
Within groups 2.833 10 0.283
Total 20.600 14
Sig.<0.05 means there is significant difference among treatments, Duncan test was applied.
Duncan test
Treatment Subset for alpha = 0.05
1 2
FA 27.6667
RLS 90 ºC 27.8333 RLS 80 ºC 28.6667
RLS 100 ºC 30.1667
CLS 30.1667
Sig. 0.052 1.000
27 Appendix 12 Statistical analysis for plasticity retention index (PRI)
ANOVA
Sum of Squares df Mean
Square F Sig.
Between groups 797.344 4 199.336 27.921 0.000
Within groups 71.393 10 7.139
Total 868.737 14
Sig.<0.05 means there is significant difference among treatments, Duncan test was applied.
Duncan test
Treatment Subset for alpha = 0.05
1 2
RLS 80 ºC 99.4333
CLS 99.4667
RLS 90 ºC 102.3667 RLS 100 ºC 104.4333
FA 119.0333
Sig. 0.058 1.000
28
Appendix 13 Nitrogen content Samples Sample weight
(g)
Normality of H2SO4
Volume of H2SO4 (mL) Nitrogen
content (%) start end total
FA 0.3031 0.2072 6.00 6.60 0.60 0.43
1% 0.3241 0.2072 7.00 7.60 0.60 0.40
0.3026 0.2072 9.00 9.55 0.55 0.38
RLS 0.3461 0.2072 10.00 10.65 0.65 0.42
80 ºC 0.336 0.2072 11.00 11.68 0.68 0.46
0.353 0.2072 12.00 12.70 0.70 0.45
RLS 0.3462 0.2258 12.00 12.40 0.40 0.23
90 ºC 0.325 0.2258 13.00 13.42 0.42 0.26
0.3443 0.2258 14.00 14.50 0.50 0.32
RLS 0.3184 0.2258 15.00 15.48 0.48 0.33
100 ºC 0.3102 0.2258 16.00 16.42 0.42 0.28
0.3238 0.2258 17.00 17.48 0.48 0.32
CLS 03497 0.2258 18.00 18.45 0.45 0.27
0.3403 0.2258 19.00 19.45 0.45 0.28 0.3204 0.2258 21.00 21.45 0.45 0.30 Calculation:
Nitrogen content =( 1− 2)×�×0.0140× 100% where
V1 = Volume of H2SO4 to titrate the sample (mL)
V2 = Volume of H2SO4 to titrate blank (mL)
N = Normality of H2SO4
29 Appendix 14 Statistical analysis for nitrogen content
ANOVA
Sum of Squares df Mean Square F Sig.
Between groups 0.071 4 0.018 21.659 0.000
Within groups 0.008 10 0.001
Total 0.079 14
Sig.<0.05 means there is significant difference among treatments, Duncan test was applied.
Duncan test
Treatment Subset for alpha = 0.05
1 2
RLS 90 ºC 0.2700
CLS 0.2833
RLS 100 ºC 0.3100
FA 0.4033
RLS 80 ºC 0.4433
Sig. 0.133 0.118
30
Appendix 15 Volatile matter content
Samples
a = sample + crucible weight before heating
b = sample + crucible weight after heating
31 Appendix 16 Statistical analysis for volatile matter content
ANOVA
Sum of Squares df Mean Square F Sig.
Between groups 809.972 4 202.493 1.000 0.451
Within groups 2024.013 10 202.401
Total 2833.985 14
32
Appendix 17 Accelerated storage hardening content
Samples
Speciment thickness (mm)
Po
Speciment thickness (mm)
PH
Median of
Po
Median of
PH
ASH value
FA 27.0 27.0 27.0 90.0 85.5 85.0 27.0 85.5 58.5
1% 28.0 28.0 27.0 84.0 85.5 85.0 28.0 85.0 57.0
28.0 28.5 28.0 85.5 88.0 86.0 28.0 86.0 58.0
RLS 28.0 28.0 27.5 79.0 77.5 84.0 28.0 79.0 51.0
80 ºC 29.0 30.0 29.5 89.0 87.0 82.0 29.5 87.0 57.5 29.0 28.5 28.5 85.0 85.0 85.0 28.5 85.0 56.5
RLS 27.5 28.0 26.5 85.0 85.5 86.0 27.5 85.5 58.0
90 ºC 27.5 27.0 27.5 74.0 77.0 77.0 27.5 77.0 49.5 28.5 28.0 29.0 84.0 83.0 82.5 28.5 83.0 54.5
RLS 30.0 30.0 30.5 74.0 78.0 75.0 30.0 75.0 45.0
100 ºC 30.0 30.0 30.5 90.5 84.0 85.0 30.0 85.0 55.0 30.0 31.0 30.5 88.0 85.0 87.0 30.5 87.0 56.5
CLS 31.0 29.5 30.0 83.0 79.0 81.5 30.0 81.5 51.5
30.0 30.0 30.5 85.5 88.5 88. 5 30.0 88.5 58.5 30.0 30.5 30.5 86.5 86.0 86.0 30.5 86.0 55.5 Calculation:
Accelerated storage hardening = PH–Po
where
PH = median of plasticity measurement of test pellets number 2
33
BIOGRAPHY
The author Muhana Nurul Hidayah was born on 14thSeptember, 1990 in Banjarnegara as a first child to Mr. Auzar and Mrs. Rustini. In 2010 the author graduated from Bogor Chemical Analyst High School (SMAKBo) and was accepted in Bogor Agricultural University in the Department of Chemistry, Faculty of Mathematics and Natural Sciences. She was a laboratory assistant for Basic Chemistry Practicals in the First Common Year (TPB, 2012−2013), Organic Chemistry Practicals for D-3 IPB (2013−2014), and Organic Chemistry for Service Practicals (2013−2014).
The author received scholarship from Karya Salemba Empat-IPB (2012) and Academic Achievement Elevation (Peningkatan Prestasi Akademik) from IPB (2013−2014). She achieved 3rd Winner of MIPA Youth Scientist Challenge-Explo Science (MYSC) held by the Faculty of Mathematics and Natural Sciences, Bogor Agricultural University in 2013. She is one of members of PKM-P, funded by the Directorate General for Higher Education (Ditjen Dikti) on a paper entitled
“Biobutanol from Tofu Wastes: An Alternative Gasoline Additive as Indonesia
Biofuel” in 2013.