i
HEART RATE VARIABILITY ANALYSIS SYSTEM IN MOBILE PHONE
NIK MOHD AMIR BIN NIK YAHYA
This Report Is Submitted In Partial Fulfillment Of Requirements For The Bachelor Degree Of Electronic Engineering (Computer Engineering) with Honors
Fakulti Kejuruteraan Elektronik dan Kejuruteraan Komputer Universiti Teknikal Malaysia Melaka
ii
UNIVERSTI TEKNIKAL MALAYSIA MELAKA
FAKULTI KEJURUTERAAN ELEKTRONIK DAN KEJURUTERAAN KOMPUTER
BORANG PENGESAHAN STATUS LAPORAN
PROJEK SARJANA MUDA II
Tajuk Projek : ………
Sesi
Pengajian :
2 1 1 1 2
Saya ……….. (HURUF BESAR)
mengaku membenarkan Laporan Projek Sarjana Muda ini disimpan di Perpustakaan dengan syarat-syarat kegunaan seperti berikut:
1. Laporan adalah hakmilik Universiti Teknikal Malaysia Melaka.
2. Perpustakaan dibenarkan membuat salinan untuk tujuan pengajian sahaja.
3. Perpustakaan dibenarkan membuat salinan laporan ini sebagai bahan pertukaran antara institusi pengajian tinggi.
4. Sila tandakan ( √ ) :
SULIT*
*(Mengandungi maklumat yang berdarjah keselamatan atau kepentingan Malaysia seperti yang termaktub di dalam AKTA RAHSIA RASMI 1972)
TERHAD** **(Mengandungi maklumat terhad yang telah ditentukan oleh
organisasi/badan di mana penyelidikan dijalankan)
TIDAK TERHAD
Disahkan oleh:
__________________________ ___________________________________ (TANDATANGAN PENULIS) (COP DAN TANDATANGAN PENYELIA)
Tarikh: ……….. Tarikh: ………..
HEART RATE VARIABILITY ANALYSIS SYSTEM IN MOBILE PHONE
iii
“Saya akui laporan ini adalah hasil kerja saya sendiri kecuali ringkasan dan petikan yang tiap-tiap satunya telah saya jelaskan sumbernya.”
Tandatangan : ………
iv
“Saya akui bahawa saya telah membaca karya ini pada pandangan saya karya ini
adalah memadai dari skop dan kualiti untuk tujuan penganugerahan Ijazah Sarjana Muda Kejuruteraan Elektronik (Kejuruteraan Komputer) dengan Kepujian.”
Tandatangan : ………..………
v
For my beloved father, mother and families
Nik Yahya bin Raja Kadir Che Zainab binti Mat Ali
Nik Mohd Asyraf Nik Mohd Arif Nik Nurul Adila Nik Nurul Adlin Nik Mohd Azreen
vi
ACKNOWLEGEMENT
In the name of Allah, The Most Gracious and The Most Merciful. All the
praises and thanks are to Allah, the Lord of the ‘Alamin for the strengths and His
blessing in completing this thesis. This dissertation would not have been possible
without the guidance and the help of several individuals who in one way or another
contributed and extended their valuable assistance in the preparation and completion
of this study.
First of all, a greatest gratitude to Madam Lizawati binti Salahuddin, my
Project Supervisor whose sincerity and encouragement had helped me to survive
until the end of this project.
A special thanks to my colleagues from Bachelor of Electronic Engineering
(Computer Engineering) and staff in the Faculty of Electronic and Computer
Engineering, especially the Computer Electronics Departments for the consultations given either directly or indirectly.
Lastly, a special thanks to my father, mother and family members for the
continuous support in morals, financial and advices. I will never forget how they
have been my inspiration as I face all the obstacles on in the completion this research
vii
ABSTRACT
viii
ABSTRAK
ix
CONTENTS
CHAPTER TITLE PAGE
PROJECT TITLE i
DECLARATION ii
DEDICATION v
ACKNOWLEGEMENT vi
ACSTRACT vii
ABSTRAK viii
CONTENTS ix
LIST OF TABLES xii
LIST OF FIGURES xiii
LIST OF ABBREVIATIONS xiv
I INTRODUCTION 1
1.1 OVERVIEW 1
1.2 OBJECTIVES 2
1.3 PROBLEM STATEMENT 2
1.4 SCOPE OF PROJECT 3
1.5 METHODOLOGY 4
II LITERATURE REVIEW 5
2.1 HUMAN HEART 5
2.2 DIGITAL SIGNAL PROCESSING (DSP) 7
2.3 ELECTROCARDIGRAPH (ECG) 9
x
2.5 MOBILE OPERATING SYSTEM 22
2.6 APPLICATION FUNDAMENTALS 26
III METHODOLOGY 29
3.1 INTRODUCTION 29
3.2 WATERFALL MODEL 30
3.2.1 Requirements 30
3.2.2 Design 31
3.2.3 Implementations 31
3.2.4 Verification 31
3.2.5 Maintenance 32
3.3 DATA COLLECTION METHODS 32
3.4 SOFTWARE AND HARDWARE SPECIFICATION 33 3.5 GRAPHICAL USER INTERFACE (GUI) DESIGN 35
IV RESULT 36
4.1 OVERVIEW 36
4.2 RESULT AND ANALYSIS 36
4.2.1 Signal Processing Process 36 4.2.2 HRV Analysis System Flowchart 39
4.2.3 Main Menu Interface 41
4.2.4 HRV Analysis Module 42
4.2.5 Heartbeat History Module 45
4.2.6 About 46
4.2.7 Performance 47
4.2.8 Discussion 49
xi
5.1 CONCLUSION 50
5.2 RECOMMENDATION 50
5.2.1 Develop Sensor Device 51
5.2.2 Summarize result of HRV analysis 51 5.2.3 Develop HRV algorithm in other method 51 5.2.4 Integrate with communication system 52
xii
LIST OF TABLES
NO TITLE PAGE
2.1 HRV analysis methods 12
2.2 Summary on Time-domain method 14
2.3 Summary for Frequency-domain method 16
2.4 Example of mobile OS 23
3.1 Specification of AVD 34
3.2 Specification of Android device 34
xiii
LIST OF FIGURES
NO TITLE PAGE
2.1 Human heart anatomy 6
2.2 Block diagram of Digital Signal Processing 7
2.3 ECG device 9
2.4 ECG wave 10
2.5 RR interval 10
2.6 HRV features 13
2.7 Received ECG signal 18
2.8 Major components of Android OS 24
3.1 Waterfall Model 30
3.2 Eclipse software 33
3.3 Adobe Photoshop software 34
4.1 Processing steps of RR intervals detection algorithm 38
4.2 Flowchart of HRV Analysis System 40
4.3 Main menu 41
4.4 Bottom menu in the main page 42
4.5 HRV analysis 42
4.6 Browse ECG file 43
4.7 Upload message box 43
4.8 ECG graph 44
4.9 Analysis bottom menu 45
4.10 Heart Rate history 45
4.11 Bottom menu on Heart Rate history 46
4.12 Reset history 46
xiv
LIST OF ABBREVIATIONS
ADC - Analog to Digital Converter ADT - Android Development Tool AVD - Android Virtual Device BPM - Beat per minute
DAC - Digital to Analog Converter DSP - Digital Signal Processing ECG - Electrocardiograph EKG - Elektrokardiograf GUI - Graphical User Interface HDTV - High-Definition Television HF - High Frequency band HRV - Heart Rate Variability LF - Low Frequency band
NN50 - The Number of Interval Differences of Successive RR Intervals Greater Than 50ms
PNN50 - The Proportion Derived by Dividing NN50 by the Total Number of RR Intervals
PPG - Photoplethysmograph PSD - Power Spectra Density
RMSSD - The Root Mean Square of Standard Deviation RR Intervals RR - Beat to beat interval
SDANN - The Standard Deviation of the Average RR Interval SDNN - Standard Deviation of the RR Intervals
SMS - Short text system
xv
1
CHAPTER I
INTRODUCTION
Nowadays, there are many diseases attack human all around the worlds
including young man and old man. All of them have tendency to get disease. One
example of disease is heart attack, disease that involves human heart. Usually a tool
used to analyze or detect this disease in the early level of disease or on critical level
of disease. The tool is knows as Heart Rate Variability (HRV) analysis. Source of
HRV analysis comes from beat-to-beat variation of heart.
1.1 Overview
Heart Rate Variability (HRV) is a great tool in assessment of the autonomic
function. It is accurate, reliable, reproductive, yet simple to measure and to process.
HRV represents an instantaneous heart rate signal including the beat-to-beat
fluctuation in heart rate. Method used to detect beats include electrocardiograph,
blood pressure and the pulse wave signal derive from a photoplethysmograph (PPG).
The ECG is considered as the best way to measure beat-to-beat interval (RR data).
ECG is a transthoracic interpretation of the electrical activity of the heart over a
period of time, as detected by electrodes attached to the outer surface of the skin and
2
HRV analysis system in the mobile phone environment enables continuous
HRV monitoring at anytime and anywhere. With the increasing development of
mobile phone makes HRV analysis system are available to everyone with easy step
of installment and low cost. HRV analysis system important to any period of ages
since it is friendly user system. ECG data which is RR data will be used as the input.
The system analyses the RR data and generate HRV analysis. Using digital signal
processing with HRV analysis to process heart beat sound, the outcome can
determine human condition.
HRV analysis can be used to determine heart condition and for the expert, it
can be used to determine some kind of disease. HRV analysis system in the mobile
phone will help expertise and also other people to determine heart condition more
convenient compared to fixed HRV analysis system.
1.2 Objectives
The objectives of this project are:
1. To develop HRV analysis system using ECG data.
2. To provide a convenient HRV analysis using mobile environment.
3. To display heart beat condition base on HRV analysis.
1.3 Problem Statement
Nowadays there need many equipment to help human work become easier
and one of the way to save many human live. The equipment such as ECG can be
found in lab or hospital. Because of the increasing number of patient regarding to
heart diseases or heart problem, equipment to treat the disease becomes more
important. In many cases, equipment such as ECG cannot be supplied to clinic or
hospital in rural area because of high cost budget to buy it. It is a large equipment
and expensive too. Government need to spend a lot of money to supply the medical
3
Since not all medical centers are able to provide this facility for the public,
there should have other options for people to get and use this facility especially when
there is an emergency. In the case of emergency, public people needed the tool to
become portable and easy to bring everywhere. That mean the tool needs to be small
in size compared to the equipment at hospital. It is also needed to be low cost
equipment, yet the accuracy is same or better as equipment in the hospital.
Patients with chronic heart diseases have to frequent and continuous monitor
their heart condition. Monitoring heart condition using ECG at the hospital is not
convenient which limit their daily activities. As they are busy with work, they do not
need to go to hospital frequently instead just use mobile HRV analysis system. Using
this portable device, they can avoid long queue at hospital if their condition are
normal. Otherwise, they only need to go to see doctor when their condition is worse
or abnormal.
Most ECG available at the hospital is bulky and heavy. They are not designed to be easily carried to anywhere. They are suitable to monitor patients’ heart condition, which is located at one permanent location. On the other hand, a
mobile HRV analysis use not only for patients but also for healthy person. For
example, the sportsmen to monitor their heart condition during training, as it is
important for them to maintain a healthy body state can use it.
1.4 Scope of Project
Below are the scopes of the project:
1. The HRV analysis system developed on android platform.
2. The HRV analysis was analyze using ECG data sample only.
4
1.5 Methodology
This project begins with the research of the proposed title. The result of that
research is then discussed with the supervisor. Once the title of project was approved,
the background of study for this project was explored as stated in the literature
review.
Waterfall model used for the system development. In the requirements phase,
the description for the complete system must be developed. For the design phase, a
plan will be developed to create perfect system and in implementations phase, real
system will be developed and all part of the system will be linked into one perfect
system. After that, the verification phase - the system will be tested to determine the
performance and to find bugs. Lastly in the maintenance phase, the modification will
5
CHAPTER II
LITERATURE REVIEW
This chapter contains the literature review on theoretical concepts applied in
this project. It contains the information gathering of the project in order to complete
the whole project.
2.1 Human Heart
The heart is a muscular organ responsible for pumping blood through the
blood vessels by repeated, rhythmic contractions, or a similar structure in the
annelids, mollusks, and arthropods [l]. The term cardiac (as in cardiology) means
"related to the heart" and comes from the Greek, kardia, for "heart." The heart is
composed of cardiac muscle, an involuntary muscle tissue which is found only with
in this organ [2]. Human heart consists of four chambers. The chambers are atria,
which is the two upper chamber and ventricles which two lower chambers. In the
heart itself, there are valves located between the atria and ventricles and also there
are have major arteries from the heart. A wall of muscle called the septum separates
the left and right atria and the left and right ventricles. Figure 2.1 below shows the
6
Figure 2.1: Human Heart Anatomy [3]
The average human heart beating at 72 beat per minute (BPM) will beat more
than 3.5 billion times by the end of a long life. The heart weighs between 7 and 15
ounces (200 to 425 grams) and is a little larger than the size of our fist [4]. Each day,
the average heart beats 100,000 times, pumping about 2,000 gallons (7,571 liters) of
blood. Human's heart location is between the lungs (in the middle of the chest),
behind and slightly to the left of the breastbone (sternum). Pericardium, a double
layered membrane surrounds the heart like a sack. The pericardium outer layer
surrounds the roots of the heart's major blood vessels and it is attached by ligaments
to the spinal column, diaphragm, and other parts of our body. The inner layer of the
pericardium is attached to the heart muscle. A coating of fluid separates the two
layers of membrane, letting the heart move as it beats, yet still be attached to the
body [4]. There are four types of valves in human's heart, regulating blood flow
through the heart. The first valve is the tricuspid valve, which regulates blood flow
between the right atrium and right ventricle. Secondly, the pulmonary valve controls
blood flow from the right ventricle into the pulmonary arteries, which carry blood to
the lungs to pick up oxygen. The mitral valve lets oxygen-rich blood from the lungs
pass from the left atrium into the left ventricle. Lastly, the aortic valve opens the way
for oxygen-rich blood to pass from the left ventricle into the aorta, the body's largest
7
classified into two types - the atrioventricular (mitral and tricuspid) and the semi
lunar (aortic and pulmonic) valves.
2.2 Digital Signal Processing (DSP)
Traditional signal processing was achieved by using analog components such
as resistors, capacitor and inductors. However, the inherent tolerance associated with
these components, temperature and voltage changes, and mechanical vibrations, can
dramatically affect the effectiveness of analogue circuitry. The revolution is coming
with something new technology. The digital signal processing is inherently stable,
reliable and repeatable. Processing of signal can be done either in analog or digital
[image:22.595.116.541.359.502.2]domain.
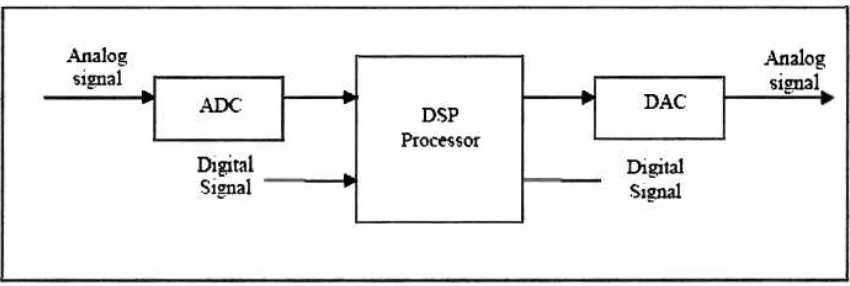
Figure 2.2: Block diagram of Digital Signal Processing
Generally, speech generate analog signal in response to various physical
phenomena that occur in an analog manner. Processing of signal can be done either
in analog or digital domain. To do the processing of an analog signal in digital
domain, it is required that a digital signal is discrete in both time and amplitude. The
digitization process is achieved via an analog to digital (ADC) converter. DSP
systems use a DSP processor or other digital hardware and a digital-to-analog (DAC)
converter to replace analog devices such as amplifiers, modulators and filters. The
8
A DSP processor performs digital operations based on a specific signal
processing algorithm implemented in software to process the digital signals. The
output digital signal may be converted back to analog form using the DAC. There are
many reasons why one would want to process an analog signal in a digital fashion by
converting it into a digital signal. The main reason is that digital processing allows
programmability. Another reasons is that digital circuit provide a more stable and
tolerant output than analog circuit. The DSP processor processes the digital-input
signals, and the output digital signals can be transmitted to or processed by other
digital systems without using converters. Programmable DSP processors are
especially suitable for designs that require multiple modes of operation and future
upgradeability.
The processing of a digital signal can be implemented on various platforms
such as DSP processor, a customized very large scale integrated (VLSI) circuit or a
general purpose microprocessor .Some of the difference between DSP and a single
function VLSI implementation are as follows; I) there is a fair amount of application
flexibility associated with DSP implementation, since the same DSP hardware can be
utilized for different applications. In other words, DSP processors are programmable.
This is not the case for hardwired digital circuit. II) DSP processors are cost effective
because they are mass produced and can be used for many applications. A
customized VLSI chip normally gets built for a single application and a specific
customer. III) In many situations, new features constitute a software upgrade on a
DSP processor not require new hardware. In addition, bug fixes are generally easier
to make. IV) Often very high sampling rates can be achieved by a customized chip,
where as there are sampling rate limitations associated with DSP chips due their
peripheral constraints and architecture design.
Digital signal processors are used for a wide range of applications, from
communications and controls to speech and image processing. The general-purpose
digital signal processor is dominated by applications in communications (cellular).
Applications embedded digital signal processors are dominated by consumer
products. They are found in cellular phones, faxmodems, disk drives, radio, printers,
hearing aids, MP3 players, high-definition television (HDTV), digital cameras, and
9
consumer applications, since they have become very cost-effective. They can handle
different tasks, since they can be reprogrammed readily for a different application.
DSP techniques have been successful because of the development of low-cost
software and hardware support. As a result, digital processing, and hence digital
signal processor, is expected to play a major role in the next generation of
telecommunication infrastructure including 3G (third generation) wireless, cable
modems, and telephones lines (digital subscriber line -DSL modem).
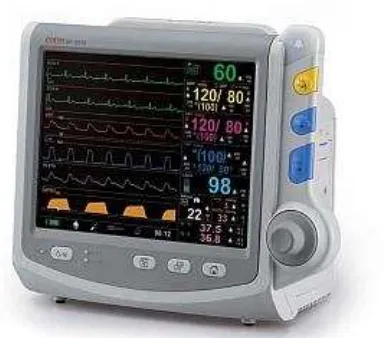
[image:24.595.238.430.302.471.2]2.3 Electrocardiogram (ECG)
Figure 2.3: ECG device
Heart rate fluctuations can be measured from the electrocardiogram (ECG), a
graphical recording of the electrical potentials that is generated by cardiac muscle
cells (Figure 2.3). Generally, this signal is recorded by the certain number of
electrodes attached to human body [3]. The heart’s internal control mechanism
consists of specialized fibres including the sinoatrial (S-A) node (located on the rear
wall of the right atrium), the atrioventricular (A-V) node, the A-V bundle, and the
left and right bundles of conducting fibers (Purkinje) [5]. The S-A node cells create
the electricity that makes the heartbeat. In a typical record, three clearly recognizable
![Figure 2.1: Human Heart Anatomy [3]](https://thumb-ap.123doks.com/thumbv2/123dok/568820.67272/21.595.161.475.86.284/figure-human-heart-anatomy.webp)