DOI: 10.12928/TELKOMNIKA.v14i2A.4330 335
Impact of Estimated Effect of Driver on Lattice Model
Optimized State of Cooperated Drive under Traffic Flow
Li Xingliang*1, Yannick Meiller2 1
Nanjing forest police college, Nanjing, china
2 Chevron Energy Technology Company, Paris, France
*Corresponding author, e-mail: [email protected]
Abstract
This paper puts forward vehicle-mounted drunk drive-forbidding intelligent management system based on GPS/GSM. Based on traditional vehicle-mounted expiration-type anti-drunk driving ignition blocking device, new-type active and secure products in automotive electronic field are designed. Based on electronic nose theory, home-made alcohol detection module calculates and disposes detection signal of several ethanol sensors through fusion algorithm of neural network. After that, it works out alcohol concentration by quantification and enhances detection precision of alcohol. System adopts minitype aspirator pump to quickly guide expiration to alcohol detection module, avoiding blowpipe and improving speed ability and convenience of detection. Application of GPS/GSM technology realizes the transmission of vehicle locating information, car owner’ information and drunk driving information. Through base station of traffic police, received information can be real-time displayed and stored in database, which realizes intelligent management.
Keywords: Traffic flow; Drunk driving; Lattice model; Estimated effect; Numerical simulation; GSM/GPS
Copyright © 2016 Universitas Ahmad Dahlan. All rights reserved.
1. Introduction
and put forward many kinds of expanded traffic flow lattice model [3-9], of which, Ge Hongxia etc. has detected front multi lattice information and put forward cooperated drive lattice model with the help of intelligent transportation system. Result shows that front three lattice points information has great impact on traffic flow and it is optimized state of cooperated drive lattice model. But this model failed to consider impact of estimated effect on traffic flow. In practical traffic, driver often performs estimation to front traffic condition, so driver can carry out acceleration or deceleration ahead of time, thus avoiding appearance of road accident due to traffic emergency circumstances. A few researches have verified that estimated effect has assignable impact on traffic flow. But research of impact of estimated effect on optimized state of cooperated drive lattice model is lacked. Therefore, based on cooperated drive lattice model, this paper considers estimated effect of driver to front traffic flow, putting forward expanded cooperated drive lattice model, and discussing impact of estimated effect of driver on optimized state of cooperated drive lattice model through theoretical analysis and numerical simulation [10-11].
2. Model
In 1998, Nagatani [1, 2], by reference to theory of car following model, was the first to put forward following lattice model:
(1)
(2)
Where, and respectively represent mean density and sensitivity coefficient, and represents average space headway. Equation (1) represents conservation equation of vehicle within section. Equation (2) represents adjusting speed of density in front of driver. Then, based on equation (2), Ge Hongxia etc. [4] has considered impact of front multi lattice information on traffic flow and put forward following cooperated drive lattice model:
(3)
Theoretical analysis and numerical simulation show that considering front three lattices information is optimized state of cooperated drive lattice model, i.e. front three lattices can keep traffic steady. In practical traffic, if driver estimates that front lattice point flow is larger than present lattice point flow, driver often chooses to accelerate, vice versa. Therefore, based on cooperated drive lattice model, considering estimated effect of driver to traffic flow, this paper puts forward expanded cooperated drive lattice model:
(4)
Where, is reaction coefficient. is local density at . is local flow. Gradient term is estimated reaction term of driver to front flow variation.
is estimated reaction coefficient. is optimization speed function and form of document [4] is adopted.
(5)
Where:
, (6)
0 ) ( 0
t x v
v a x V a v
t
0 ( ( ))
0
a
0
/ 1
) ( x
v a n x x
V a v
t
0 ( ( ),, ( ))
x x Q a
v a n x x
V a v
t
)) ( (
)) ( , ), ( ( 0
(xm) xm Q((x)) x
)) ( ( xQ x
V()
)) ( ( )) ( , ), 2 ( ), ( (
1
x x x m V p x l
V
m
l
l
m
l l
p
1 1
1 1
1
l l
p p p
l p
m l for
m l for
So formula (4) is transformed into:
(7)
Perform nondimensionalization ( ) to space in formula (1) and (7), we can gain following discrete version:
(8)
(9)
Where: ߩ and ݒ respectively represent density and car speed at lattice point ݆. represents flow at lattice point . represents delayed time when car follows. When , then we can gain cooperated drive lattice model put forward by Ge Hongxia. Optimization speed adopts following forms [4]:
(10)
Where: and respectively represent safe distance and maximum speed. By eliminating speed in model (8) and (9), we can gain following evolution equation of density:
(11)
3. Results and Analysis 3.1. Stability Analysis
Assumed that original even-distributed traffic flow density is , optimization speed is . Assumed that lattice point at j deviates microvariations of steady-state solution, i.e. , taking it into formula (11), we can gain following equation:
(12)
Where: . Assumed that microvariations is unfolded to
form of fourier series, we can gain equation about z:
(13)
Unfold parameter z into and take it into formula (11), we can respectively gain 1-pass and 2-pass terms of :
When , original even stationary state traffic flow will become unstable, and when , original stable traffic flow will remain the same. So, we can gain following critical stable conditions:
(16)
So, we can gain following unstable conditions:
(17)
When =0, it degrades into unstable condition [4]of cooperated drive lattice model. Through comparison, we find that extended model further stabilizes traffic flow in
region. This declares that estimated effect has further stabilizing
impact on traffic flow, and it shows improvement of model has great significance.
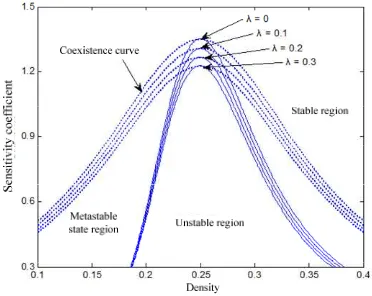
Figure 1 is relational graph between density and sensitivity coefficient ( ; a). Where , , , choose optimized state of cooperated drive lattice model . Full line represents critical stable curve, while imaginary line represents coexistence curve (see following nonlinear analysis). Critical stable curve peak represents critical point ( ). Therefore phase space is divided to three different regions: stable region, metastable state region and unstable region. When =0, we gain critical stable curve and coexistence curve which are consistent with cooperated drive lattice model. Literature [4] points out that when we choose front lattice point (optimized state), stable curve and coexistence curve of cooperated drive lattice model almost coincides with each other. From Figure 1, we know that after estimated effect is considered, stable region enlarges obviously. With increasing of estimated reaction coefficient
, stable curve and coexistence curve continue lowering, unstable region and metastable state region gradually diminish, and stable region enlarge further. Estimated effect term further strengthens stability of traffic flow, which describes the significance and necessity of considering estimated effect.
Figure 1. Phase diagram of density and sensitiveness under different estimated effect 0
2
z
0 2
z
) ( 2
2 ) 1 2 (
0 2 0 1
0
V l p
m
l l
) ( 2
2 ) 1 2 (
0 2 0 1
0
V l p
m
l l
) ( 2
2 ) 1 2 (
) ( 2
) 1 2 (
0 2 0 1
0
0 2 0 1
V
l p
V l p
m
l l m
l l
5
p hc4 vmax2 m3
c c,a
3
3.2. Nonlinear Analysis
Considering nearby slowly varying behavior of critical point ( ), slow variable X, T is defined as follow:
(18)
(19)
In which, b is denoted as parameter, is nearby small parameter of critical point. Put the formula (18) and (19) into formula and expand it to magnitude, it can be defined as:
(20)
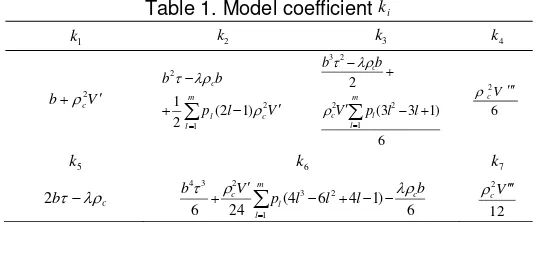
In which, , . Coefficient ( ) is shown in
Tab. 1. In the near of critical point ( ), assumed that and , the reduced equation can be obtained as below:
(21)
Coefficient ( ) is shown in Tab. 2. According to the method of document, the propagation velocity of kink--anti-kink density wave of traffic jam can be obtained as below:
(22)
Therefore, solution of kink--anti-kink density wave can be obtained as below:
(23)
Whereupon, the kink--anti-kink density wave-amplitude can be obtained as below;
(24)
Kink--anti-kink density wave solution expresses the coexistence phase. Hereby, the coexistence curve can be drawn in phase diagram ( ): corresponding coexistence phase of free flow of low traffic density can be drawn through , and the corresponding coexistence line of jam phase of high density can be drawn through (As shown in imaginary line in Figure 1)
Table 1. Model coefficient
Table 2. Model coefficient
3.3. Numerical Simulation
Periodic boundary condition is adopted for the numerical simulation; assumed that the initial condition is shown as below:
(25)
In which, small signal stability , other parameters are selected as below:
, , , , . As well, optimized lattice model state of
cooperated drive is selected and .
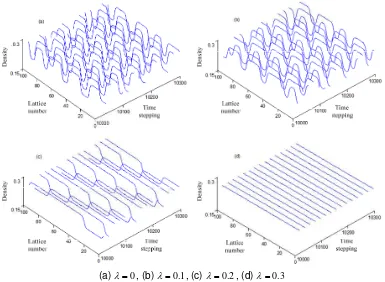
(a) , (b) , (c) , (d)
Figure 2. Temporal and spatial evolution diagram of density
Figure 2 is the simulation image of temporal and spatial evolution when after the time steeping is . Figure 2(a)-(c) respectively corresponds to the different estimated effect coefficient and . In Figure 2 (a)-(c), parameter , the obtained result is the same as the lattice model of cooperated drive; although considering three lattice point information, the steady state traffic flow under the small signal stability will lost stability. From Figure 2 (a)-(c), we can know that, because of sensitivity coefficient , it meets the condition of instability formula (17), stop-and-go phenomenon occurs in original stable traffic flow with the form of kink and anti-kink density wave. However, from the Figure 2 (d), we can know that, when , stability condition can be met and the stable traffic flow under small signal stability can be maintained.
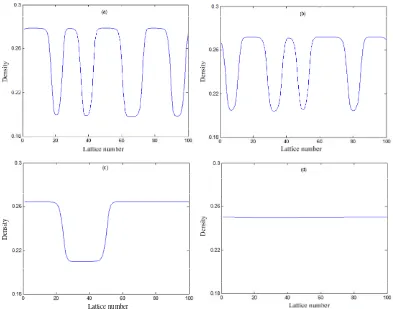
Figure 3 is the simulation diagram that corresponds to the traffic flow density distribution situation when time stepping. From Figure 3, we can know that with the increasing of the estimated effect coefficient , the wave-amplitude of density decreases gradually under the same sensitivity coefficient condition. The decreasing of wave-amplitude of density may restrain traffic flow jam. From the Figure 3 (d), we can know that, when , wave-amplitude of density will decrease rapidly, the traffic flow will return back to uniform stable traffic flow before disturbance. According to above numerical simulation and theoretical analysis, that the estimated effect can further increase the stability of traffic flow, which is verified under the lattice model optimized state of drive.
Density
Lattice number
Figure 3. Density distribution diagram respectively corresponds to figure 2 when t=10300
4. Conclusions
Because of low sensitivity of traditional drunk driving inspection system, the diffusivity of ehtyl alcohol signal interference cannot be identified; in order to accurately identify alcohol concentration of driver and entourage, this paper proposes a embedded drunk driving intelligent
10000
t
2 . 0 , 1 . 0 , 0
0.3 0
89 . 1
a
3 . 0
10300
t
3 . 0
identification system based on Internet. This system takes ATmega16 singlechip as the core and collects alcohol concentration signal through MQ-3 ethanol sensor, then makes cluster analysis by using the improved fuzzy C- means clustering algorithm to identify the alcohol concentration of driver and entourage with the using of internet of tings technology. If the alcohol of the driver exceeds the standard, audible and visual alarm will be given out by the system and the car is prohibited to start up, and the drunk driving car information will be sent to the family and monitoring center with GPRS. The experiment results show that this system has high inspection sensitivity and accuracy, which can achieve the goal for effectively avoiding the driving when being intoxicated and has great practical value for preventing driving when being intoxicated.
References
[1] Dadkhah M, Obeidat MM, Jaz, MD, Sutikno T, Riyadi, MA. How can we identify hijacked journals?
Bulletin of Electrical Engineering and Informatics. 2015; 4(2): 83-87.
[2] Yang J, He S, Lin Y. Multimedia cloud transmission and storage system based on internet of things.
Multimedia Tools and Applications. 2015: 1-16.
[3] Lv Z, Yin T, Han Y. WebVR-web virtual reality engine based on P2P network. Journal of Networks.
2011; 6(7): 990-998.
[4] Yang J, He S, Lin Y. Multimedia cloud transmission and storage system based on internet of things.
Multimedia Tools and Applications. 2015: 1-16.
[5] Guo C, Liu X, Jin M. The research on optimization of auto supply chain network robust model under
macroeconomic fluctuations. Chaos, Solitons & Fractals. 2016; 89: 105-114.
[6] Yang J, Chen B, Zhou J. A Low-Power and Portable Biomedical Device for Respiratory Monitoring
with a Stable Power Source. Sensors. 2015; 15(8): 19618-19632.
[7] Guanqun Bao, Liang Mi, Yishuang Geng, Kaveh Pahlavan. A computer vision based speed
estimation technique for localiz ing the wireless capsule endoscope inside small intestine. 36th Annual International Conference of the IEEE Engineering in Medicine and Biology Society (EMBC). 2014: 123.
[8] Hui Z. The Design of Electronic Toll Collection System Based on Radio-Frequency Identification.
Bulletin of Electrical Engineering and Informatics. 2013; 2(4): 286-292.
[9] Dadkhah M, Sutikno T. Phishing or hijacking? Forgers hijacked DU journal by copying content of
another authenticate journal. Indonesian Journal of Electrical Engineering and Informatics (IJEEI).
2015; 3(3): 119-120.
[10] T Sutikno, AZ Jidin, A Jidin, NRN Idris. Simplified VHDL coding of modified non-restoring square root
calculator. International Journal of Reconfigurable and Embedded Systems. 2012; 1(1): 37-42.
[11] Jiang D, Ying X, Han Y. Collaborative multi-hop routing in cognitive wireless networks. Wireless