ISSN: 1693-6930
accredited by DGHE (DIKTI), Decree No: 51/Dikti/Kep/2010 725
Measurement and Simulation Techniques for
Piezoresistive Microcantilever Biosensor Applications
Aan Febriansyah1, Ratno Nuryadi2, Djoko Hartanto3
1
Electrical Engineering, State Manufacturing Polytechnic of Bangka Belitung
Jl. Timah Raya Airkantung Sungailiat-Bangka Belitung, Indonesia, Phone/Fax:+62 71793586/93585
2
Center for Material Technology, Agency for the Assessment and Application of Technology (BPPT) Jl. MH. Thamrin No. 8 Jakarta, Indonesia, Phone/Fax: +62 213169893/3169873
3
Department of Electronics Engineering, Faculty of Engineering – Indonesia University Kampus UI Depok-Jawa Barat, Indonesia, Phone/Fax: +62 217270078/7270077 e-mail: [email protected], [email protected], [email protected]
Abstrak
Aplikasi mikrokantilever sebagai biosensor mulai banyak digunakan dalam dunia kesehatan, biologi, kimia dan lingkungan. Riset ini akan membahas perancangan teknik pengukuran dan simulasi aplikasi piezoresistive mikrokantilever sebagai biosensor, meliputi pembuatan rangkaian Wheatstone bridge sebagai detektor obyek, simulasi perubahan frekuensi resonansi berbasis Persamaan Euler-Bernoulli Beam sebagai deteksi keberadaan obyek, dan simulasi gerak mikrokantilever dengan menggunakan program software COMSOL Multiphysics 3.5. Tipe piezoresistive mikrokantilever yang digunakan adalah produk Seiko Instrument Technology (Jepang) dengan panjang 110 µm, lebar 50 µm, dan tebal 1 µm. Massa dari mikrokantilever 12.815 ng. Contoh obyek yang dideteksi adalah bakteri EColi, dimana massa untuk satu bakteri diasumsikan 0,3 pg. Hasil simulasi pada saat pendeteksian terjadi, untuk satu massa obyek bakteri akan menyebabkan nilai defleksi sebesar 0,03053 nm dan nilai frekuensi resonansi sebesar 118,90 kHz. Sedangkan untuk empat obyek bakteri akan menyebabkan nilai defleksi sebesar 0,03054 nm dan nilai frekuensi resonansi sebesar 118,68 kHz. Dari data tersebut terlihat bahwa bertambahnya massa bakteri akan menyebabkan naiknya nilai defleksi dan turunnya nilai frekuensi resonansi.
Kata kunci: biosensor, COMSOL, defleksi, frekuensiresonansi, mikrokantilever
Abstract
Applications of microcantileversas biosensors have been explored by many researchers for the applications in medicine, biological, chemistry, and environmental monitoring. This research discusses a design of measurement method and simuations forpiezoresistivemicrocantileveras a biosensor, which consist of designing Wheatstone bridge circuit as object detector, simulation of resonance frequency shift based on Euler Bernoulli Beam equation, and microcantilever vibration simulation using COMSOL Multiphysics 3.5. The piezoresistivemicrocantilever used here is Seiko Instrument Technology (Japan) product with length of 110 µm, width of 50 µm, and thickness of 1 µm. Microcantilever mass is 12.815 ng, including the mass receptor. The sample object in this research is bacteria EColi. One bacteria mass is assumed to 0.3 pg. Simulation results show that the mass of one bacterium will cause the deflection of 0.03053 nm and resonance frequency value of 118.90 kHz. Moreover, four bacterium will cause the deflection of 0.03054 nm and resonance frequency value of 118.68 kHz. These data indicate that the increasing of the bacteria mass increases the deflection value and reduces the value of resonance frequency.
Keywords: biosensor, COMSOL, deflection, microcantilever, resonance frequency
1. Introduction
quartz crystal oscillator method has a low sensitivity of about 30 pg/Hz, and third, the Surface Plasmon Resonance method is complex and expensive
Micro-machined cantilever is a good candidate for sensor.This was first used as force probes in Atomic Force Microscopy (AFM). The extreme sensitivity to several environmental factors, such as noise, temperature, humidity and pressure was immediately evident. In 1994, research teams in Oak Ridge National Laboratory and IBM have converted the mechanism causing interference into a platform for a novel family of biosensors [1]. Some of characteristics of microcantilever are as follows:
a) small size (in range micrometer)
b) high sensitivity (scale in attogram, 10-18 gram) c) low cost relatively
d) low power consumption
e) detectable of various object in one platform f) simple fabrication
g) integrated in microarray form.
The microcantilever based sensors areapplicable for various fields in medicine and biology field and in chemistry & environmental monitoring [2], such as detection of DNA and protein, detection of myoglobin, detection of temperature and heat changes, detection of Escherichia Coli bacteria, detection of humidity, etc.This paper discusses a design of measurement technique and simuations for piezoresistive-typedmicrocantilever as a biosensor, including the design of Wheatstone bridge circuit as object detector, simulation of resonance frequency shift based on Euler-Bernoulli Beam equation, and microcantilever vibration simulation using COMSOL.
2. Research Method
In this research, the measurement techniques and simulations of microcantilever-based biosensor are discussed, especially the changes in deflection (∆δ) and the change in resonance frequency (∆f) ofmicrocantileverdue to the changes of object mass (∆m) absorbed on the microcantileversurface. The measurement techniqueswere designed using a Wheatstone bridge circuit and operational amplifier of INA 128. The microcantilever used here is piezoresistivetype made by Seiko Instrument Technology (Japan). Microcantilever surface will be coated by a material receptor that serves as a catcher and selector that only react with the selected object. The microcantilever size is 110 µm in length, 50 µm in width, and 1 µm in thickness. Microcantilever mass is 12.815 ng, including the mass receptor.The object used here is Escherichia Coli bacteria, which has the mass of0.3 pg. Simulation of the resonance frequency is performed based on Euler-Bernoulli Beam Equation, and the microcantilever motion simulation is done by using COMSOL Multiphysics 3.5.
2.1. Microcantilever Structure
Figure 1 describes a simple structure of the microcantilever before and after deflection. In order to use the micro cantilever as a biosensor, it must be placed bio-receptor as functionalization layer on the surface of microcantilever and placing the electronics devices to detect the deflection of the microcantilever. Figure 2 shows a biosensor microcantilever (before (a) and after (b) deflections), where functionalization layer is coated on the microcantilever surface.
In case of the bacteria object detection, the microcantilever needs to be coated by antibody layer on its surface which only can react with bacteria. The mass detected here is the reaction result between both antibody and bacteria mass which is represented by BSA (Bovine Serum Albumin). BSA and the antibody wereimmobilized on the microcantilever surface using physicaladsorption as follows. First, the microcantilevers were cleaned using piranha solution (H2O2:H2SO4=1:1) and then immersed in ethanolbefore critical point dried (CPD). Second, the
(a) Before deflection (b) Deflection condition
Figure 1. Structure of Microcantilever
(a) Before deflection (b) Deflection condition
Figure 2. Biosensor microcantilever system
2.2. Microcantilever Deflection
Modes
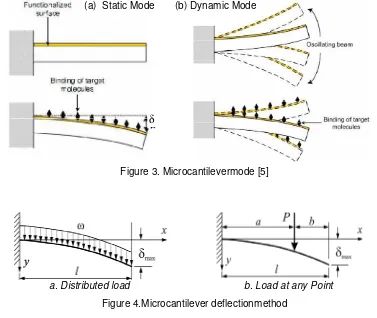
Microcantileverbiosensors can operate in two modes (see Figure3), i.e., static and dynamic modes. In the static mode, themicrocantileverbiosensor operates based on the difference ofsurface stress generated between the top and bottom surfacesduring binding or adsorption of target molecules on afunctionalized surface. The change of surface stress causes the cantilever to bend. This bending is known as deflection (δ).
On the other hand, in the dynamic mode, the microcantilever is oscillated at a certain frequency andthe change in oscillationfrequency due to mass change (∆m) loading is measured on its surface. Deflection values can be calculated using the two methods, i.e., distributed load and pointed loadas shown in Figure 4.
Figure 3. Microcantilevermode [5]
a. Distributed load b. Load at any Point
Figure 4.Microcantilever deflectionmethod F
δ
F
The calculation of deflection values in static mode for uniformly distributed load method usesequation (1), while the calculation of deflection values for pointed load method usesequation (2) [6]:
ߜ
=
ఠర
଼ாூ (1)
ߜ
=
మ
ாூ
ሺ
3
݈
−
ܽሻ
,
(2)where E isYoung’s Modulus of material, P is the force in microcantilever beam, l is length of microcantilever, a is the object distancefromfixed end,and I is InertiaMoment ofmicrocantilever, which is calculated by the equation(3) [7].
ܫ
=
௪௧య
ଵଶ
,
(3)wherewandtarewidth and thickness of microcantilever, respectively. To determine the amount of deflection in the dynamic mode, we use the Euler-Bernoulli Beam Equationwith uniformly distributed load method [7] as follows,
ܧܫ
డర ఋ డ௫ర+
ߩܣ
డమ ఋ
డ௧మ
=
ܲ
(
ݔ
,
ݐ
)
,
(4)wheren ρ is the density of material, and A is cross section area (=࢝∗࢚). To change the partial differential equations into differential equations on the value of x only, we assume a harmonic input force applied to the system with the radial frequency (߱), and thenܲ(ݔ,ݐ) =
ܲ݁ఠ௧
andߜ(ݔ,ݐ) =ߜ݁ఠ௧
. Equation (4) can be then simplified by replacing the factor݁ఠ௧
, becomes [8]:
ܧܫ
(1 +
݅ߛ
)
డర ఋ
డ௫ర
+
ߩܣߜ
߱
ଶ
=
ܲ
,
(5)whereሺ+ࢽሻis a constant value of structural damping factor at the time of the vibrations and strains that occur in the microcantilever.
The value of resonance frequency is influenced by the mass and strain value factor (spring constant) of microcantilever [9].
݂
=
ଵ ଶగට
ெା (6)
݇
=
ଷாூయ
=
ଷா௪௧యଵଶయ
=
ா௪௧యସయ (7)
where M is object mass on microcantilever surface and m is effective mass of microcantilever (݉=ߩܣ݈=ߩݓݐ݈) [10]. By adding the mass, the resonance frequency changes (∆f) will reduce the value of the frequency and then mass change (∆m) can be determined. The resonance frequency change can be seen in the following equation [11].
߂݂
=
݂ ቆට
∆ଵ ାଵ− 1
ቇ
(8)3. Results and Discussions
3.1. Measurement Results of ∆V and ∆R
obtained in this experiment, we can calculate the resistance value changes and voltage changes.
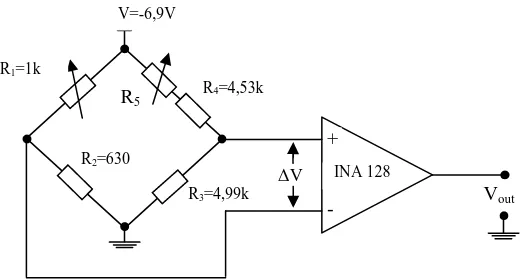
Figure 5. Wheatstone bridge circuit and operating amplifier INA128
R1 and R2 components are piezoresistors within the piezo resistive microcantilever.
Components R3, R4 and R5 arean external resistors. The amplifier INA128 is used to enhance
the value of ∆V. In the experimental procedure, value R1 is set close to the value R = 630 Ω and
Vout is set to zero. Once the value of Vout = 0 is obtained, then the value of Vout is measured for
all values of R1 as shown in Table 1. The measurementof ∆V values for all values of R1 in Table
1 are shown in Figure 6.
Table 1.Experimental result of
∆V measurement R1
(Ω) Vout
(Volt)
∆V
(Volt) ∆R (Ω)
∆R+R (Ω) 1 14.26 3.43 -626.35 3.65 183 13.88 3.06 -558.78 71.22 275 9.45 1.82 -332.35 297.65 480 6.02 1.16 -211.83 418.17 615 2.50 0.48 -87.65 542.35 685 0.00 0.16 -29.22 600.78 714 -1.04 -0.15 27.39 657.39 777 -2.42 -0.46 84.00 714.00 905 -3.61 -0.69 126.00 756.00 959 -4.11 -0.79 144.26 774.26
Figure 6. Graphs of experimental Resultsof ∆V and ∆R+R as function of R1
For comparison, we performed the calculation of ∆V and ∆R using equation (9) and equation (10) [12].
∆
ܸ
=
ୖభୖయିୖమୖ౮ሺୖయାୖ౮ሻሺୖభାୖమሻ
E
(9)∆V =
∆ୖଶୖ
ܧ
(10)3.43 3.06 1.82 1.16 0.48 0.16 -0.15 -0.46 -0.69-0.79 3.65 71.22 297.65 418.17 542.35 600.78 657.39 714.00 756.00 774.26 0 100 200 300 400 500 600 700 800 900 -1.50 -1.00 -0.50 0.00 0.50 1.00 1.50 2.00 2.50 3.00 3.50 4.00
0 200 400 600 800 1000 1200
ΔR + R ( Ω ) ΔV ( V o lt ) R1 (Ω)
ΔV (Volt) ΔR+R (Ω) INA 128
+
- ∆V R3=4,99k
R2=630
R1=1k
R5
R4=4,53k
V=-6,9V
The calculation results are shown in Table 2. The graphs of ∆V and ∆R+R as function of R1 from Table 2 can be shown in Figure 7.
Table 2. Calculation Results of ∆V and
∆R+R R1 (Ω) Vout (Volt) ∆V
(Volt) ∆R (Ω)
∆R+R (Ω)
1 24.289 3.520 -642.798 -12.798 183 13.647 1.978 -361.178 268.822 275 9.897 1.434 -261.922 368.078 480 3.776 0.547 -99.930 530.070 615 0.846 0.123 -22.385 607.615 685 -0.437 -0.063 11.555 641.555 714 -0.929 -0.135 24.580 654.580 777 -1.928 -0.279 51.026 681.026 905 -3.706 -0.537 98.072 728.072 959 -4.370 -0.633 115.646 745.646
Figure 7. Calculation resultsof ∆V and ∆R+R as function of R1
3.2. Simulation Results of The Dynamic Mode
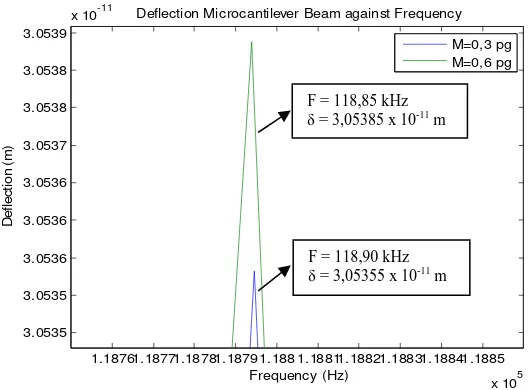
In this simulation, mass of bacteria as object is assumed to be 0.3 pg. We use Euler-Bernoulli Beam equation approach to simulate the deflection and resonance frequency. The simulation is done using Matlab software and the result is shown in Figure 8.
Figure 8. Deflection and amplitude changes for bacteria masses of 0.3 pg and 0.6 pg
To see the deflection shift (∆δ) and the change of resonance frequency (∆f), we will simulate two bacteria masses, i.e., 0.3 pg and 0.6 pg. Figure 8 shows that the changes of objectmass (∆m) causes the changes of frequency (X axis) and the changes of deflection value (Y axis). 3.52 1.98 1.43 0.55 0.12 -0.06 -0.13 -0.28 -0.54 -0.63 -12.798 268.822 368.078 530.070 607.615641.555 654.580 681.026728.072 745.646 -100 0 100 200 300 400 500 600 700 800 -1 -0.5 0 0.5 1 1.5 2 2.5 3 3.5 4
0 200 400 600 800 1000 1200
Δ R +R ( Ω ) ΔV ( V o lt ) R1 (Ω)
ΔV (Volt) R1 (Ω)
1.18761.18771.18781.18791.188 1.18811.18821.18831.18841.1885 x 105 3.0535 3.0535 3.0536 3.0536 3.0536 3.0537 3.0538 3.0538 3.0539
x 10-11 Deflection Microcantilever Beam against Frequency
Frequency (Hz) D e fl e ct io n ( m ) M=0,3 pg M=0,6 pg
F = 118,90 kHz δ = 3,05355 x 10⁻¹¹ m
For bacteria mass is 3 pg, the resonance frequency value (f) is 118.90 kHz and the deflection value (δ) is 30.536 pm. On the other hand, for bacteria mass of 6 pg, the resonance frequency value (f) is 118.85 kHz and the deflection value (δ) is 30.539 pm. It shows that the change of the bacterial mass from 3 pg to 6 pg results in a decrease in the resonance frequency value of 0.05 kHz and an increase in the deflection value of 0.003 pm.
3.3. Simulation of Microcantilever Motion
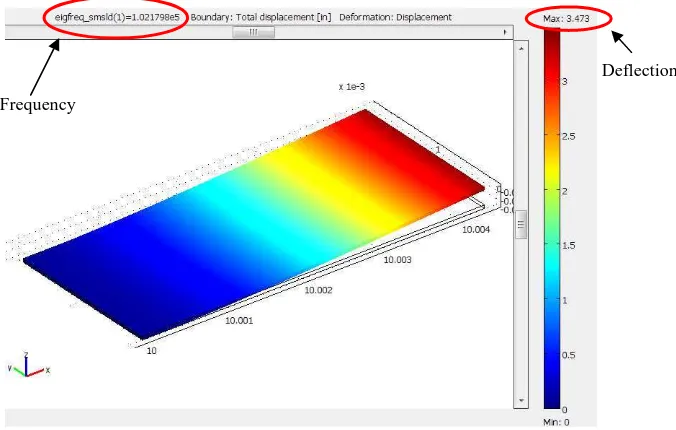
It is well known that the deflection of microcantilever is influenced by several factors related to physical geometries such as length, width and thickness. Therefore, in order to see the difference in the deflection value, the simulation is done by using COMSOL Multiphysics 3.5 software [14-17]. Here, the dimensions of the microcantilever are the length of 110 µm, a width of 50 µm and a thick of1 µm. The results of this simulation can be seen in Figure 9.The values of frequency and microcantilever deflection can be seen.
Figure 9.Simulation of microcantilevermotion by COMSOL.
When we increase the length of the microcantilever, the value of deflection increases and the value of resonance frequency decreases.This indicates that the increasing of microcantilever dimension will cause a change in microcantilever mass and also the changes in the value of deflection and resonance frequency.The detail of simulation results for several bacterial masses can be seen in Table 3.
Table 3.The comparison of the resonancefrequencyand deflection for different values of bacteria masses
Microcantilever mass (gram) The detected object mass
(gram) Deflection (m)
Resonance frequency (kHz)
12,815 x 10-9
3 x 10-13
(1 bacterium) 3,05355x10⁻¹¹
118,90 6 x 10-13 (2 bacteria) 3,05385x10⁻¹¹ 118,85 9 x 10-13
(3 bacteria) 3,05415x10⁻¹¹
118,74 12 x 10-13
(4 bacteria) 3,05445x10⁻¹¹
118,68
From the result in Table 3, it can be seen that the increasing of bacteria masses on the microcantilever surface will decrease the value of the resonance frequency and increase the deflectionvalue of microcantilever.
Frequency
4. Conclusion
The main results of this research as follows:
1. In static mode deflection, the increasing of object mass causes an increase in the value of the Wheatstone bridgevoltage change (∆V).
2. In dynamic mode deflection, one bacteria will cause the deflection value of 0.30535 pm and resonance frequency value of 118.90 kHz. Four objects of bacterium will cause the deflection value of 0.30544 pm and resonance frequency value of 118.68 kHz. It means that increasing of the object mass causes an increase in the value of deflection and decrease in the resonance frequency value.
References
[1]. Nardo Ramírez Frómeta. Cantilever Biosensors. Biotecnología Aplicada. 2006; 23(4).
[2]. Sandeep Kumar Vashist. A Review of Microcantilevers for Sensing Applications. Azojono Journal of Nanotechnology Online. 2007; 3(1).
[3]. Demir Akin, Amit Gupta, Rashid Bashir. Detection of Bacterial Cells and Antibodies Using Surface Micromachined Thin Silicon Cantilever Resonators. Other Nanotechnology Publications. 2004; Paper 1. Purdue University, West Lafayette, Indiana.
[4]. MH Abu Bakar, MH Ibrahim, NM Kassim, AB Mohammad. A Preliminary Investigation on MEMS Based Immunosensor for E. coli O157:H7 Detection. IEEE 9th Malaysia International Conference on Communications. Kuala Lumpur. December 2009; 51-54.
[5]. Yang-Choon Lim, Abbas Z Kouzani, Wei Duan, AkifKaynak. Effects of Design Parameters on Sensitivity of Microcantilever Biosensors. The 2010 IEEE/ICME International Conference on Complex Medical Engineering. July 13-15. 2010.
[6]. ADVANCEPIPELINER. Beam Deflection Formulae. http://www.advancepipeliner.com/Resources/Others/Beams/
[7]. Chen Kim Yew, Lim Kian Meng. Design and Analysis of Sensor Array. Bachelor thesis. Singapore: National University of Singapore; 2004.
[8]. Amrul Faruq, Shahrum Shah bin Abdullah, MFauzi Nor Shah. Optimization of Intelligent Controller for an Unmanned Underwater Vehicle.TELKOMNIKA Indonesian Journal of Electrical Engineering. 2011; 9(2): 245-256.
[9]. Ben Ohler.Veeco Instruments Inc. Practical Advice on the Determination of Cantilever Spring Constants. pp. 1-11.
[10]. WT Thomson. Free Vibrations Of A Cantilever Beam (Single Degree Of Freedom System). London: Kindersley Publishing, Inc. 2007.
[11]. M Maroufi, ShZihajehzadeh, MShamshirsaz, AH Rezaie. Effect of Mechanical Properties Variation of Polysilicon on Microcantilever Mass Sensor Sensitivity. EDA Publishing/DTIP. 2010: 144-147. [12]. HayatoSone, Haruki Okano, Sumio Hosaka. Picogram Mass Sensor Using Resonance Frequency
Shift of Cantilever. Japanese Journal of Applied Physics. 2004; 43(6A): 3648–3651.
[13]. Institute for Biomolecular Design. Project CyberCell. E. coli Statistics. http://redpoll.pharmacy.ualberta.ca/CCDB/cgi-bin/STAT_NEW.cgi
[14]. Aditya G Mathad, Rajendra M Patrikar. The Origin of Surface Stress Experienced by a Micro-cantilever Beam. The 2010 IEEE Students' Technology Symposium. IIT Kharagpur. 3-4 April 2010. [15]. COMSOL AB. COPYRIGHT 1994–2007. Structural Mechanics Module Model Library.
[16]. Maziar Norouzi, Alireza Kashaninia. Design of Piezoelectric Microcantilever Chemical Sensors In COMSOL Multiphysics Area. Tehran: Electrical Engineering, Islamic Azad University, Central Tehran Branch (IAUCTB).