ISSN 1818-4952
© IDOSI Publications, 2013
DOI: 10.5829/idosi.wasj.2013.21.1010
Corresponding Author: Wan Hasrulnizzam Wan Mahmood, Faculty of Manufacturing Engineering,
Universiti Teknikal Malaysia Melaka (UTeM), Hang Tuah Jaya, 76100 Durian Tunggal,
Manufacturing Performance in Green Supply Chain Management
Wan Hasrulnizzam Wan Mahmood, Mohd Nizam Ab Rahman, Baba Md Deros,
1 2 2
Kamaruzaman Jusoff, Adi Saptari, Zuhriah Ebrahim, Al Amin Mohamed Sultan,
3 1 1 1
Mohd Hadzley Abu Bakar, Sivarao Subramonian and Zanariah Jano
1 1 4
Faculty of Manufacturing Engineering, Universiti Teknikal Malaysia Melaka (UteM), 1
Hang Tuah Jaya, 76100 Durian Tunggal, Melaka, Malaysia
Advanced Manufacturing Research Group, Faculty of Engineering and Build Environment, 2
Universiti Kebangsaan Malaysia (UKM), 43600 UKM Bangi, Selangor, Malaysia Department of Forest Production, Faculty of Forestry,
3
Universiti Putra Malaysia, 43400 UPM Serdang, Selangor, Malaysia
Centre for Languages and Human Development, Universiti Teknikal Malaysia Melaka (UteM), 4
Hang Tuah Jaya, 76100 Durian Tunggal, Melaka, Malaysia
Abstract: The purpose of the study is to examine the influence of manufacturing performance on green supply chain management amongst Malaysian companies. A conceptual model is proposed and is subjected to an empirical verification with the use of a survey of manufacturing companies in Malaysia. The AMOS structural equation modelling was used to measure the respondents’ overall perceptions of the green supply chain management and current manufacturing performance. Results indicate that improving manufacturing performance leads to an integrated green supply chain, which ultimately leads to an enhancement of environmental compliance as well as an optimisation of the operational resources and product recycling activities. However, most practices have a very weak correlation with overall manufacturing system performance. Being the first ever empirical investigation of the link between manufacturing performance and green supply chain management practices amongst organisations in Malaysia, this study helps industrialist to enhance improvement in productivity. Future research should include different industrial sectors or countries, to enable comparative studies. A larger sample would also allow a detailed cross-sector comparison. Key words: Green Supply Chain Management (GSCM) % Manufacturing Performance % Structural Equation
Modelling (SEM)
INTRODUCTION operations and processes, considering environmental Green Supply Chain Management (henceforth stewardship across the product’s life cycle [2].
over the entire cycle. Many researchers believe that the been adopted in the operational management and service environmental sustainability and ecological performance management literature, with the realisation that the service of an organization may depend on the performance of its provided to customers can be used to improve operational suppliers in these aspects [4-6]. performance. Slack et al. [15] suggests that performance GSCM features three issues that are important to the should always be measured against benchmarks, which theory of ecological modernization and thus are important could be historical standards, target performance to the environmental management and sustainability in standards, competitor performance standards and general: first, the inclusion of environmental aspects in an absolute performance standards. Moreover, Brun et al. integrated chain management of industrial chains for the [16] add that the performance measures must reflect a manufacturing of goods; second, the integration of supply chain’s requirements. This paper examines the technological innovations for environmentally beneficial influence of manufacturing performance on green supply outcomes throughout the industrial supply chain; and, chain management amongst companies in Malaysia. The last, the participation of a broader range of industrial study can be used by other companies to define their own actors for the environmental management of industrial green initiatives and other academics to explore what can production, to strengthen the capacity-building on be improved in green supply chain management and environmental governance [7]. In addition, a review of the sustainability.
literature has shown the existence of an important link
between GSC and supply chain decisions [8]. For some MATERIALS AND METHODS enterprises, a new green perspective will be
transformative, leading to fresh thinking, new markets, This study focuses on analysing the perceptions and profitability gains and increased values. For others, the experience of MS ISO 14001 certified companies in the environmental focus may emerge more gradually and Malaysian manufacturing industry. Nawrocka et al. [17] modestly, as another critical element of corporate strategy believe that ISO 14001 has a facilitating role in the [9]. With time, these companies may find long-term, environmental activities between a customer and a sustained advantage from being green, but not dramatic supplier. In addition, Rao and Holt [18] consider that immediate gains. For the large, heavy industries, the gains certified organisations have a direct responsibility in are closer to being assured, but smaller and “cleaner” greening the supply chain. According to Potoski and organizations will find surprising benefits as well [10]. Prakash [19], the promise of ISO 14001 is that if a A measure of success in implementing any participating organisation adheres to the requirements of manufacturing system or supply chain management can the standard, it will increase its chances of reducing its be defined along a few performance parameters. In the environmental impact relative to the non-participating literature, it is widely suggested that a prerequisite for the organisations. The implementation of the ISO 14001 successful implementation of the corporate, business and requires organisational structures, routines and a operational strategies of an organisation and for any knowledge base to manage the company’s direct improvement initiative, is the use of a reliable performance environmental aspects. Such managerial capabilities can measurement system [11,12]. Being such a fundamental also be utilized to manage the indirect environmental issue of SCM, supplier performance measurement has aspects associated with the activities of the company’s been one of the main concerns for managers and suppliers [20].
academics. Some of the performance measurement The questionnaire designed in this study comprises systems were designed within the academic discipline of three main parts: company profile, GSC practices and accounting, since for many decades the main strategies of manufacturing system performance. The first part is organisations were price competition and cost reduction designed to provide fundamental and background
[13,14]. information, including industry type, employees (size) and
The data collection involves distributing GSC Practice: GSC practices were evaluated on a four questionnaires to various manufacturing companies point scale. For each item, the percentage of companies with MS ISO 14001 certifications in Malaysia. All which state “agree” and “strongly agree” were determined target respondents are selected from the SIRIM QAS from the data. Table 2 provides the details of the (a Malaysian certification body) database, which have exploratory analysis. Considering both “agree” and over two years’ experience in implementing the certified “strongly agree”, the item which has the highest environmental management system (EMS). If the certified percentage (98%) is “taking environmental criteria into company has more than one plant, a single plant is consideration”, implying that all respondents are either preferred. In other words, from a total of 522 certified “agree” or “strongly agree” to the item followed by companies, just 241 companies are considered as the “environment-friendly raw materials” (96%). Optimization population. The questionnaire, comprising 29 items, is of processes to reduce solid wastes, recycling of distributed to the managing directors and environment materials internal to the company, optimization of management representatives. processes to reduce air emission and design A total of 241 questionnaires were mailed out and 61 considerations are also implemented in the majority of were returned, of which 50 were valid, representing a cases (94%). For substitution of environmentally response rate of 20.74%. This sample size meets the questionable materials, 92% of the companies indicate absolute minimum requirement for the maximum likelihood “agree” or “strongly agree”. Among the items which are estimation (MLE) procedure to provide a valid result, as least implemented include eco-labelling (34%), recovery prescribed by Hair et al. [21] although they recommend a of the company's end-of-life products (52%) and taking number of 100 or higher. Other studies also utilize a back packaging (56%).
response rate similar to this study. For example, Based on the findings, all certified MS ISO 14001 Bowen et al. [22] use a sample of 24 firms to identify organisations consider environmental criteria. Many the supply management capabilities in a corporate organizations have participated in the development of the environmental approach; Rao [3] and Rao and Holt [18] green management programmes in Malaysia. They are produce significant findings regarding a green supply government agencies, industry organizations, research chain with a sample of only 52 firms; Simpson et al. [23] and development organizations, environmental service use a sample of 55 firms to explore green supply chain organizations, non-governmental organizations and public practices in the Australian automotive industry; more and finance sectors. The Department of the Environment recently, Holt and Ghobadian [24] used a sample of 60 (DOE), under the Ministry of Natural Resources and usable surveys, without a specific population, to perform Environment, is empowered under the Environmental an empirical study of green supply chain practices Quality Act (EQA) of 1974 to control and prevent amongst UK manufacturers. This implies that the sample pollution and to protect and enhance the quality of the response rate of this study is acceptable and it reflects the environment. The DOE has a stake in Cleaner Production topical relevance of green supply chain management in (CP) implementation, since the adoption of CP by Small Malaysian manufacturing MS ISO 14001 certified and Medium Industries (SMIs) will reduce pollution in a
companies. significant way. Effective from 9 April 2009, a new
RESULTS AND DISCUSSION green management programme in Malaysia. The Demography of Respondents: Table 1 lists the Technology and Water (KeTTHA) reflects the nation’s distribution of respondents in terms of their determination to drive home the message that ‘clean and manufacturing sectors, ownership, company size and green’ is the way forward towards creating an economy years’ experience of EMS. The highest percentage of that is based on sustainable solutions [25]. The National respondents is from the electrical and electronic industries Green Technology Policy (NGTP) was formulated to (42%), followed by chemical products and engineering provide guidance and to create opportunities for (38%), the automotive industry (12%) and mechanical businesses and industries to bring a positive impact to engineering (8%). The majority of respondents were economic growth.
companies with fewer than 250 or more than 750 Table 3 shows the factor analysis results. Factor employees. Meanwhile, 64% of respondents have more analysis was performed to extract factors based upon the than 8 years’ experience of EMS. principal components analysis with varimax rotation.
th
Table 1: Demography of respondents
Size (employees) EMS experience (certified years)
---
---Type of industry Items % Items % Items
Mechanical engineering 8.0 > 750 30.4 > 15 10.0
Automotive engineering 12.0 501 - 750 10.9 8 - 12 54.0
Electrical & electronic engineering 42.0 250 - 500 23.9 4 - 7 24.0
Chemical products & engineering 38.0 < 250 34.8 < 3 12.0
Table 2: Green Supply Chain Practices
Green Practices Agree (%) Strongly Agree (%) Total (%)
1.Taking environmental criteria into consideration 58 40 98
2.Environment-friendly raw materials 44 52 96
3.Optimization of processes to reduce solid wastes 56 38 94
4.Recycling of materials internal to the company 56 38 94
5.Optimization of processes to reduce air emissions 62 32 94
6.Design considerations 68 26 94
7.Substitution of environmentally questionable materials 46 46 92
8.Optimization of processes to reduce water use 56 34 90
9.Optimization of processes to reduce noise 58 32 90
10.Use of cleaner technology processes to make savings (energy, water, wastes) 58 32 90
11.Choice of suppliers by environmental criteria 52 32 84
12.Environment-friendly improvement of packaging 58 24 82
13.Urging/pressuring supplier(s) to take environmental actions 62 18 80
14.Providing consumers with information on environmentally friendly
products and/or production methods 52 22 74
15.Change to more environment-friendly transportation 50 14 64
16.Eco-labelling 46 16 62
17.Taking back packaging 44 18 62
18.Use of alternative sources of energy 50 10 60
19.Recovery of the company’s end-of-life products 40 16 56
20.Helping suppliers to establish their own EMS 46 6 52
21.Use of other companies’ waste 26 8 34
Table 3: Factor analysis of green practices
Dimension GSC practices Item loading range Eigenvalues Cumulative percent Cronbach's alpha Product Helping suppliers to establish their own EMS (PR1) 0.829 8.507 40.510 0.891 recycling (PR) Use of alternative sources of energy (PR2) 0.810
Recovery of the company's end-of-life products (PR3) 0.806 Use of other companies’ waste (PR4) 0.737 Taking back packaging (PR5) 0.723
Eco-labelling (PR6) 0.667
Environmental Taking environmental criteria into consideration (EC1) 0.761 2.465 52.247 0.867 compliance (EC) Choice of suppliers by environmental criteria (EC2) 0.727
Substitution of environmentally questionable materials (EC3) 0.723 Environment-friendly raw materials (EC4) 0.704 Use of cleaner technology processes to make savings 0.676 (energy, water, wastes) (EC5)
Urging/pressuring supplier(s) to take environmental actions (EC6) 0.602
Optimization (OPT) Optimization of processes to reduce air emissions (OPT2) 0.891 0.809 60.862 0.912 Optimization of processes to reduce air emissions (OPT2) 0.856
Table 4: Performance of manufacturing systems
Relative Performance (%)
---MP 1 2 3 4 Mean sd
MP1. Product quality improvement - 10 58 32 3.22 0.616
MP2. Work-in-progress reduction - 6 80 14 3.08 0.444
MP3. Throughput time reduction - 8 80 12 3.04 0.450
MP4. Lead time reduction 2 10 70 18 3.04 0.605
MP5. Machine utilization improvement - 14 70 16 3.02 0.553
MP6. Manufacturing cost reduction - 12 76 12 3.00 0.495
MP7. Flexibility improvement - 16 74 10 2.94 0.512
In addition, Barlett’s test of sphericity and the which could be denominated into two different factors. Kaiser-Meyer-Olkin (KMO) measure of sampling However, the correlation value (0.57) between the two adequacy were employed to test the appropriateness of groups is considered a strong relationship and the 4 items the data for factor analysis. The results of KMO show have been extracted into one factor. The new Cronbach’s that the compared value is 0.627, significantly exceeding alpha value of 0.747 reveals a high internal consistency. the suggested minimum standard of 0.5 required for
conducting factor analysis [26]. Based on the tests, it is evident that all factors are suitable for applying factor analysis. Factor analysis is performed to extract factors in accordance with the eigenvalues of discontinuity greater than 1 and factor loading exceeding 0.5 is the principle in choosing factors. Seven variables are eliminated because their factor loadings are less than 0.5. Therefore, the remaining 14 items are re-analyzed and extracted into three dimensions, representing at least 60.862% of variance namely product recycling, environmental compliance and optimization. Reliability concerns the extent to which an experience, test or any measuring procedure yields the same results in repeated trials. The reliability of the factors needs to be determined to support any measures of validity that may be employed. Both reliability tests and item analysis are recalculated without those seven items. Table 3 lists the new Cronbach’s alpha values, ranging from 0.867 to 0.912, after the seven items are dropped. Generally, Cronbach’s alpha values in this study are greater than 0.6, revealing a high internal consistency.
Performance of the Manufacturing System: The companies are requested to indicate the performance of their manufacturing system. The measures used are 1 (very poor) up to 4 (very good). The results are summarized in Table 4.
It can be deduced that the respondents are satisfied comparisons described previously, are best understood with most features of the manufacturing systems. On by examples [26].
average, over half of the respondents considered the performance of their systems to be good or very good. Product quality improvement is the performance measure considered to be most satisfactory, whereas flexibility improvement is rated poorly. Cronbach’s alpha values (0.843) of the manufacturing performances are greater than 0.7, revealing a high internal consistency. Factor analysis as shown in Table 5 is performed for measuring the manufacturing performance.
The results of KMO show that the compared value is RMSEA value of around 0.08 or less would indicate a 0.774, which significantly exceeds the suggested minimum reasonable error of approximation and would not wish to standard of 0.5 required for conducting factor analysis. employ a model with a RMSEA greater than 0.1.
Three variables have been eliminated because their factor loadings were lower than 0.5. The remaining 4 items were re-analyzed, representing at least 66.935% of variance,
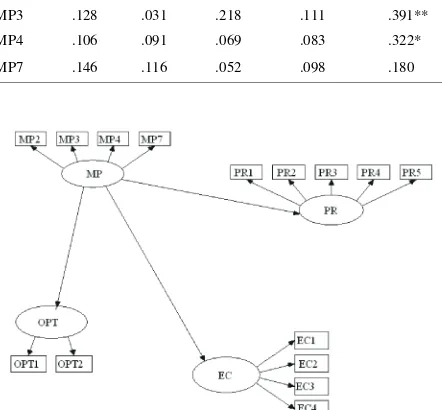
Structural Equation Modelling: The model is run using AMOS graphics for Windows Version 5.0, estimating the regression weight of each link and the associated significance. Figure 1 shows the regression weights between the latent constructs. As indicated by the statistics detailed in Table 6, the overall convergence of the SEM model is significant after some items, such as PR6, EC5 and EC6 are dropped as their factor loadings are lower than 0.7. The convergence of the model is given by the Chi square value, the degrees of freedom and the associated probability level, the p-value.
The model is acceptable at a 5% level of significance given a p-value > 0.05. The Chi square values and associated p-value are highly acceptable, indicating a good fit for the model. However, the covariance between latent constructs in GSC practices is not significant, so the model suggests that there is a significant link between manufacturing performance and GSC practices. This is expected, as excellent manufacturing performance encourages GSC practices. On the other hand, baseline comparisons such as NFI, RFI, IFI, TLI and CFI, ranging from 0.645 to 0.918 represent an overall degree of fit (squared residuals from predictions compared to the actual data) on the moderate side. In general, models with overall fit indices of less than 0.9 can usually be improved substantially. These indices and the general hierarchical
The typical range for TLI and CFI lies between 0 and 1, but it is not limited to that range. TLI and CFI values close to 1 indicate a very good fit. Similar to this condition, an RMSEA value of 0.05 or less would indicate a close fit of the model in relation to the degrees of freedom. This figure is based on subjective judgment. It cannot be regarded as infallible or correct, but it is more reasonable than the requirement of exact fit with an RMSEA of 0.0. Browne and Cudeck [27] suggest that an
Table 5: Factor analysis of manufacturing performance
MP Item loading range Eigenvalue Cumulative percentage Cronbach’s alpha
MP2 0.883 3.676 52.518 0.747
MP3 0.789
MP4 0.754
MP7 0.910 1.009 66.935
Table 6: Regression weights
Regression weights Estimate Critical ratio
The maximum likelihood estimates
MP - PR 0.202 1.229
MP - EC 0.414 3.409
MP - OPT 0.221 1.243
Notes: Chi-square =117.059; Degrees of freedom = 87; Probability level =0.17; NFI = 0.743;
RFI = 0.645; IFI = 0.918; TLI = 0.876; CFI = 0.910; RMSEA = 0.084
Table 7: Correlation Spearman Coefficient
Product Recycling Environmental Compliance Optimization
--- ---
---MP PR1 PR2 PR3 PR4 EC1 EC2 EC3 EC4 EC5 OPT1 OPT2
MP2 .293* .171 .151 .116 .514** .385* .427** .470** .385** .179 .231
MP3 .128 .031 .218 .111 .391** .405** .265 .352* .293* .170 .124
MP4 .106 .091 .069 .083 .322* .303* .144 .348* .192 .317* .187
MP7 .146 .116 .052 .098 .180 .241 .398** .277 .317* .122 .150
Fig 1: Structural equation modelling of the relationship between manufacturing performance and GSC practices
Table 7 shows the correlation coefficients results. The results show, Dimension 2- Environmental Compliance has several significant results at the level 0.05 and 0.01. This suggests that some of the green practices are significant with manufacturing system performance at a confidence level of at least 95%. Among the listed green practices, taking environmental criteria into consideration
is most significantly correlated with manufacturing system performance, while lead time reduction (r = 0.514) has the lowest significance level of 0.01. In other words, consideration of the environmental criteria is positively influenced by lead time reduction with a probability of 0.514.
The analysis shows that green practices with a significance level of 0.01 have a better correlation coefficient with manufacturing system performance. However in general, most of the practices have a very weak correlation with overall manufacturing system performance. Green practices such as helping suppliers to establish their own EMS, use of alternative sources of energy, use of other companies’ waste, taking back packaging, eco-labelling and optimization of processes to reduce air emissions are not significantly linked with any manufacturing system performances.
This research model has a theoretical support and its hazardous substances and at least maintaining the quality empirical results suggest that MP matches GSC practices of the external natural environment. In industry, resource to business performance. efficiency aims to reduce material, water and energy
This paper demonstrates the link between manufacturing performance and GSC as an agent for product recycling, environmental compliance and optimisation of resources amongst a sample of companies in Malaysia. Buehlmann et al. [28] state that some governments have imposed new recycling requirements on manufacturing organisations, such as electronic product take-back or packaging waste reduction targets. In addition, higher landfill fees have also forced organisations to reconsider the costs of reuse against the costs of offsite transfer and disposal. More and more supply chains too have sought to introduce recycled products, which, in turn, expose an industry to recycling innovation. Optimizing the value added is recommended to secure economic efficiency and sustainability, thus green product design, of course, has a real impact on adding values in recycling activities, resulting in economic and environmental benefits. In addition, recycling of a product or material, as an industrial process, commences on completion of its primary purpose use, i.e. at its (economic) end-of-life. The product is somehow transferred to an intermediary - the first step in separation of products and materials - and then the part-products or materials are transferred to further re-use or recovery in a number of different ways [34].
Environmental compliance may be defined as the state of being in accordance with a set of guidelines, specifications or legislative mandates designed to protect or manage targeted environmental resources or amenities [35]. Achieving compliance and identifying situations where actions or activities fail to agree with established standards, remain a vital aspect of environmental protection [36]. Therefore, an effective environmental compliance program is an essential ingredient for organisations whose activities imposed on the environment. Hence, environmental regulations present significant challenges to manufacturing companies. The manufacturing environmental regulations may impact on the entire value chains, from inbound logistics (i.e. receiving, storing, material handling, warehousing and inventory control) through the transformation process to outbound logistics (collecting, storing and physical distribution of product) [20].
Optimisation of resources is a key concept and tool for an industry to use to move towards an enhanced sustainability of practice [37]. The principles include avoiding and/or reducing waste generation, replacing
consumption; the combined savings from the bottom line will create economic benefits for the company and hence for the community. Furthermore, avoiding any loss in the process itself is essential for an efficient use of resources. Optimisation of resource opportunities must be considered when designing products - design needs to consider the long term waste management strategy for the product to enhance its lifetime and to increase its ease of disassembly for recycling.
CONCLUSION
In a nutshell, improvements in manufacturing performances such as work-in-progress reduction, throughput time reduction, lead time reduction and flexibility improvement can potentially lead to greening supply chain management in Malaysia. The respondents are satisfied with the results of the implementation of most of the green supply chain practices and current manufacturing systems. The GSC practices can be denominated into three dimensions, positively influencing some manufacturing system performances, especially with environmental compliance. However, the results show that most of the significant correlation coefficients are below 0.6, suggesting only a weak influence on performance. In addition, the results do not provide enough evidence to conclude that green supply chain practices can influence overall manufacturing system performances. Nevertheless, the results of this research are useful in helping manufacturing firms to identify an effective approach towards successful green supply chain practices. Future research should empirically test the relationships of GSC practices in this study for different criteria, such as type of industry, company size, organisational behaviour to enable a comparative study. A larger sample would also allow a detailed cross-sector comparison.
ACKNOWLEDGEMENT
REFERENCES 12. Mahmood, W.H.W., M.N. Ab Rahman and
1. Sarkis, J., 2006. Greening the Supply Chain, UK: Springer-Verlag London Limited.
2. Corbett, C.J. and R.D. Klassen, 2006. Extending the horizons: Environmental excellence as key to improving operations. Manufacturing and Service Operations Management, 8(1): 5-22.
3. Rao, P., 2002. Greening the supply chain: a new initiative in South East Asia. International Journal of Operations and Production Management, 22(6): 632-655.
4. Linton, J.D., R. Klassen and V. Jayaraman, 2007. Sustainable supply chains: an introduction. Journal of Operations Management, 25(6): 1075-1082. 5. Vachon, S. and R.D. Klassen, 2006. Extending green
practices across the supply chain: the impact of upstream and downstream integration. International Journal of Operations and Production Management, 26(7): 795-821.
6. Simpson, D.Y., D.J. Power and D. Samson, 2007. Greening the automotive supply chain: a relationship perspective. International Journal of Operations and Production Management, 27(1): 28-48.
7. Berger, G., A. Flynn, F. Hines and R. Johns, 2001. Ecological modernisation as a basis for environmental policy: current environmental discourse and policy and implications on environmental supply chain management. Innovation, 14(1): 55-72.
8. Seuring, S. and M. Müller, 2008. From a literature review to a conceptual framework for sustainable supply chain management. Journal of Cleaner Production, 16(15): 1699-1710.
9. Gao, Y., J. Li and Y. Song, 2009. Performance evaluation of green supply chain management based on membership conversion algorithm, In proceeding: IEEE International Colloquium on Computing, Communication, Control and Management.
10. Zhu, Q., J. Sarkis and K. Lai, 2007. Initiatives and outcomes of green supply chain management implementation by Chinese manufacturers. Journal of Environmental Management, 85(1): 179-189. 11. Giannakis, M., 2007. Performance measurement of
suppliers’ relationships. Supply Chain Management: An International Journal, 12(6): 400-411.
B.M. Deros, 2011. The Relationship between manufacturing system performance and green practices in supply chain management. World Academy of Science, Engineering and Technology, pp: 59.
13. Zhu, Q., J. Sarkis, J.J. Cordeiro and K. Lai, 2008. Firm-level correlates of emergent green supply chain management practices in the Chinese context. The International Journal of Management Science, 36(4): 577-591.
14. Mahmood, W.H.W., N.M. Tahar, M.N. Ab Rahman and B.M. Deros, 2011. Supply chain enhancement through product and vendor development programme. Journal of Modelling in Management, 6 (2), 164-177.
15. Slack, N., S. Chambers and R. Johnston, 2004. Operations Management, (4 ed.). London: Pearsonth
Education.
17. Nawrocka, D., T. Brorson and T. Lindhqvist, 2009. ISO 14001 in environmental supply chain practices. Journal of Cleaner Production, 17(16): 1435-1443. 18. Rao, P. and D. Holt, 2005. Do green supply chains
lead to competitiveness and economic performance? International Journal of Operations and Production Management, 25(9): 898-916.
19. Potoski, M. and A. Prakash, 2005. Covenants with weak swords: ISO 14001 and facilities’environmental performance. Journal of Policy Analysis and Management, 24(4): 745-769.
20. Handfield, R., R. Sroufe and S. Walton. 2005. Integrating environmental management and supply chain strategies. Business Strategy and the Environment, 14(1): 1-19.
21. Hair, J.F., R.E. Anderson and R.L. Tantham, 2006. Multivariate Data Analysis (10 ed.). New Jersey:th
Prentice Hall.
23. Simpson, D.Y., D.J. Power and D. Samson, 2007. 29. Anderson, H. and M.H. Brodin, 2005. The Greening the automotive supply chain: a relationship consumer’s changing role: the case of recycling. perspective. International Journal of Operations and Management of Environmental Quality: An Production Management, 27(1): 28-48. International Journal, 16(1): 77-86.
24. Holt, D. and A. Ghobadian, 2009. An empirical 30. Heyes, A., 2000. Implementing environmental study of green supply chain management regulation: enforcement and compliance. Journal of practices amongst UK manufacturers. Journal of Regulatory Economics, 17(2): 107-129.
Manufacturing Technology Management, 20(7): 933-956.
25. Kettha. 2009. National Green Technology Policy: assessment: A neural network application.
Malaysia. Environmental Science and Policy, 12(7): 948-958.
26. Lattin, J.M., J.D. Carrol and P.E. Green, 2003. 32. García, V., E. Pongrácz, P. Phillips and R. Keiski, 2008. Analyzing Multivariate Data, Canada :Thomson Factors affecting resource use optimisation of the
Learning Inc. chemical industry in the Northern Ostrobothnia
27. Browne, M.W. and R. Cudeck, 1993. Alternative ways of assessing model fit. In Bollen, K.A. and Long, J.S. [Eds.] Testing structural equation models. Newbury Park, CA: Sage, pp: 136-162.
28. Buehlmann, U., M. Bumgardner and T. Fluharty, 2009. Ban on landfilling of wooden pallets in North Carolina: an assessment of recycling and industry capacity. Journal of Cleaner Production 17(2): 271-275.
31. Lein, J.K., 2009. Implementing remote sensing strategies to support environmental compliance