Abstract—A number of mass spectrometry applications are already available as web-based and windows-based systems to calculate isotope pattern and to display the mass spectrum based on the specific molecular formula besides providing necessary information. These applications were evaluated and compared with our new alternative application called Theoretical Isotope Generator (TIG) in terms of its functionality and features provided to prove this new application is working better and performing well. TIG provides extra features than others, complete with several functionality such as drawing, normalizing and zooming the generated graph that convey with the molecular information in a number of formats by providing the details of the calculation and molecules. Thus, any chemist, students, lecturers and researchers from anywhere could use TIG to gain related information on molecules and their relative intensity.
Keywords—Isotope pattern calculator, mass number, mass spectrum, relative intensity.
I. INTRODUCTION
ASS spectrum is defined as the pattern of relative’s abundances of ions for different atomic or molecular mass (mass-to-charge ratio) within a sample and frequently refers to given elements measured with the relative abundance of isotope. Thus, a mass spectrum records mass (or m/z) on the x-axis and corresponding ion abundance on the y-axis as a series of peaks. The peak corresponding to the ion greatest abundance is called the base peak, which can correspond to the molecular ion or to any one of the fragment ion [1].
Nowadays, there are isotope pattern calculators that represent in web-based and windows-based application to view the mass spectrum. The existing systems face a number of problems, such as slow performance of viewing the output, incomplete graph interface which not user friendly and low capability in output the values of large molecules. Thus, to overcome this problem Theoretical Isotope Generator (TIG) is developed. This system also tries to calculate the exact molecular formula and molecular weights before producing the graph. Then, the system is producing a screen with numeric of data and a graphical presentation of the calculated masses and their relative occurrences. Not only that, this windows application program is focusing in generating the mass spectrum and viewing the results of mass spectrum with the most intense line set to 100% which is called as normalization as an additional facility to the users. Each function provided will be described in Section 3.0.
II. SIMILAR SYSTEMS
A number of systems are available which either web-based or windows-based system where a set of simple interactive calculators for chemistry which provide some features and operate by the user typing a molecule formula, example H2O and the isotope patterns or elemental abundances are returned on a new page. In section below, the systems that are available on web and are need to install in the client computer which are windows-based will be described. The latter systems are better in terms of the availability and performance.
A. Web-Based Isotope Pattern Calculator
In this section, the systems Sheffield ChemPuter, Isotope Distribution Calculator and Isotope Pattern Calculator v4.0 are described. These systems can be said to be available 24/7 anytime anywhere and the features limited to the capability of browser.
1) Sheffleld ChemPuter
This web-based system is well-known in chemistry field, produced by Mark Winter at the University of Sheffield as online software tools for chemistry staff and students [2]. One of the sub-functions that focused is isotope pattern calculator. It will calculate the percentage of each possible isotope for each element by typing an element’s symbol or the formula of a chemical compound, and the program does the calculation to get the isotope pattern of the parent peak on its mass spectrum. This provides very basic functionality compare to other systems but it is able to be incorporated into other systems for example provided as a component of the WebElements [3] software. It does not cater the abundance of isotope. Under normal conditions it can handle hundreds to thousands of calculations per day without problems. There are other six sub functions that are available such as Element percentages, Yields, Oxidation state, Electron count, VSEPR and MLXZ.
2) Isotope Distribution Calculator
This program has been developed by Scientific Instrument Services (SIS) as part of the Mass Spec Tools Collection and still under development. This program can calculate the isotopic distribution of a given chemical species. It can also plot either calculated or manually inputted isotopic distributions. The user needs to input using the standard one
Theoretical Isotope Generator: An Alternative
towards Isotope Pattern Calculator
K. Massila, R. D. Stein, S. M. Suhaizan, and A. A. Azlianor
M
World Academy of Science, Engineering and Technology 26 2007
or two letter chemical symbol, number of atoms and parenthesis where applicable [4]. In this system, the same atom can be listed more than one and where no quantity is listed, it is assumed to be one. Among the advantages of this program is that it is able to calculate the exact molecular formula ad molecule weight together with the isotopic distribution of molecules. The program is based on the binomial theorem for the calculation of the isotopic distribution of the mass distribution.
3) Isotope Pattern Calculator v4.0
This program was developed by Junhua Yan and currently in version 4.5. It is free to use but this software is not free to get a copy unless with permission. The user interface is not organised due to provide more functionalities. This program could calculate molecular weight and mass. It could also view the isotope pattern in a graph with low or high resolution [5]. Beside, this system is capable to add the new group of molecule by inserting the group name, code and molecular formula from the interface. It also allows users to view the mass in a specific range and user has specialty in choosing the decimal places of mass in data table before viewing the graph.
B. Windows-based Isotope Pattern Calculator
In this section, the systems PAT and Isotope Pattern Viewer are described. These systems can be said to be more complex than web-based which provide more features and is not dependable to browser.
1) PAT for Windows
This program was written by Dr. Bruce W. Tattershall at the University Of Newcastle, England and is designed for chemistry teaching [6]. It has been tested successfully on new version of Windows XP. There are two ways to install this program that are either using zip file, extract it and run installation or a self extracting executable file. Given a formula consisting of element symbols and numbers of atoms, for an ion observed in a mass spectrum, program PAT will calculate the pattern of intensities which will be produced, as a line graph and as a list of relative intensities against mass number. The capability of PAT is limited. It only calculates the specific molecular formula which is stored and present in the window. Besides, it does not have printing facility and cannot view the molecule in specific range.
2) Isotope Pattern Viewer v1.0
Isotope pattern viewer v1.0 is produced by SurfaceSpectra Ltd. The interface is simple and it seems to work fine but it runs slowly as soon as the size of the molecular formula increased. It is free software that allows user to view and export isotope patterns. This is the initial version by this company and provides a host of features such as viewing the exact mass and natural abundance as specified by NIST using a Gaussian peak shape of user define width. The isotope pattern can be copied and pasted in Ms Word and etc. Besides, it covers all stable elements and user can input more
than one element at once [7].
III. THEORETICAL ISOTOPE GENERATOR FUNCTIONALITIES A. Drawing Function
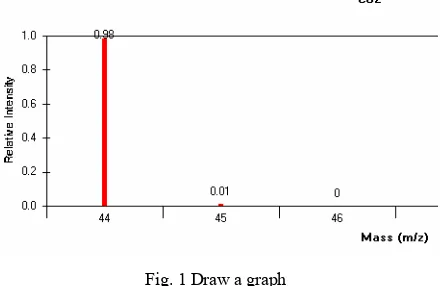
Drawing function lets the user to plot the mass spectrum graph. Through this graph, the mass spectrum will be plotted based on the molecules, which are inputted by the user. Before that, it will follow a few steps to gain the values for each isotope. Firstly, the system will try to get the atom and calculate the value of atom using the calculation of array and matrix. It will retrieve the value of atom or molecule through the database. The combination of atom and the total of weight (relative intensity) and mass number are found. The molecules also will be plotted base on their maximum and minimum value. Before that, the value of x-axis is found. The value for x-axis is the value of mass number. After getting the value for x-axis, the system will find the value for y-axis. The value for y-axis is the total of weight (relative intensity) of the isotopes. After getting both values, the system will filter the value according to the maximum and minimum value. Then, it will sort the data according to ascending method. By getting all the values, the system will plot the graph and label the graph accordingly.
Fig. 1 Draw a graph
B. Normalization Function
The system also allowed the users to normalize the mass spectrum diagram. Each spectrum could be normalized up to 100%. With normalization function, the user can view the value of mass spectrum clearly. Equation (1) is the formula for getting normalization value.
) (
100 ) (
weight ue HighestVal
weight
Value × (1)
In TIG, this function is separated with the Drawing function because it allows the user to have better choice whether to view the exact value or the normalized value. Most of the existing system is showing just one type of graph for the mass spectrum. Example of normalized graph is shown in Fig. 2. World Academy of Science, Engineering and Technology 26 2007
Fig. 2 Normalize graph
C. Detail Calculation Function
Users can click on the ‘Detail’ button to view the value of molecules, which already have calculated as shown in Fig. 3. So, the users can check whether the value is parallel with the graph or not.
Fig. 3 Detail to show the value of molecules
Besides, there is another ‘Detail’ button for the graph to show the mass number and the composition of specific atom besides showing the method of calculation for the combination of molecules together with each value for the molecules. This function also is not provided in any existing isotope calculators. Refer to Fig. 4 as the example of the first ‘Detail’ in showing the value of the molecules.
Fig. 4 Detail (graph detail - mass number and composition, and method of calculation)
D. Zooming Function
The system allowed users to zoom in the scale of the graph whether in the normal graph or the normalized graph. By using this function, users need to input the value of scale from beginning to end where the users want the graph to be viewed. With this zooming function, the users can view the graph in specific range E.g.: 44 to 47. Thus, they do not need to view all the spectrums in a wide range like 0 to 50. They can choose to view the chart in between the wide range and capable of bringing the graph into normal state. Fig. 5 is the example of zooming function:
Fig. 5 Example of zooming function
IV. COMPARISON AND EVALUATION
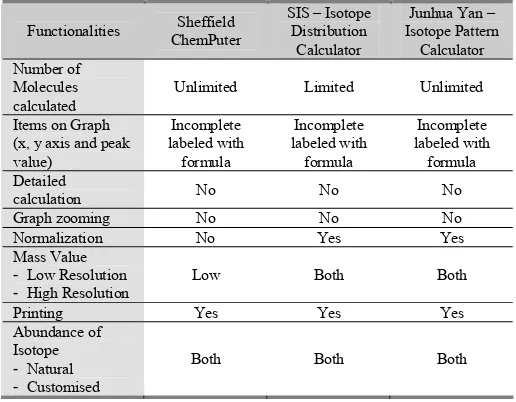
We compare the major isotope pattern calculator which has been available and used worldwide, with our new program called TIG. Even it is web-based application, we consider their functionalities too. Evaluation is made in order to prove this TIG is working better than the existing systems. The comparison and evaluation between TIG and existing web-based systems represented in table format as in Table I.
TABLEI
WEB-BASED (COMPARISON OF DIFFERENT WEB-BASED ISOTOPE PATERN
CALCULATOR) Functionalities Sheffield
ChemPuter
SIS – Isotope Distribution
Calculator
Junhua Yan – Isotope Pattern
Calculator Number of
Molecules calculated
Unlimited Limited Unlimited
Items on Graph (x, y axis and peak value)
Incomplete labeled with
formula
Incomplete labeled with formula
Incomplete labeled with
formula Detailed
calculation No No No
Graph zooming No No No
Normalization No Yes Yes Mass Value
- Low Resolution - High Resolution
Low Both Both
Printing Yes Yes Yes
Abundance of Isotope - Natural - Customised
Both Both Both
There are number of reasons why we are not developing TIG as web-based application. First, web-based used web server which may cause server to down probably because of maintenance and update. This makes the availability is not 24/7. Second, slow in response to return a result of calculated World Academy of Science, Engineering and Technology 26 2007
isotope pattern compare to windows-based application. This is due to the fact that all requests must send to the server. Third, calculating complex isotope pattern need more processing that makes slower if many request to the same application at the same time [6]. Table I shows that the functionalities provided in web-based isotope pattern calculator are not adequate due to the usage of browser as a medium to convey information.
TABLEII
WINDOWS-BASED (COMPARISON OF DIFFERENT WINDOWS-BASED ISOTOPE
PATTERN CALCULATOR)
Functionalities TIG PAT Isotope Pattern
Viewer Number of
Molecules calculated
Unlimited Limited Limited
Items on Graph Complete labelled with
formula
Incomplete labeled and without formula
Complete labelled with
formula Detailed
calculation Yes No No
Graph zooming Yes No No
Normalization Yes No Yes Mass Value
- Low Resolution - High Resolution
Low Low Low
Result Printing No No No
Abundance of Isotope - Natural - Customised
Both Natural Both
The importance of developing this system as desktop application mainly in windows-based application is because to provide more functionalities and systematic to users for having as much as possible the information in calculating the isotope and molecule formula. TIG is the only system that capable of generating graph with complete labelling and formula. Furthermore, functions such graph zooming capabilities and normalization are provided to ease the users in viewing mass spectrum and isotope pattern. Detailed calculation function is capable in allowing user to check the value that stated in graph is parallel with the calculation. The comparison of different windows-based isotope pattern calculator is shown in Table II.
V. CONCLUSION AND FUTURE ENHANCEMENT
As personal computer grew faster and powerful, Theoretical Isotope Generator is developed as a windows-based application where it will always available on the computer as long as it is installed. Although there are a few systems available, this system is different starting from its developing tools until its implementation. The result shows that this system compared to other similar systems is working better as desktop application instead of having to publish on the Internet. TIG provides more functionalities to users such as complete labeled with formula, graph zooming capabilities, normalization and showing detailed calculation.
This system will be viewed as a foundation stone to developing a more sophisticated system. Future enhancement
may include things like a more feature rich graphical user interface and/or the ability to match the system data against actual experimental data with a view to compound identification, and/or linking the system with a mass spectrometer results display system. With further research into the features and calculation method, it is hoped that further techniques will be developed for accuracy and efficiency. In addition, it has a potential to improve the scope for the students and lecturers in chemistry area of study where as a learning software tool for their learning and teaching process together with their research and development.
REFERENCES
[1] C. G. Herbert, R. A. W. Johnston, Mass Spectrometry Basics, CRC Pree LLC, United States, 2003.
[2] M. Winter, University of Sheffield, England. (2005, May 24). [Online]. Available: http://www.shef.ac.uk/chemistry/chemputer/mlxz.html. [3] M. Winter, WebElements Ltd. (2006, August 16). WebElements
1993-2006 [Online]. Available: http://www.webelements.com.
[4] Scientific Instrument Services. (2005, May 22). [Online]. Available: http://www.sisweb.com/referenc/tools/massdes.htm.
[5] J. Yan. (2005, May 22). Isotope Pattern Calculator v4.0. [Online]. Available: http://www.geocities.com/junhuayan/pattern.htm.
[6] B. Tattershall, University of New Castle, England. (2005, May 24).
[Online]. Available: http//www.staff.ncl.ac.uk/bruce.tattershall/software/pat/readme.html
[7] S. S. Limited. (2006, October 12). Isotopes [Online]. Available: http://www.surfacespectra.com/software/isotopes/download.html. [8] W. D. Callister, Jr., Materials Science And Engineering An Introduction
Sixth Edition, John Wiley & Sons Inc, 2003.
[9] K. J. R. Rosman, and P. D. P. Taylor, Isotopic Compositions Of The Elements 1997, International Union Of Pure And Applied Chemistry, Curtin University of Technology, Australia, 1997.
[10] J. Group. (2006, January 12). Isotopic Distribution [Online]. Available: http://jjorg.chem.unc.edu/personal/monroe/MwtHelp/IsotopicDistributio n.htm
[11] S. Gagnon, Jefferson Lab. (2005, September 6). Isotope [Online]. Available: http://education.jlab.org/glossary/isotope.html.
World Academy of Science, Engineering and Technology 26 2007