UNIVERSITI TEKNIKAL MALAYSIA MELAKA
Faculty of Manufacturing Engineering
WIP CONTROL AT END OF LINE OF SEMICONDUCTOR
INDUSTRY USING CONWIP
Lim Ke Sin
Master of Science in Manufacturing Engineering
WIP CONTROL AT END OF LINE OF SEMICONDUCTOR INDUSTRY USING CONWIP
LIMKE SIN
A thesis submitted
in fulfillment of the requirements for the degree of Master of Science in Manufacturing Engineering
Faculty of Manufacturing Engineering
UNIVERSITI TEKNIKAL MALAYSIA MELAKA
DECLARATION
I declare that this thesis entitled "Wip Control At End Of Line Of Semiconductor
Industry Using Conwip" is the result of my own research except as cited in the
references. The thesis has not been accepted for any degree and is not concurrently
submitted in candidature of any other degree .
Signature
...
セZ@
... .
Name
...
Um
ICE Sl/\J
APPROVAL
I hereby declare that I have read this dissertation/report and in my opinion this
dissertation/report is sufficient in terms of scope and quality as a partial fulfillment of
Master of Manufacturing Engineering (Industrial Engineering).
Signature
Zᄋᄋᄋᄋᄋ セ
[セ ᄋ[ ᄋᄋᄋᄋᄋᄋᄋᄋᄋᄋᄋᄋᄋᄋᄋ@
...
Supervisor Name
DEDICATION
ABSTRACT
ACKNOWLEDGEMENTS
Special thanks to my supervisor, Associate Professor Dr Chong Kuan Eng for his support throughout my research. Without his guidance and persistent help, this dissertation would not have been completed.
I would like to express my appreciation for my family members and friends who supported and encouraged me throughout the time of this research.
DECLARATION APPROVAL DEDICATION ABSTRACT ABSTRAK ACKNOWLEDGEMENTS TABLE OF CONTENTS LIST OFT ABLES LIST OF FIGURES LIST OF APPENDICES LIST OF ABBREVIATIONS LIST OF PUBLICATIONS
CHAPTER
1. INTRODUCTION
I . I Background
1.2 Background of the Study
TABLE OF CONTENTS
1.2.1 Manufacturing Process in Case Company 1.2.2 EOL Manufacturing Processes
1.3 Problem Statement 1.4 Research Objectives 1.5 Research Scope
1.6 Significance of the Research l. 7 Organization of the Report
PAGE ii iii iv vi viii xi xiii
xv
1 1 I 2 3 4 5 5 6 62. LITERATURE REVIEW 8
2.1 Introduction 8
2.2 Work in Process (WlP) 8
2.2.1 Pull System l 0
2.2.2 WlP Management 11
2.3 Job Release Policy 19
2.3.l CONWfP 20
2.3.1.1 CONWIP Control Strategies 21
2.3.1.2 Applications of CONWIP 23
2.3.1.3 Summary ofCONWIP 41
2.3.2 Buffer Allocation 42
2.4 Discrete Event Simulation (DES) 45
2.4. I Simulation in Industrial Applications 45
2.4 Summary 48
3. RESEARCH METHODOLOGY 50
3. 1 Introduction 50
3.2 Methodology Design - Process Flow, Problem Statement,
Scope, Literature Review 52
3.3 Model Development - Conceptual Model 52
3.4 Model Development - Data Collection and Analysis 56 3.5 Model Development- Verification and Validation 56
3.6 Experimental Design of Experiment Run 59
3.7 Experimental Design - Results, Discussion, Conclusion 64
4.
MODEL DEVELOPMENT AND EXPERIMENT AL DESIGN 4.1 Conceptual Model4.2 Assumptions
4.3 Model Translation in WITNESS Software 4.3 .1 Modelling - Product Mix Distribution 4.3 .2 Modelling - Lot Size
4.3.3 Modelling - Buffer Rule 4.3.4 Modelling - Machine UPH
4.3.5 Modelling - Machine Setup and Breakdown
4.3 .6 Modelling - Calculation of Cycle Time, Number of Lot 4.3.7 Modelling - WIP Calculation
4.4 Model Verification and Validation 4.5 Designing the Experimentations
4.5.1 Experiment I - Single Loop CONWJP 4.5.2 Experiment 2 - Multi Loop CONWIP 4.5.3 Experiment 3 - Hybrid Loop CONWJP
4.5.4 Experiment 4 - Single Loop Buffer Optimization 4.5.5 Experiment 5 - Multi Loop Buffer Optimization
5.
RESULTS AND DISCUSSIONS5.l Experiment I - Single Loop CONWIP Results 5.2 Experiment 2- Multi Loop CONWIP Results 5.3 Experiment 3 - Hybrid Loop CONWIP Results 5.3. l Results and Discussions of Single Loop, Multi Loop
And Hybrid CONWIP with Optimizer
5.4 Experiment 4 - Single Loop Buffer Optimization Results 5.5 Experiment 5 - Multi Loop Buffer Optimization Results 5.6 Summary of Results and Discussions
5.7 Research Contributions
6. CONCLUSION AND RECOMMENDATIONS
6.1 introduction
6.2 Research Conclusions 6.3 Limitations for Research
6.4 Recommendations for Future Research
LIST OFT ABLES
TABLE
TITLE
PAGE
2.1 CONWIP System Summary 36
3.1 Experiment Factor and Response for the Simulation Study 53
4.1 Model Scope 67
4.2 Level of Details of Model 68
4.3 Summary of Component List in the Simulation Model 70
4.4 Product Mix Distribution Calculation Based on Case
Company Historical 71
4.5 Distribution of Lot Size in Case Company Based On
Historical Data 74
4.6 Attribute of Part in WITNESS 76
4.7 Moulding Process UPH of 3 Leads 79
4.8 UPH Mean, Standard Deviation and P-Value for Each Product
Family 81
4.9 Breakdown Time and Repair Time for Each Machine 83
4.10 TH from the Simulation Model 91
4.11 Product Percentage (Actual Data versus Simulation Data) 94
4.12 Number of Production Cards 98
4.13 Number of Production Card at Each Loop 100
5.1 Single Loop CONWIP Results 109
5.2 Multi Loops CONWIP Results 112
5.3 Comparison of Base Model, Single Loop, and Multi Loop
CONWlP Results 115
TABLE TITLE PAGE
5.4
Hybrid CONWIP Results116
5.5
Sorted TH Level of Hybrid CONWIP Results122
5.6
Single Loop, Multi Loop, and Hybrid CONWLP ResultsComparison
126
5.7
Single Loop CONWLP Buffer Optimization Results128
5.8
Multi Loop CONWTP Buffer Optimization Results132
5.9
Comparison of Optimizer Results135
LIST OF FIGURES
FIGURE TITLE PAGE
l.l Major Processes in the Case Company 2
1.2 EOL Process Flow in the Case Company 4
2. l Scheduling Dilemma (Nyhuis, 2006) 9
2.2 CONWIP System. Movement of Parts Are Shown In Blue While
Circulation of Release Authorizations in Green 21
2.3 Tandem CONWIP Loops 21
2.4 Coupled and Uncoupled CONWIP Loops 22
3.1 Process Flow of the Project 51
3.2 Framework for Conceptual Modell ing 53
3.3 Activity cycle diagram for Lot in the Factory 54
3.4 Flow Chart of Lot in EOL 55
3.5 Process Flow of Verification and Validation 57
3.6 Logic Flow Diagram of Lot in EOL 58
3.7 Single Loop CONWlP Flow 59
3.8 Multi Loop CONWIP Flow 61
3.9 Hybrid Loop CONWIP Flow 62
3. 10 Logic Flow Buffer Optimization Incorporates Single Loop
CONWTP System 63
3.1 l Logic Flow Buffer Optimization Incorporate Multi Loop
CONWIP System 64
3.12 Process Flow for Simulation Model 65
4.1 The Input of Product Mix Distribution in Simulation Model 72
4.2 Witness Simulation Initialize Actions Dialog 73
FIGURE TITLE PAGE
4.3 Input Rule of Machine to Pull Product 73
4.4 Detail Buffer of Op Mould 77
4.5 Actions on Input for Buffer Op Mould 78
4.6 Normality Test Result for Moulding Process for 3 Leads 79
4.7 Descriptive Statistic and Power and Sample Size for 3 Leads
Moulding Process 80
4.8 Actions on Start Cycle for Machine Mould 82
4.9 Setup Detail of Mould Machine 83
4.10 Breakdown Detail of Mould Machine 84
4.11 Actions On Output For Machine Count 84
4.12 Simulation Modelling Program Flow Chart 86
4.13 Simulation Base Model in WITNESS (a) 87
4.14 Timeseries TH of the Simulation Model 90
4.15 TH Normality Test Result for Simulation Model 92
4.16 TH One Sample T-Test Result for Simulation Model 92
4.17 I- Sample T-Test Result from Minitab Statistical Software 93
4.18 CONWJP Control System 95
4.19 Setting Number of Cards on Initialize Action 96
4.20 lnput Rule for Planning Machine 97
4.21 Processes of Multi Loop in CONWIP System 99
4.22 Initialize Action Setting Number of Card 102
4.23 Hybrid system at Input Rule of Machine Planning 103
4.24 Model Optimization for Hybrid Loop CONWIP 104
4.25 Model Optimization for Single Loop CONWlP Buffer Optimization 105
4.26 Model Optimization for Multi Loop CONWIP Buffer Optimization 106
5.1 WIP Level in the Single Loop CONWIP System 109
5.2 TH versus WIP Level in the Single Loop CONWIP System 110
5.3 Total WlP and Actual WlP in the Multi Loop CONWIP System 113
5.4 TH Level in the Multi Loop CONWlP System 113
5.5 WIP Level in Hybrid CONWlP 120
5.6 TH level in Hybrid CONWlP 121
FIGURE TITLE
5.7 Sorted TH level in Hybrid CONWIP
5.8 WIP Level for Single Loop, Multi Loop and Hybrid CONWIP
5.9 Buffers Size of Single Loop CONWIP Buffer Optimization
5. 10 Buffer Sizes of Single Loop CONWIP Buffer Optimization
x
PAGE
121
127
130
LIST OF APPENDICES
APPENDIX TITLE PAGE
Al WITNESS Documentor (Parts Entities) lSS
A2 WITNESS Documentor (Buffers Entities) 191
A3 WITNESS Documentor (Machines Entities) 19S
A4 WITNESS Documentor (Transports Entities) 210
AS WITNESS Documentor (Attributes Entities) 213
A6 WITNESS Documentor (Variables Entities) 21S
A7 WITNESS Documentor (Distributions Entities) 222
A8 WITNESS Documentor (Functions Entities) 226
Bl Moulding S lead 227
B2 Moulding 7 lead 228
B3 Tie Bar Cut 3 lead 229
B4 Tie Bar Cut 5 lead 231
BS Tie Bar Cut 7 lead 233
B6 Trim and Form Lead 3 23S
B7 Trim and Form Lead S 236
B8 Trim and Form Lead 7 237
B9 Auto Vision 3 Lead 238
BIO Auto Vision S Lead 239
APPENDIX
B 11 Auto Vision 7 Lead
TITLE PAGE
240
B 12 Manual Inspection 241
CI Single Loop CONWIP Optimizer Results 242
C2 Multi Loop CONWIP Optimizer Results 243
D List of Components and Abbreviations in Simulation Model 244
E Product Process Routes 24 7
ACRONYM AHP AV BAP BAY BMould BPlate BPMC BTBC
BTNF
CAD
CAPPCONLOAD
CONWIP CT DES EDDEOL
EVA FCFS FIFO FOL GA JIT MILIST OF ABBREVIATIONS
DEFINITION
Analytic hierarchy process
Auto Vision
Buffer allocation problem
Buffer Auto Vision
Buffer Moulding
Buffer Plating
Buffer Post Mould Curing
Buffer Tie Bar Cut
Buffer Trim and Form
Computer Aided Design
Computer Aided Process Planning
Constant Load
Constant WJP
Cycle time
Discrete Event Simulation
Earliest due date
End of line
Economic value added
First come first serve
First in first out
Front of line
Genetic Algorithms
Just in time
Manual Inspection
ACRONYM MOLD MSRD MTO MTS OBA PLATE PMC
PO LC A
QTMU SA SC SME SPC
SPT
STC TBCTH
TNF TS UPH VMI WlP DEFINITION MouldingMultiple objective scheduling and real time dispactching
Make to order
Make to stock
Optimal buffer allocation
Plating
Post Mould Curing
Paired-cell Overlapping Loops of Cards
Queue time maximum un-matches
Simulated Annealing
Supply chain
Small Medium Enterprise
Statiscal process control
Short time processing
Statiscal throughput control
Tie Bar Cut
Throughput
Trim and Form
Tabu Search
Unit per hour
Vendor managed inventory
Work in process
LIST OF PUBLICATION AND AW ARDS
Lim, K.S ., 2012. CONWIP Simulation Model for EOL Processes in Semiconductor
lndustry. Malaysia Melaka Technical Universiti, Melaka, Malaysia, 22 February 2012,
Won Silver Medal in UTeMeX 2012.
Chong, K.E and Lim, K.S., 2012. CONWIP Based Control of a Semiconductor End of
Line Assembly. Malaysian Technical Universities Conference on Engineering &
Technology 2012, Perl is, Malaysia, 20-21 November 2012, MUCET 2012.
Chong, K.E and Lim, K.S ., 2013. CONWTP Based Control of a Semiconductor End of
Line Assembly. Procedia Engineering, vol.53 , pp. 607 - 615 .
CHAPTER 1
INTRODUCTION
1.1 Background
In the highly competitive and globalized market, companies strive to ensure high
levels of customers' satisfaction. On time delivery, qualities with minimum cost are the
performance indicators that most customers emphasize on. At the same time, companies
always try to maximize the utilization of the equipment, reduce lead time and unnecessary
waste in order to increase the profit margin. In the lean manufacturing approach, inventory
is one of the wastes and the most challenging part that exists in most companies.
Semiconductor manufacturing involves complicated processes, routes, and
parameters (Miyashita and Gautam, 20 I 0). Work in Process (WlP) is a critical issue for the
semiconductor industry. WIP are parts that have been started but are not completed during
the processes or sequence or routes within the factory. The accumulations ofWIP and control
policies are a challenge to the industry as holding or accumulation of WIP incurs cost to the
company and often causes long process lead time. Proper WIP control and monitoring
policies are critical to ensure that the company remains efficient and competitive.
1.2 Background of the Study
In this research, the study will be conducted in a semiconductor company located at
Batu Berendam, Malacca. The case company produces a variety of semiconductor products
which include DRAMS, small signal devices, as well as power and logic devices. The
products are mainly supplied to the automotive manufacturers. There are 2 main categories
of products namely the small package and the big package. The plant produces and final
tests for the products.
1.2.1 Manufacturing Processes in Case Company
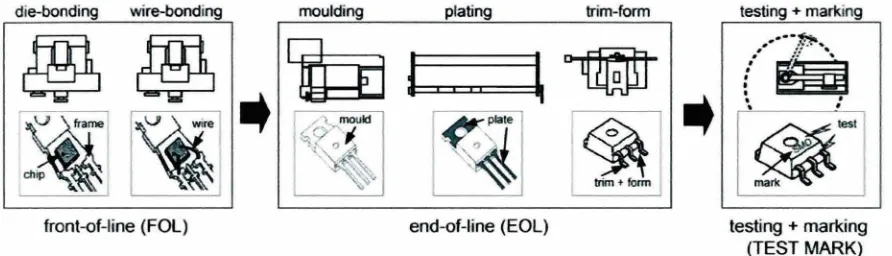
The major manufacturing processes in the case company can be categorized into 3
groups which are front-of-line (FOL), end-of-line (EOL), testing and marking (TEST
MARK) and, finally, quality check and packing processes as shown in figure I. I.
die-bonding wire-bonding moulding plating trim-form
セ
i@
front-of-line (FOL) end-of-line (EOL)
Figure 1.1: Major Processes in the Case Company
testing+ marking
testing + marking (TEST MARK)
FOL major processes which includes are the die bonding and wire bonding are take
places in a clean room environment. The operators are enforced to wear full face cover
uniform to avoid contamination of particle. In general, die bonding is a process assembly of
a die from wafer which has been blade sawed into individual dies and attach to the package
or a lead frame. For the wire bonding is a process of making interconnections between a die
and package or lead frame of semiconductor devices assembly. The wires are to connect the
bonding pad of each device to the lead frame which these wires generally made of gold,
aluminium or copper.
[image:21.522.45.491.277.405.2]EOL processes which also the important part that in this research including the major
processes as moulding, electroplating and trim-form. ln later part of the chapter, will further
expand the process which takes places. These processes are not conducted in a clean-room
environment like FOL and involves with heavy machinery in the EOL module, as injection
moulding machines, cutting and forming tools and electroplating machines. The moulding
is the process of sealing a microchip die with a ceramic or plastic enclosure to prevent
physical damage or corrosion. This is process take places after the wire-bonding has been
completed at the FOL. Operators load and unload magazines which is a metal boxes that
containing up to 40 lead frames to the moulding machine.
Plating is the process for a surface-covering in the semiconductor industry. It is a
method whereby the metals in ionic form are supplied with electrons to form a non-ionic
coating (plate) on a desired substrate. For trim-form process consists in a moulded strip of
components being loaded into a machine that cuts it into individual units called integrated
chjps (lC). After trimmed, the same machine will perform " leg forming" where IC legs are
bent, cut and formed into a desired shape.
The third major processes of testing and marking processes, all the I Cs are tested
I 00%with a machine. The test includes placing the IC in cold or hot temperature, and
inducing electrical stress to test IC robustness and its functions. The markmg process is
incorporated in a testing machine where good ICs will be marked with product information
(product codes, date, logo, etc.) immediately after testing.
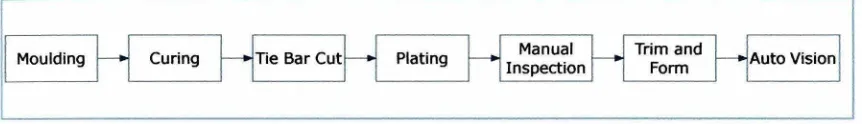
1.2.2 EOL manufacturing processes
This study is conducted on the End of Line (EOL) manufacturing processes. As
shown in Figure 1.2 the end of line actually involves 7 processes which include moulding
(MOULD), post mould curing (PMC), plating (Plate), manual inspection (MI), tie bar cut
(TBC), trim and form (TNF) as well as auto vision (AV). The moulding process is to
encapsulate the frame into the plastic form. The process of plating is completed by a
sub-contractor which outside the plant. On completion of the plating process, the lot will be sent
back to the factory for manual inspection by an operator. Next, the lot will be sent for the tie
bar cutting process and then the trim and form where all the units on the frame will be
trimmed into pieces. Before the lots are sent for final testing, the lots will undergo the auto
vision process which is an automated inspection process.
Moulding Curing Tie Bar Cut Plating Manual Inspection
Trim and Form
Figure 1.2: EOL Process Flow in the Case Company.
1.3 Problem Statement
Auto Vision
The case company is a semiconductor manufacturer of high mix and high volume
products. In one quarter of the production period, case company had produed 17788 lots
with only one product family. This one product family carried 85 diferrent of products type
which have different product routes and parameter. The processes are complex and the routes
are different for each product which depends on the requirements or demands of the
customers .
. With average TH per day around 193 lots, the WlP in the system lies at around 550
- 650 lots everyday. As the volumes are high, the production department monjtors the work
stream to ensure that the WIP levels are within control. However, it is difficult to closely
monitor the WlP level as the work streams are onJy updated at the end of every shift.
Production engineer want to reduce the variation of WIP that float in the system so that the
[image:23.522.56.487.267.329.2]WJP
can be controlled at the satisfactory level. With lesser variation from the productionfloor, engineer can be response quickly when any problems occurs.
Therefore, the company would like to determine a suitable way to control the WTP
in the production lines. Jn addition, the company wants to identify the opportunities to reduce
the cycle time and the waiting time of the lots inside the production.
1.4 Research Objectives
In this research, the main aim is to investigate the WIP level using the CONWIP
control mechanism based on the performance measures of maximum throughput (TH) and
lowest WIP. The research objectives are:
I. to design and develop simulation models for single loop CONWIP, multi loop CONWIP,
hybrid CONWIP, single loop CONWTP and multi loop CONWIP with buffer size
optimization based on the environment in the case company.
2. to determine the maximum TH and minimum WTP from each of the developed models.
1.5 Research Scope
The scope of this research is limited to the EOL of the case company. One of the
most frequent product family which consist 85 products will be taken into account to ensure
that the simulation model represents the real environment. The key performance indicators
for the research are WIP and throughput.
The operational models for the proposed scenarios for different CONWIP control
mechanisms are evaluated using the WITNESS simulation software with optimizer, while
statistical analysis will be conducted with the Minitab Statistical Software.