UNIVERSITI TEKNIKAL MALAYSIA MELAKA
OPTIMIZATION OF MOULDING COMPOSITION FOR
QUALITY IMPROVEMENT OF SAND CASTING
This report is submitted in accordance with the requirement of Universiti Teknikal Malaysia Melaka (UTeM) for
Bachelor’s Degree of Manufacturing Engineering Technology (Product Design) with Honours
by
NG SHU JUAN
B071210036
920426-01-5050
UNIVERSITI TEKNIKAL MALAYSIA MELAKA
BORANG PENGESAHAN STATUS LAPORAN PROJEK SARJANA MUDA
TAJUK: OPTIMIZATION OF MOULDING COMPOSITION FOR QUALITY
IMPROVEMENT OF SAND CASTING
SESI PENGAJIAN: 2015/16 Semester 2
Saya NG SHU JUAN
mengaku membenarkan Laporan PSM ini disimpan di Perpustakaan Universiti Teknikal Malaysia Melaka (UTeM) dengan syarat-syarat kegunaan seperti berikut:
1. Laporan PSM adalah hak milik Universiti Teknikal Malaysia Melaka dan penulis. 2. Perpustakaan Universiti Teknikal Malaysia Melaka dibenarkan membuat salinan
untuk tujuan pengajian sahaja dengan izin penulis.
3. Perpustakaan dibenarkan membuat salinan laporan PSM ini sebagai bahan pertukaran antara institusi pengajian tinggi.
4. **Sila tandakan ( )
SULIT
TERHAD
TIDAK TERHAD
(Mengandungi maklumat yang berdarjah keselamatan atau kepentingan Malaysia sebagaimana yang termaktub dalam AKTA RAHSIA RASMI 1972)
(Mengandungi maklumat TERHAD yang telah ditentukan oleh organisasi/badan di mana penyelidikan dijalankan)
Alamat Tetap:
33, JALAN BISTARI 1/7,
TAMAN YAYASAN,
85010 SEGAMAT, JOHOR.
Tarikh: 18TH DECEMBER 2015
Disahkan oleh:
Cop Rasmi:
i
DECLARATION
I hereby, declare that this thesis entitled “Optimization of Moulding Composition for Quality Improvement of Sand Casting” is the result of my own research except as cited in references.
Signature : ………
Name : ………
ii
APPROVAL
This report is submitted to the Faculty of Engineering Technology of UTeM as one of the requirements for the award of Bachelor’s Degree of Manufacturing Engineering Technology (Product Design) with Honours. The following are the members of supervisory committee:
……… (Supervisor)
iii
DEDICATION
To my parents,
iv
ABSTRAK
Tuangan pasir merupakan proses pembuatan yang digunakan secara luas dalam industri tuangan. Cara tuangan ini adalah sesuai digunakan untuk kebanyakan jenis logam dan pasirnya boleh dikitar semula. Walaubagaimanapun kecacatan dalam hasil tuangan, seperti lubang hembus, lubang pin, susutan dalaman dan keliangan telah menyebabkan ketidaksempurnaan acuan tuangan pasir. Tujuan projek ini adalah untuk mengoptimumkan komposisi pasir silika, tanah liat, air dan serbuk arang batu dengan cara 24 faktorial eksperimen bagi mengurangkan impak kecacatan
produk tuangan. Impak daripada komposisi berlain yang direka pada kebolehtelapan, daya mampatan, daya tegangan dan daya ricih telah dikaji. Analisis yang telah dijalankan dalam perisian Design Expert mengenalpastikan bahawa interaksi antara tanah liat dan air adalah punca utama dalam ketiga-tiga eksperiment berikut. Komposisi spesimen pasir yang optimum, iaitu, 100g pasir silika, 21g tanah liat, 6.5g air dan 6g serbuk arang batu telah dikenalpasti. Nisbah yang dicadangkan bagi jumlah jisim pasir lembap hijau adalah 68: 14: 4: 4. Komposisi ini memberi kebolehtelapan 598.3 GP, daya mampatan sebanyak 26 kN/m2 dan daya ricih
v
ABSTRACT
Sand casting is a versatile and common used manufacturing process in metal casting industry. This method can be used in almost all types of metal and the sand is recyclable. However the defects in casting product such as blowholes, pinholes, shrinkage and porosity cause imperfection in green sand mould. The aim of this project is to optimize the composition of silica sand, bentonite, water and coal dust in green sand to reduce the defects in the casting products using 24 factorial experiment
design method. The effect of composition of green sand on permeability, green compression strength, and shear strength was investigated. Analysis of Design Expert software identified that bentonite and water are the main interaction effect in all the experiments. The optimal settings for green sand composition are 100g silica sand, 21g bentonite, 6.5g water and 6g coal dust, whereby the ratio of their weight contents in a 150g green sand is 68: 14: 4: 4; this composition has an effect of permeability number 598.3 GP, compression strength 26kN/m2 and 20 kN/m2 for
vi
ACKNOWLEDGEMENT
Firstly I would like to express my utmost gratitude and appreciation to my supervisor, Mr. Mohamad Ridzuan, who has guided and encouraged me along this semester. The supervision and supports from him is truly helping the progression of my project. I had been exposed very much in sand casting especially in the role of sand constituent which is very helpful information for the project. Besides I would like to thank my co supervisor, Ms. Rahaini, for her teaching in the design of experiment. This is the most important part for my project whereby the parameter design is all taught by her. With her favour I am able to interpret data analyses from the software.
vii
LIST OF ABBREVATIONS, SYMBOLS AND NOMENCLATURES ... xiv
CHAPTER 1: INTRODUCTION ... 1
1.1 Introduction ... 1
1.2 Problem Statement ... 2
1.3 Objectives ... 2
1.4 Scope ... 2
CHAPTER 2: LITERATURE REVIEW ... 3
2.1 Green Sand ... 3
2.1.1 Silica Sand ... 4
2.1.2 Clay powder (Bentonite) ... 7
2.1.3 Coal dust ... 10
viii
2.2 Permeability ... 12
2.2.1 Experiment of permeability ... 14
2.3 Sand Strength ... 18
2.3.1 Green compression strength ... 18
2.3.2 Green shear strength ... 18
2.3.3 Tensile strength ... 19
2.3.4 Experiment of green sand strength ... 19
2.4 Factorial experiment ... 21
2.4.1 24 design method ... 21
2.5 Green sand casting ... 22
2.6 Defects in sand casting ... 24
2.6.1 Expansion defects ... 24
2.6.2 Adhering sand defects ... 25
2.6.3 Gas defects ... 26
CHAPTER 3: METHODOLOGY ... 28
3.1 Design of Experiment ... 29
3.2 Sand Specimen Preparation ... 32
3.3 Green sand properties tests ... 34
3.1.1 Permeability test ... 34
Green compression strength test ... 36
ix
Tensile Strength ... 39
3.4 Analysis of data ... 40
CHAPTER 4: RESULTS AND DATA ANALYSIS ... 41
Introduction ... 41
Experimental results ... 42
Analysis of Results ... 44
4.3.1 Analysis of Permeability Number ... 45
4.3.2 Analysis Result for Green Compression Strength ... 50
4.3.3 Analysis Result for Shear Strength ... 55
Optimization of Result ... 60
4.4.1 Permeability Number ... 60
4.4.2 Green Compression Strength ... 61
4.4.3 Shear Strength ... 61
Summary of Data ... 62
Discussion ... 63
4.6.1 Introduction ... 63
4.6.2 Permeability Number ... 63
4.6.3 Green compression strength ... 64
4.6.4 Shear strength ... 64
CHAPTER 5: CONCLUSION AND RECOMMENDATION ... 65
x
5.2 Recommendation ... 66
REFERENCES ... 67
APPENDIX - A ... 69
xi
LIST OF TABLES
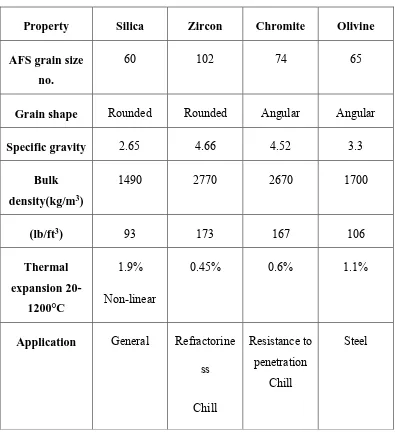
Table 2.1 Properties of non-silica sands (compared with silica) (Brown, 1994) ... 5
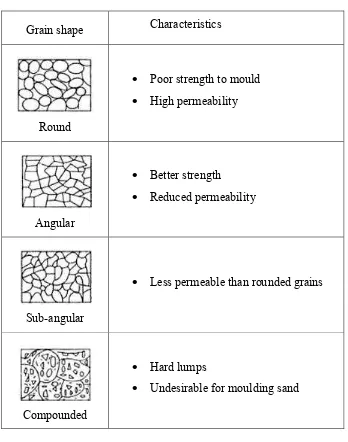
Table 2.2 Classification of grain shape of sand ... 6
Table 2.3 Bentonite comparison chart (Aurora, 2000) ... 9
Table 2.4 Mesh vs. Micron comparison chart (Netafim, 2000) ... 14
Table 2.5 Internal Operation of a Permeability Meter ... 16
Table 2.6 Gas Permeability Table (Simpson, 2008) ... 17
Table 2.7 Analysis Procedure for a 2k Design (Montgomery, 2009) ... 22
Table 2.8 Green sand casting (Black & Kohser, 2013)... 23
Table 3.1 Parameter of the experiment ... 30
Table 3.2 Parameter level for 16 runs ... 30
Table 3.3 Parameter value for 16 runs ... 31
Table 3.4 Experimental Result for permeability number ... 35
Table 3.5 Green compression strength ... 37
Table 3.6 Shear strength ... 38
Table 3.7 Tensile strength ... 39
Table 4.1 Experimental result of permeability test ... 42
Table 4.2 Experimental results for green compression strength ... 43
Table 4.3 ANOVA of Permeability Number ... 49
Table 4.4 ANOVA for Green Compression Strength ... 54
Table 4.5 ANOVA for Shear Strength ... 59
Table 4.6 Selected Optimal Setting of Parameter ... 60
xii
LIST OF FIGURES
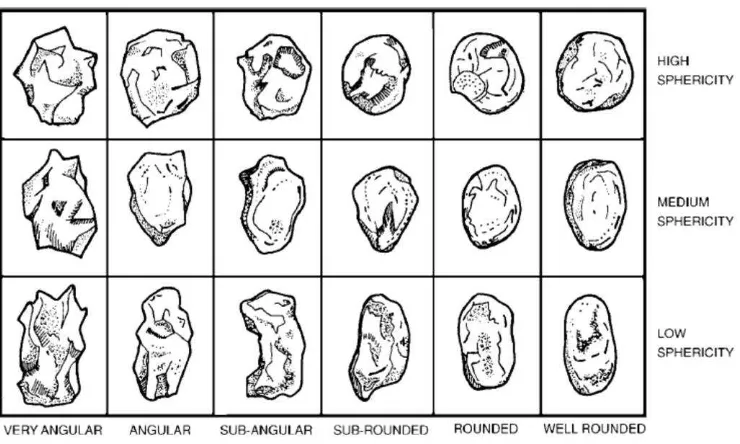
Figure 2.1 Classification of grain shapes (Altan, 2001)... 7
Figure 2.2 Influence of bentonite content in green sand strength (Aramide, 2011) ... 7
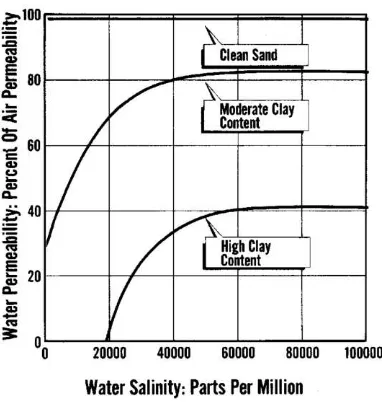
Figure 2.3 Variation in water permeability with salinity and clay content (CoreLab, 1983) ... 8
Figure 2.4 Comparison of layer of particle between sodium and calcium bentonite (Ratchasima, 2011) ... 9
Figure 2.5 Influence of moisture content and clay on permeability (Webster, 1980) . 11 Figure 2.6 Textual parameter and permeability (Link, 1982) ... 12
Figure 2.7 Sectional View of Permeability Meter ... 15
Figure 2.8 Dog bone shape specimens mould ... 19
Figure 2.9 Universal Sand Strength Machine (Motor Driven) ... 20
Figure 2.10 Lower hole at the pusher arm to hold sand specimen ... 20
Figure 2.11 Tensile Core Strength Accessory... 20
Figure 2.12 Illustration of features in sand mould (Kaushish, 2010)... 23
Figure 2.13 Rattail which caused by expansion (Kay, et al, 2001) ... 24
Figure 2.141 Buckles which caused by weak wet layer in mould (Kay, et al, 2001) .. 25
Figure 2.15 Scab formed when metal run through the crack into the sand from buckle (Kay, et al, 2001) ... 25
Figure 2.16 Burn on defect (IKO, S&B Industrial Minerals, 2012) ... 26
Figure 2.17 Blow holes defect (IKO, S&B Industrial Minerals, 2012) ... 27
Figure 2.18 Pinholes defect (IKO, S&B Industrial Minerals, 2012) ... 27
Figure 3.1 Flow chart of methodology ... 28
xiii
Figure 3.3 Simpson Analytical Balance Model 42137 ... 32
Figure 3.4 Simpson Sand Rammer... 33
Figure 3.5 Stripping post, ramming base and specimen tube ... 33
Figure 3.6 Simpson Permeability meter ... 35
Figure 3.7 Ridsdale-Dietert Universal Sand Strength testing machine... 36
Figure 3.8 Green compression strength test accessory ... 36
Figure 4.1 Specimen for tensile test cracked once the mould is opened... 41
Figure 4.2 Cracked Specimen ... 41
Figure 4.3 Scale of USSM ... 44
Figure 4.4 Half-Normal Plot for Permeability Number ... 45
Figure 4.5 Pareto Chart for Permeability Number ... 46
Figure 4.6 Residual vs. Predicted Graph for Permeability Number ... 46
Figure 4.8 Interaction Effect Plot for Permeability Number... 48
Figure 4.9 Half-Normal Plot for Green Compression Strength ... 50
Figure 4.10 Pareto Chart for Green Compression Strength ... 51
Figure 4.11 Residuals vs. Predicted Graph for Green Compression Strength ... 51
Figure 4.12 One Factor Effect Plot for Green Compression Strength ... 52
Figure 4.13 Interaction Effect Plot for Green Compression Strength ... 53
Figure 4.14 Half-Normal Plot for Shear Strength ... 55
Figure 4.15 Pareto Chart for Shear Strength ... 56
Figure 4.16 Residual vs. Predicted Plot for Shear strength... 56
Figure 4.17 One Factor Effect Plot for Shear Strength ... 57
xiv
LIST OF ABBREVATIONS, SYMBOLS AND
NOMENCLATURES
SiO2 - Silicon Dioxide
AFS - American Foundry Society
Ca - Carbon
Na - Sodium
CO2 - Carbon Dioxide
USSM - Universal Sand Strength Machine
1
CHAPTER 1
INTRODUCTION
1.1 Introduction
2
1.2 Problem Statement
From the combination of silica sand, coal powder, clay powder (bentonite) and water, each of them plays an important role respectively to reduce and control defects in castings. Defects may occur when any one of the component is out of the optimum value. First of all, the common defect is blowhole, which is happened when the gas is trapped in the metal during solidification. Besides the permeability will be decreasing as the grain size is decreasing. In another words, finer sands will decrease the permeability value. Water helps to hold the clay together and hence produce the strength of sand mould. The value is depending on the proportion of clay, it is a compulsory to achieve an optimum value of water to avoid the clay becomes too soft and loses the bonding.
1.3 Objectives
i. To evaluate the performance of green sand specimens with different composition on permeability, compression strength and shear strength.
ii. To investigate the optimum value of bentonite with respect to the amount of water.
iii. To establish the mathematical model for permeability, green compression strength and shear strength.
iv. To optimize the best composition of green sand to minimize the occurrence of defects.
1.4 Scope
i. Ratio of water to clay is started at 1:3.
ii. Green compression strength is to achieve 30-160 kPa. iii. Green shear strength is to achieve 10-50 kPa.
3
CHAPTER 2
LITERATURE REVIEW
2.1 Green Sand
Green sand is a combination of silica sand, clay powder, coal dust and water. It is also known as tempered sand. Due to the moisture content in the sand, it is known as green sand whereby the word “green” is representing the mould, which is tempered with water, is not dried or baked (Walton et al, 1981). A typical green sand mixture contains about 85% silica sand, 9% clay, 3% water and 3% organic additives (Seidu & Kutelu, 2014). However natural sand contains silica sand, clay substances and water, they can be founded easily from natural resources like deserts, seas, lakes or rivers. Another typical composition of green sand is made up of 50 to 60% of natural sand from rivers, 12 to 15% of clay, 5 to 15% coal dust and 4 to 6% water.
The sand will undergo a “mulling” process whereby the clay acts as a binder in the sand, which will produce a suitable composition for sand moulding process. This sand mixture is first compressed around the pattern at specific pressures and temperatures to ensure it will maintain its shape of the casting process required. The sand is compact around the pattern, which is following the desired casting. In general, the moulding pressure is about 7 to 40 kg/cm2 and the mould is required to have a
4
2.1.1 Silica Sand
Silica sand is used primarily because it is readily available and inexpensive. Silica sands (silicon dioxide, SiO2) are very refractory and usually contain a small
amount of organic component. The silicon oxide is characterized by having very high softening temperature and thus having high thermal stability. The grains of silica sand will not melt and fuse together easily, they will not split into smaller particles when they contact with molten metal (Johnson, 1984).
5
Table 2.1 Properties of non-silica sands (compared with silica) (Brown, 1994)
Property Silica Zircon Chromite Olivine
AFS grain size
no.
60 102 74 65
Grain shape Rounded Rounded Angular Angular
6
Table 2.2 Classification of grain shape of sand
Grain shape Characteristics
Round
Poor strength to mould
High permeability
Angular
Better strength
Reduced permeability
Sub-angular
Less permeable than rounded grains
Compounded
Hard lumps
7
Figure 2.1 Classification of grain shapes (Altan, 2001)
2.1.2 Clay powder (Bentonite)
Bentonite acts as a binder in green sand, it gives cohesiveness and strength to the sand to maintain the shape of mould cavity after the pattern is removed. Generally bentonite fits the water molecules between the layers which cause the inner structural water. By increasing the weight percentage of clay, it will increase the strength, hardness and toughness of sand but flow ability and permeability of sand are also reduced. However the moisture content of green sand is extremely decisive on nearly all physical properties in foundry. Figure 2.2 shows how the influence of bentonite content in green sand is to its strength.
8
Figure 2.3 Variation in water permeability with salinity and clay content (CoreLab, 1983)
There are two types of bentonite, Calcium (Ca-type) and Sodium (Na-type) bentonite. Na-type bentonite able to expand to a greater size of 10 to 20 times its original by absorbing moisture and then swelling, therefore it has a greater state of disaggregation, and hence larger surface area of the particles in mould sand is developed. Besides, Na-type bentonite has a higher fire resistance that prevents cutting and erosion of mould when molten metal passes over it. However, Na-type is slow in hydration speed. It is dispersed in the moulding sand in heterogeneous suspended state and it takes a long time to obtain a uniform green strength. Therefore, the sand must not be too soft. Ca-type bentonites have higher property as bonding agents in moulding sand. Among the mineral binders, considering the small amount of bentonite to implement optimum strength, Ca-type bentonite has higher green compression strength and permeability.