DOI: 10.12928/TELKOMNIKA.v13i1.1319 164
A Detection Method for Transmission Line Insulators
Based on an Improved FCM Algorithm
BoWen Wang1*, Quan Gu2 1
Electrical Engineering College, Northeast Dianli University, Jinlin, 132012, China
2
School of Computing Science, University of Glasgow, Glasgow, G12 8QQ, United Kingdom e-mail: [email protected]1, [email protected]2
Abstract
An improved segmentation Fuzzy C-Means algorithm (FCM) is proposed for the image recognition of transmission line insulators. In this paper, the improved Wiener filter algorithm is firstly used to filtrate and recover image in pre-processing. Then, the insulator image is segmented based on the improved algorithm FCM. Finally, the contour of insulator is labelled by using connected component labelling algorithm. Experimental results have shown that the improved Wiener filtering algorithm may effectively filter and recover the images; furthermore, the improved FCM image segmentation algorithm may accurately segment insulators from the image.
Keywords: insulator, wiener filtering, FCM, connected component labelling
1. Introduction
Since the power industry has been playing a key role in the industrialized world by providing power sources, it is very important to maintain power transmission lines without a failure, and an insulator failure has been known as one of the main causes of the power failure [1]. An insulator is the key portion of high voltage transmission line, whose performance directly influences the operation safety of the entire transmission line. Most transmission lines and insulators are exposed in the outdoor environment, and suffering from snow, rain, lightning strike for a long time. [2]-[4]. Therefore, Regular inspection of transmission lines and the insulators is an important work, [5]-[7].
Unlike the traditional manual line inspection methods of transmission lines, a helicopter line inspection mitigates the damage to ground vegetation, and lowers both the labor and danger inherent in traditional manual ground inspections. This method improves the inspection quality and efficiency characterized by a flexible inspection mode. It takes less time to gain an image, and is free from the restrictions imposed by the geographical environment [8]-[9]. Image detection is used for transmission line based on the aerial photography technology [10]-[11]. This method mitigates the defects that occur from manual detection, improves both the working efficiency and accuracy as well as guarantees inspection quality; additionally, it improves the safety of transmission line inspection and reduces the probability of accidents or emergencies [12]. In addition, aerial photography technology provides the basis for unmanned aerial vehicle (UAV) inspection technology and provides a theoretical method within the aspects of UAV navigation and flight condition monitoring [13]-[15].
uses an improved gradient edge detection method to extract insulators from a transmission line, while not conforming to the requirements for a complex background. The high voltage line feature extraction method based on wavelet images, which have been presented in reference [19], utilizes the features of wavelet theory, extracting a high voltage transmission line to obtain the positions of a high voltage line and insulators according to feature matching. Given that the algorithm is complex and the calculation period is long, the algorithm may meet low pixel inspection image detection. References [20],[21] provide an overview for the national high voltage insulator online detection method and also represent the detection principles, detection equipment, advantages and disadvantages of the existing methods. The references have analyzed the voltage distribution method, the leakage current detection method, the pulse current detection method and the infrared temperature measurement method in contacting methods according to the physical characteristics of the insulator defect leakage current. The disadvantages to this method are high labor strength, low safety, poor efficiency, susceptibility to electromagnetic interference, possibility of false detection or leakage detection, and a susceptibility to environmental elements (temperature, humidity, etc.). Reference [22] presents an extraction algorithm for an Insulator image using helicopter aerial photos. The algorithm in question segments images using the maximum entropy threshold based on the genetic algorithm; it filters noise in segmented images with a dual-structural filter and finally identifies the insulator serial outline using an identification method in the connected area. The algorithm may completely extract insulator images from the aerial photos on a simple background. The robustness of the algorithm is to be improved upon when dealing with a complex background.
In this paper, A novel detection method is proposed for aerial transmission line inspection images, the first step is to reprocess the spatial switching of aerial photo color and images; the second is to segment aerial photos based on an improved FCM algorithm; finally, the use of identification in the connected area to identify the outline of an insulator in the images.
2. Image reprocessing
The experiment proves that the effect is poor when directly switching the colour image to a grey-scale map and then segmenting the insulator images. The process switches the RGB space of the colour image to the HSI space, H denotes Hue, S denotes Saturation, and I denotes Intensity. The switching process is shown as follows:
2
The HSI space model is close to people's visual perception about colour; three components lack correlation, where the H component is insensitive to ray and shadow and the S component has an effect on the imaging object along with changes in light intensity. As such, the model is able to distinguish the objects in different colours.
A vast number of experiments have proven that the value of the S component is smaller when the ray of light is stronger concurrent with changes in light intensity; consequently, the S component is selected as a grey-scale map of the image segmentation and transferred to the pixel space [0, 255].
restoring the original image. This paper uses an improved Wiener filtering algorithm to restore images.
Wiener filtering requires a minimum mean square error between the input imageI i j( , ) and the restoring imageR i j( , ). Assuming the image signal approximates stable random process, it shall meet:
2
min( ([ ( , ) ( , )] ))
W E I x y R x y (4)
Where E( ) is a mathematical expectation. The expression of the spatial domain for Wiener filtering is shown as follow:
'
Where E is the mathematical expectation in the neighbourhood of point (x, y); D is the variance yield in the neighbourhood of point (x, y); andD' is the variance yield of noise.
E, D and f x y( , ) are known in expression (5). It is necessary to estimate the noise variance '
D for the input image. Achieving this and determining the size of the template in the aerial photos is a difficult process. The complex area of the images will be fuzzy if the template is too large; however, if the template is too small the effect of noise reduction will be undesirable. Therefore, a type of improved Wiener filtering algorithm is presented. The proposed algorithm is shown as follows:
1) Use the Sobel Operator to filter input images, and the edge and non-edge will be obtained.
2) Build a neighbourhood estimate of noise variance D' in a non-edge. Supposing DNE is a local variance of point (x, y), build a local variance in a 5 5 neighbourhood area of point (x, y). When all points in the neighbourhood are within the area, it is not necessary to calibrate; if some points in the neighbourhood are not in the area, the point is calibrated as noise.
3) Calculate the noise varianceDNE' , the formula is shown as follow:
( , )
Where R is the point set of the current non-edge; S is the number of pixels.
3. Image segmentation based on an improved fuzzy c-means algorithm
A fuzzy c-means algorithm (FCM)is a widely-used image segmentation method. The method obtains the membership of each sample point for all class centres through the objective function and determines the affiliation of sample points to automatically classify the data sample. FCM may prevent the problems that occur in threshold settings. The characteristics of FCM are suitable for the uncertainty and fuzziness existing in images. The FCM algorithm also belongs to a type of unsupervised classification method; a cluster process needs no manual intervention and is applicable to multiple application fields for automatic image segmentation.
Principle of a traditional FCM algorithm: suppose sample set X
x x1, 2,,xn
belongs to the p-dimension Euclidean space, pi
x R ,i1, 2,,n. First, classify sample set X into different classes: c mutually disjoints subsetsV
v v1, 2,,vc
; c is the number of classes. Each2 images; c is the preset number of classes, meeting 1<c≤n; V is the p×c cluster center matrix; and uij expresses whether sample xj is in the class i of the cluster, namely, the membership of sample xj tovi. The value of uij is 0 or 1, so U is a 0-1 matrix of c×n and meets the constraint
v R .Under the constraint conditions, update U to obtain:
2 1J U V expresses the quadratic sum of the weighting distance from the sample to the
cluster center. The value reflects the consistency degree of the classes in the definition of specific differences. The cluster is more compact if J U V( , ) is smaller. The algorithm updates U and V through iteration and alternation. When two periods of nearby iterations meet
( )t (t 1)
V V , the iteration will stop, where t is the number of iteration times and is the preset convergence threshold value. Then, the objective function will reach a minimum.
The FCM algorithm attracts each sample in the cluster center but at a slower rate of convergence. To solve these problems, the paper presents a type of FCM algorithm correction
ij
u to improve the rate of convergence of the cluster center.
0
E is the set of all non-edge points in an image; E1 is the set of all edge points.
First, divide the non-edge area into mutually disjointed block. Next, divide the edge points into nearby block, forming mutually disjointed and continuous subclasses and preliminarily segmenting images, thus obtaining c mutually disjointed subclasses. (0)
2 1The cluster center update equation (12) is modified as follow:
1 0 1 0
When xjE1 (edge point), the calculation equation is consistent with the general FCM; when xjE0 (non-edge point), the membership will not change, no matter how it is iterated, without the need for recalculation. Therefore, it shall recalculate and determine the edge block.
FCM only applies the grey features of an image when segmenting the image, without considering the spatial features of a pixel. This paper utilizes the Markov Random Field (MRF) to segment a secondary image. Importing the MRF and Gibbs random field distribution improves the prior probability pixel distribution; because the MRF and Gibbs random field have parity, the MRF may be expressed by one Gibbs distribution. The probability of the pixel i belonging to the class i may be shown as follow:
( ) exp[ ( )] [ ( )]
Next, utilize the prior probability pij provided by the Gibbs model, the probability value
of the pixel i belonging to the class j. Membership uij may be updated as(1 p uij) ij, where
controls the weight factor; the value will increase along with the noise in the images, and the scope is0 1. Formula (13) may be updated as:
The procedures of an improved FCM algorithm are listed as follows: 1) Calculate the set of marginal points and non-edgepoints. 2) Input ( )t
U into the following equation to calculate the C-cluster center matrix ( )t V , t=0;
initialize other parameters, including the value of iteration parameter and Markov factor. 3) Utilize equation (11) to update ( )t
U and (t 1)
U ; calculate (t 1)
V based on (t 1)
U ; the first time of iteration uses FCM to classify preliminarily.
4) Utilize equation (13) to calculate the prior local probabilityPij.
5) Input the prior local probability Pij into equation (14); use equation (14) and (12) to
calculate the membership matrix ( )t
U and cluster centre ( )t
V .
6) Choose a proper matrix norm to compare ( )t
V and (t 1)
V ; if V( )t V(t1) , stop
In order to identify the insulator outline, it is necessary to use identifications in the connected area. The specific steps are shown as follows: the insulator area will be obtained after image segmentation; use the identifications in the connected area to identify the insulator outline, specifically labelling the insulator edge, using the 8-neighbourhood method. Assume the target is white, the value is 255, the background is black and the value is 0. First, completely scan the binary image and label all target pixels, and then label each pixel in an 8-connected area; compare eight neighborhood pixels, including the upper surface, lower surface, left, right, upper left, upper right, lower right and lower left. Finally, label the comparative results. Specially process the pixels without the eight nearby pixels.
Finally, through the parallelogram rule [22], the position of the insulator can be accurately detected according to its features.
4. Experimental results
For this experiment, two groups of images in the insulator image libratory in the matlab 7.4 platform were randomly chosen, including 30 images in each group (size: 128×160). Some images possessed a certain amount of noise.
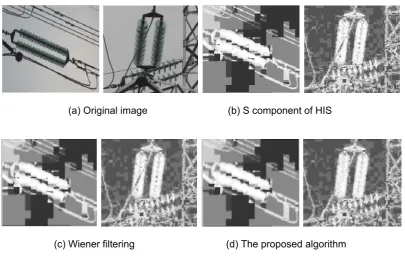
Experiment 1 shows the result of image processing. We randomly selected an image from two groups of the image library. The experimental results are shown in figure 1. Figure1 (a) is the original image; Figure 1 (b) is the result of extracting the S component after switching from the RGB space to the HSI space. The S component is within the scope of 0-255. Figure1 (b) shows a prominent insulator area within the S component image and a higher saturability in the images, so the objects can be distinguished by different colours; Figure 1(c) is the result of Wiener filtration of the S component, restoring the image; and Figure 1 (d) is the result of improved Wiener filtration. The results show that the differences within a small scope will be smoothened, utilizing the algorithms presented in the paper.
(a) Original image (b) S component of HIS
(c) Wiener filtering (d) The proposed algorithm
Figure 1. The results of the image pre-processing
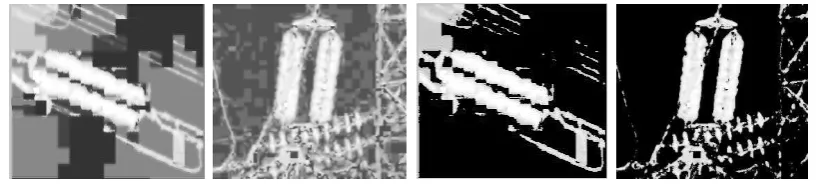
number of c classes is three, the cluster centre is (40, 120, 200), the condition stopping iteration is 0.0001 and the maximum number of iteration times is 100.
As shown in Figure 2(b), a traditional FCM algorithm was utilized to segment the insulator area. Some noise points or the small area including fewer points were not restrained. As shown in Figure 2(c), the FCM algorithm presented in this paper was utilized to segment images. The Markov random field was utilized to secondarily segment images, and had the potential to restrain noise and a smaller area. Figure 2(d) is the recognition result. The red line has been used to label the insulator outline.
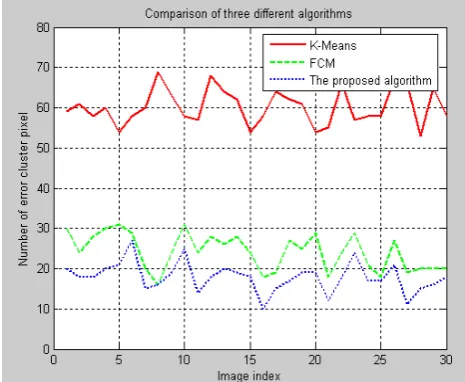
Experiment 3 is the segmentation effect using the image segmentation algorithm. The experimental results are shown in Figure 3. For the experiment, two groups of 30 images were chosen from the insulator image library. We chose the widely used K-Means algorithm, FCM algorithm and algorithms presented in the paper to compare. Compared to the FCM algorithm, the K-Means algorithm is faster in calculating separation times. The horizontal axis indicates the number of pixels, and the vertical axis indicates the number of wrong pixels for the image segmentation algorithm. The K-Means algorithm involves more error cluster pixels, while the FCM algorithm involves less. The algorithms presented in this paper have a good segmentation effect, effectively reducing the number of error cluster pixels.
(a) The pre-processed image (b) The FCM algorithm
(c) The proposed algorithm (d) The region label Result
Figure 3. The comparison results of three different algorithms
5. Conclusions
This paper presents an image recognition method of transmission line insulators based on an Improved FCM Algorithm. During the pre-processing stage, an improved Wiener filtering algorithm was presented to filter and restore the images. During the image segmentation stage, an improved FCM image segmentation algorithm was also presented. Finally, identifications were utilized in connected areas to identify the insulator’s outline. The experimental results showed that the improved Wiener filtering algorithm may effectively filter and restore images, and the improved FCM image segmentation algorithm can segment insulators from images and effectively reduce number of error cluster pixels. The next step of this research is to improve the segmentation time of the FCM algorithm.
Acknowledgement
This work was supported in part by the Scientific and Technological Planning Project of Jilin Province (20100565), the Scientific Research Fund of Jilin Provincial Education (20120307), the Scientific and Technological Planning Project of Jilin Province (20120332), the Scientific Research Fund of Jilin Provincial Education (2013434) and the Jilin province development and Reform Commission projects (2013C048).
References
[1] Zhu H, Li WG, Lin Y. Present and future development of detection methods for composite insulator.
Insulators and Surge Arresters. 2006; 8(1): 133-137.
[2] Qaddoumi NN, El-Hag AH, Saker Y. Outdoor Insulators Testing Using Artificial Neural Network-Based Near-Field Microwave Technique. IEEE Transactions on Instrumentation and Measurement. 2013; 63(2): 260-266.
[3] Buxton B, Bemard F, Abdallahi A, Houari FR, Delmiro J. Development of an Extension of the Otsu Algorithm for Multidimensional Image Segmentation of Thin-Film Blood Slides. International
Conference on Computing: Theory and Applications. 2007; 1(1): 552-562.
[4] Chen SY, Song SF, Li LX. Survey on smart grid technology. Power System Technology. 2009; 33(8): 1-7.
[5] Hassanpour R, Shahbahrami A, Wang S. A daptive gaussian mixture model for skin color. Proceedings of World Academy of Science, Engineering and Technology. 2008; 31: 1-6.
[6] Lu GQ, Xu HG, Li YB. Line detection based on chain code detection. IEEE International Conference on Vehicular Electronics and Safety. 2005; 1: 98-103.
[7] Jou F, Fan KC, Chang YL. Efficient matching of large-size histograms. Pattern Recognition Letters. 2004; 25(3): 277-286.
[8] Rolland JP, Vo V, Bloss B. Fast algorithms for histogram matching: Application to texture synthesis.
[9] Morovic J, Shaw J, Sun PL. A fast, non-iterative and exact histogram matching algorithm. Pattern
Recognition Letters. 2002; 23(3): 127-135.
[10] Jahne B. Digital Image Processing Concepts. Algorithms and Scientific Applications. Springer, 1997; 1: 236-242.
[11] Liu XH, Guo C, An H. A modified wiener filtering for restoration of ring-coded aperture images in inertial confinement fusion. Acta Optica Sinica. 2004; 24(8): 1045-1050.
[12] Tapas K, David M, Mount NS, Netanyahu CD, Piatko RS, Angela YW. An Efficient k-Means Clustering Algorithm: Analysis and Implementation. IEEE Transactions on Pattern Analysis and
Machine Intelligence. 2002; 24(7): 881-892.
[13] Bharat P, Durga T. Improved K-Medoids Clustering Based on Cluster Validity Index and Object
Density. IEEE 2nd International Advance Computing Conference. 2010; 1: 379-384.
[14] Dameng D, Dejun M. A Fast Approach to K-means Clustering for Time Series Based on Symbolic Representation. International Journal of Advancements in Computing Technology. 2012; 4(5): 233-239.
[15] Chen JJ, Song A, Zhang W. Hybrid Clustering Methods Based on Adaptive K-harmonic Means.
International Journal of Advancements in Computing Technology. 2012; 4(6): 10-23.
[16] Li ZR, Liu Y, Hayward R. Knowledge based power line detection for UAV surveillance and inspection
systems. Proceedings of International Conference on Image and Vision Computing, 2008; 1: 1-6.
[17] Katrasnik J, Pernus F, Likar B. A survey of mobile robots for distribution power line inspection. IEEE
Transactions on Power Delivery, 2010; 25(1): 485-493.
[18] Basu M. An improved SUSAN edge detection scale invariable features algorithm-a survey. IEEE
Transactions on System, Man and Cybernatics. 2002; 32(3): 252 -260.
[19] Sarabandi M, Park M. Extraction of power line maps from millimeter-wave polarimetric SAR images.
IEEE Trans. Antennas Propag. 2000; 48(2): 1802–1809.
[20] Wang X. An insulator online detecting Method summary. Porcelain Arrester. 2002; 14(6): 34-39. [21] Huang XN, Zhang ZL. An extraction algorithm for insulators Patrol helicopter aerial image. Grid
technology. 2010; 34(1):194-197.