The Relation of Adiposity to Cognitive Control and Scholastic
Achievement in Preadolescent Children
Keita Kamijo1, Naiman A. Khan1, Matthew B. Pontifex1, Mark R. Scudder1, Eric S.
Drollette1, Lauren B. Raine1, Ellen M. Evans2, Darla M. Castelli3, and Charles H. Hillman1 1Department of Kinesiology and Community Health, University of Illinois at Urbana-Champaign 2Department of Kinesiology, University of Georgia at Austin
3Department of Kinesiology and Health Education, University of Texas at Austin
Abstract
Adiposity may be negatively associated with cognitive function in children. However, the findings remain controversial, in part due to the multifaceted nature of cognition and perhaps the lack of accurate assessment of adiposity. The aim of this study was to clarify the relation of weight status to cognition in preadolescent children using a comprehensive assessment of cognitive control, academic achievement, and measures of adiposity. Preadolescent children between 7 and 9 years (n = 126) completed Go and NoGo tasks, as well as the Wide Range Achievement Test 3rd edition (WRAT3), which measures achievement in reading, spelling, and arithmetic. In addition to body mass index (BMI), fat mass was measured using dual X-ray absorptiometry (DXA). Data were analyzed with multiple regression analysis, controlling for confounding variables. Analyses revealed that BMI and fat mass measured via DXA were negatively associated with cognitive control, as children with higher BMI and fat mass exhibited poorer performance on the NoGo task requiring extensive amounts of inhibitory control. By contrast, no relation of weight status to performance was observed for the Go task requiring smaller amounts of cognitive control. Higher BMI and fat mass were also associated with lower academic achievement scores assessed on the WRAT3. These data suggest that adiposity is negatively and selectively associated with cognitive control in preadolescent children. Given that cognitive control has been implicated in academic achievement, the present study provides an empirical basis for the negative relationship between adiposity and scholastic performance.
INTRODUCTION
Over the last three decades, the prevalence of childhood obesity has tripled in the United States, and 35.5% of preadolescent children now are considered overweight or obese (1,2). Such a trend has been related to greater incidence of ill health among children, in part due to associated chronic diseases (e.g., type 2 diabetes and cardiovascular disease). Additionally, being overweight in childhood has implications for obesity in adulthood (3), and recent estimates have suggested that younger generations may lead shorter and less healthy lives than their parents, marking the first time in U.S. history that such a trend has occurred (4,5). Further, recent studies have indicated that body mass index (BMI) is inversely associated
Corresponding author Charles H. Hillman, Ph.D. Department of Kinesiology and Community Health, University of Illinois at Urbana-Champaign 317 Louise Freer Hall, 906 South Goodwin Avenue, Urbana, IL 61801 Phone: 217- 244-2663 Fax: 217-244-7322
NIH Public Access
Author Manuscript
Obesity (Silver Spring)
. Author manuscript; available in PMC 2013 June 01.Published in final edited form as:
Obesity (Silver Spring). 2012 December ; 20(12): 2406–2411. doi:10.1038/oby.2012.112.
$watermark-text
$watermark-text
with academic achievement (6–9), suggesting that weight status may be associated with not only chronic diseases, but also with cognitive development and brain health.
Although several studies have attempted to elucidate the relationship between BMI and cognitive function in children, the findings remain controversial. For example, Li and colleagues (10) indicated that higher BMI was associated with poorer cognitive performance on the block design test (i.e., a test of visuospatial-constructional ability) and digit span forward and backward (i.e., a test of working memory) in children 8–16 years. By contrast, Gunstad et al. (11) used several cognitive tasks such as the digit span backward, Trail Making Test B (i.e., a test of cognitive flexibility), and verbal recall (i.e., a test of memory), and indicated no relationship between BMI and scores on all cognitive tasks in children 6– 19 years. Thus, the relationship between BMI and cognition remains an open question. However, given that BMI has consistently shown to be negatively associated with academic achievement (6–9), it stands to reason that a similar negative relationship should be
observed on aspects of cognition that mediate and support academic achievement. Accordingly, an initial step in understanding the relation of weight status to academic achievement is to examine cognitive control, which has been heavily implicated in academic achievement (12–14).
The term cognitive control (i.e., also referred to as “executive control”) describes a subset of goal-directed cognitive operations concerned with the selection, scheduling, and
coordination of computational processes underlying perception, memory, and action (15,16). The core cognitive processes, which are collectively termed `cognitive control' include inhibition (i.e., the ability to suppress task irrelevant information in the stimulus environment, or stop an ongoing response), working memory (i.e., the ability to hold information in one's mind and manipulate it), and cognitive flexibility (i.e., the ability to switch perspectives, attention, or response mappings (17)). These aspects of cognition provide the foundation for academic abilities such as reading comprehension and mathematical problem solving (12–14). It is well known that the prefrontal cortex, which plays a crucial role in the effective regulation of cognitive control (18), has demonstrated protracted development relative to other regions of the brain during normal maturation (19). Further, recent neuroimaging studies have indicated that BMI is negatively correlated with gray matter volume in brain regions that have been implicated in the support of cognitive control such as the prefrontal cortex (20–22). Thus, these neuroimaging studies imply that BMI may be negatively associated with specific cognitive processes (i.e., cognitive control) supported by these brain regions, especially due to the protracted development of these structures during maturation (19). Given that cognitive control has been shown to associate with academic achievement (12–14), this assumption accords with the previous findings indicating a negative relationship between BMI and academic achievement (6–9).
To elucidate the relationship between BMI and cognitive control, task selection must carefully manipulate cognitive control demands to best determine the selective nature of the relationship between weight status and cognition. Although previous studies investigating this relationship have used cognitive control tasks that tap working memory (10,11), no such work has examined the relation of weight status to inhibition. Given that inhibitory control, as well as working memory, has been closely associated with academic achievement (12– 14), it is important to elucidate this relationship. In this study, we used the Go-NoGo task to manipulate demands on inhibitory aspects of cognitive control. The Go task required participants to respond to rare stimuli amid a train of frequent stimuli, whereas the NoGo task had participants respond to frequent stimuli, while withholding their response to rare stimuli. That is, although both the Go and NoGo tasks require attention to detect the rare stimuli, the NoGo task requires greater amounts of cognitive control to inhibit the prepotent response on infrequent stimulus trials. Thus, given that the Go-NoGo task allows for the
$watermark-text
$watermark-text
manipulation of cognitive control demands based on the response requirements, this task affords the opportunity to elucidate the specific association between BMI and inhibitory aspects of cognitive control.
Beyond describing the relationship between BMI and cognition, a second purpose of our study was to specifically relate adiposity to cognitive performance. The height and weight relationship varies dramatically during growth and development, therefore, BMI is only an indicator and not an actual measure of adiposity. Given that the above-mentioned studies (10,11) only used BMI as a surrogate measure of adiposity, the contradictory findings observed, in part, may be due to a lack of rigor in the assessment of adiposity. Thus, more accurate measures of adiposity are warranted in the investigation of weight status to cognitive performance. Accordingly, we investigated this aim using dual energy X-ray absorptiometry (DXA) to provide measures of whole body and central adiposity. Collectively, our study aimed to clarify the relation of weight status and adiposity to cognition in preadolescent children using a comprehensive assessment of cognitive control, academic achievement, and measures of adiposity. Based on the previous findings, we predicted that higher BMI and adiposity would be associated with lower academic achievement scores and poorer performance on a task of inhibitory control. Further, we predicted that the negative relationship between weight status and task performance would appear disproportionately greater for the NoGo condition of the task requiring greater amounts of cognitive control. Lastly, we predicted that the expected negative relation of weight status to academic achievement and cognitive control would be greater for more accurate measures of adiposity via DXA compared to BMI.
METHODS AND PROCEDURES
Participants
Preadolescent children between 7 and 9 years of age were recruited from the Urbana, Illinois community. One hundred seventy-two children completed the Go-NoGo task and underwent an assessment of body composition and aerobic fitness (to control this potentially
confounding variable, for review see ref. (23)). Thirty-six participants were excluded from analyses due to either (i) high scores on the ADHD Rating Scale IV (≥ 90th percentile; 27 participants (24)), (ii) missing demographics data (1 participant), (iii) underweight (< 5th percentile; 2 participants (25)), or (iv) failing to meet criteria for maximal oxygen
consumption (VO2max, 6 participants). Further, 10 participants were excluded because they exhibited outlying values (±3 s.d.) on any of the dependent variables. Thus, analyses were conducted on 126 participants (59 Caucasian, 32 African-American, 18 Asian, 17 bi-racial or of other ethnicities)a. Based on the Centers for Disease Control and Prevention BMI-for-age growth charts (25), 44.4% of children were overweight or obese (see Table 1 for participants' demographics) which mirrors the overweight and obesity rates among U.S. children (1). It has also been suggested that a standardized BMI (zBMI) score ≥ 1 is a good indicator of excess adiposity (26). In our sample, female mean zBMI was 1.2 while mean zBMI for males was 1.0 with 39% of children with a zBMI ≥ 1. Prior to testing, legal guardians reported that their child was free of neurological diseases or physical disabilities, and indicated normal or corrected-to-normal vision. Participants and their legal guardians provided written informed assent/consent in accordance with the Institutional Review Board at the University of Illinois.
Laboratory procedure
The experimental protocol occurred over two separate days for each participant. On the first visit to the laboratory, informed assent/consent was obtained, participants completed the Wide Range Achievement Test 3rd edition (WRAT3; Wide Range, Inc., Wilmington, DE,
$watermark-text
$watermark-text
USA) to assess academic achievement, the Kaufman Brief Intelligence Test (K-BIT (27)) to assess intelligence quotient (IQ), and had their height and weight measured. Concurrently, for screening purpose, participants' legal guardians completed a health history and
demographics questionnaire, and the ADHD Rating Scale IV (24). Further, given that it has been well known that socioeconomic status (SES) is associated with cognitive control (28) and adiposity (29), an SES questionnaire was also included to control this potentially confounding variable during analysis. SES was determined by creating a trichotomous index based on: (i) participation in free or reduced-price meal program at school, (ii) the highest level of education obtained by the mother and father, and (iii) number of parents who worked full-time (30). After completing all questionnaires, a graded exercise test on a motorized treadmill was performed to assess aerobic fitness. On the second visit, participants completed the Go-NoGo task in a sound-attenuated room and the DXA measurement was performed.
Weight status and body composition assessment
Standing height and weight measurements were completed with participants wearing light-weight clothing and no shoes. Height and light-weight were measured using a stadiometer and a Tanita WB-300 Plus digital scale, respectively. BMI was calculated by dividing body mass (kg) by height (m) squared [(kg)/ht(m)2]. Whole-body and regional soft tissue composition was measured by DXA using a Hologic Discovery A bone densitometer (software version 12.7.3; Hologic Inc., Bedford, MA, USA). DXA analysis allows isolation of specific regions of interest (ROI), and abdominal fat mass was quantified as a region from L1–L4 to provide a proxy for central adiposity. Precision for DXA measurements of interest are ~ 1–1.5% in our laboratory.
Assessment of cognitive control
To assess inhibitory aspects of cognitive control, we measured task performance during the Go-NoGo task. The Go task had participants respond to rare stimuli (20% probability, clip art drawing of a lion) and withhold their response to frequent stimuli (80% probability, clip art drawing of a tiger). Next, participants completed the NoGo task, which had them respond to frequent stimuli (80% probability, tiger) and withhold their response to rare stimuli (20% probability, lion). They were asked to respond as quickly and accurately as possible. Given that no response was required for the target stimuli during the NoGo task, only response accuracy, but not reaction time, was used for the analyses. Before each task condition, the experimenter provided instructions and practice trials were presented repeatedly until the participant understood the task and exhibited task performance above chance. Participants then completed 250 trials (125 trials × 2 blocks) of each task condition. The viewing distance was 1 m. The stimuli subtended a horizontal visual angle of 2.6° and a vertical visual angle of 4.6°. Stimulus duration was 200 ms, with a 1700 ms inter-trial interval.
Academic achievement assessment
The WRAT3 was used to assess academic achievement in the content areas of reading (i.e., the number of words correctly pronounced aloud), spelling (i.e. the number of words correctly spelled), and arithmetic (i.e., the number of mathematical problems correctly solved). The WRAT3 is a paper and pencil based academic achievement assessment that has been age-normed referenced and has been strongly correlated with the California
Achievement Test - Form E and the Stanford Achievement Test (31). The ratings for standard scores are as follows: ≥ 130 = very superior, 120–129 = superior, 110–119 = high average, 90–109 = average, 80–89 = low average, 70–79 = borderline, and 69 ≥ = deficient (31).
$watermark-text
$watermark-text
Aerobic fitness assessment
VO2max was measured using a motor-driven treadmill and a modified Balke protocol (32). This task involved walking/running on a treadmill at a constant speed with increasing grade increments of 2.5% every 2 min until volitional exhaustion occurred. Oxygen consumption was measured using a computerized indirect calorimetry system (ParvoMedics True Max 2400, Salt Lake City, UT, USA) with averages for VO2 and respiratory exchange ratio assessed every 20 s. A polar heart rate monitor (Polar WearLink+ 31; Polar Electro, Finland) was used to measure heart rate throughout the test and ratings of perceived exertion were assessed every 2 min using the children's OMNI scale (33). VO2max was based upon maximal effort as evidenced by (i) a peak heart rate ≥ 185 bpm and a heart rate plateau; (ii) respiratory exchange ratio ≥ 1.0; (iii) a score on the children's OMNI ratings of perceived exertion scale ≥ 8; and/or (iv) a plateau in oxygen consumption corresponding to an increase of less than 2 ml/kg/min despite an increase in workload. To avoid multicollinearity in our multiple regression analyses, we used VO2max percentile according to normative data provided by Shvartz and Reibold (34) rather than relative VO2max (ml/kg/min), which is calculated from body weight.
Statistical analysis
We examined whether each weight status measure (i.e., BMI, whole body fatness [%Fat], ROI fat mass) was associated with response accuracy and academic achievement scores using multiple hierarchical linear regression analyses, controlling for confounding variables. Age, Sex, IQ, SES, and VO2max percentile were included in Step 1 as control variables, and weight status measures were then added to Step 2 of the analysis. The significance of the change in the R2 value between the two steps was used to judge the independent
contribution of weight status measures for explaining variance in response accuracy and academic achievement scores beyond that of the demographic variables. This analysis was performed separately for each weight status measure and dependent variable (i.e., Go and NoGo response accuracy and WRAT3 scores). The level was set at .05. All analyses were performed using SPSS Statistics version 19 (IBM Corp., Somers, NY, USA).
RESULTS
Task performance
Task performance data and WRAT3 scores are provided in Table 1. A summary of the regression analyses for each weight status measure is provided in Table 2. The regression analysis of BMI for response accuracy during the NoGo task yielded a significant change in the R2 at Step 2 (ΔF1, 119 = 4.73, P = 0.03), indicating that higher BMI was associated with lower response accuracy (partial correlation (pr) = −0.20, t119 = 2.17, P = 0.03). Additional analyses using whole body %Fat (ΔF1, 119 = 5.61, P = 0.02) and ROI fat mass (ΔF1, 119 = 5.71, P = 0.02) yielded similar results, with a higher percentage of whole body fat (pr = −0.21, t119 = 2.37, P = 0.02) and higher ROI fat mass (pr = −0.21, t119 = 2.39, P = 0.02) associated with lower response accuracy during the NoGo task. Conversely, no such association was observed for response accuracy during the Go task (see Table 2).
Academic achievement
Regression analyses for BMI yielded significant changes in the R2 at Step 2 for the spelling (ΔF1, 119 = 5.61, P = 0.02) and arithmetic (ΔF1, 119 = 10.22, P = 0.002) scores, indicating that higher BMI was associated with lower spelling (pr = −0.21, t119 = 2.37, P = 0.02) and arithmetic (pr = −0.28, t119 = 3.20, P = 0.002) achievement. The regression analyses for whole body %Fat yielded significant changes in the R2 at Step 2 for the reading (ΔF1, 119 = 4.49, P = 0.04) and spelling (ΔF1, 119 = 3.87, P = 0.05) scores, indicating that a higher
$watermark-text
$watermark-text
percentage of whole body fat was associated with lower reading (pr = −0.19, t119 = 2.12, P = 0.04) and spelling (pr = −0.18, t119 = 1.97, P = 0.05) achievement. Lastly, analyses using ROI fat mass yielded a significant change in the R2 at Step 2 for all WRAT3 scores (reading: ΔF1, 119 = 5.44, P = 0.02; spelling: ΔF1, 119 = 5.71, P = 0.02; arithmetic: ΔF1, 119 = 4.92, P = 0.03), indicating that higher ROI fat mass was associated with lower reading (pr = −0.21, t119 = 2.33, P = 0.02), spelling (pr = −0.21, t119 = 2.39, P = 0.02), and arithmetic (pr = −0.20, t119 = 2.22, P = 0.03) achievement.
DISCUSSION
Consonant with our hypotheses, weight status was negatively associated with cognitive control, as children with higher BMI exhibited poorer performance on a task requiring greater amounts of inhibitory control (i.e., NoGo task). By contrast, no relationship between BMI and performance was observed for a task requiring lesser amounts of cognitive control (i.e., Go task). Thus, the current study shows that the negative relationship between BMI and cognitive function is selectively observed for tasks requiring greater amounts of cognitive control in preadolescent children. In addition, higher BMI was associated with poorer academic achievement scores, confirming previous reports (6–9). Given that research has observed a positive relationship between inhibitory control and academic achievement in children (12–14), this study provides an empirical basis for the negative relationship between BMI and scholastic performance.
The relation of BMI to inhibitory control and academic achievement was extended to include more accurate measures of fat mass, which were derived using DXA to assess a region of interest characterizing central adiposity. It is noteworthy that the relationship differed slightly between BMI and central adiposity measures. More specifically, central adiposity was negatively associated with all WRAT3 scores, whereas no association was observed between BMI and reading achievement. Thus, given that the height and weight relationship varies dramatically during growth and development, BMI may sometimes underestimate the relationship between weight status and cognition during childhood. Additionally, it should be noted that weight status was inversely associated with academic achievement after controlling for IQ, which did not appear to be associated with weight status measures (BMI: r = −0.13, P = 0.15; whole body %Fat: r = 0.10, P = 0.30; ROI fat mass: r = −0.01, P = 0.93). Recent studies have suggested that cognitive control is more strongly associated with academic ability than IQ (35, 36). Thus, although IQ was positively associated with all WRAT3 scores (see Table 2), the negative relation of BMI and adiposity to academic achievement may not be due to differences in intelligence, but rather due to differences in cognitive functioning associated with weight status. Collectively, this study extends this area of research in two major ways. First, we used a cognitive task which manipulated cognitive control demands, and indicated that weight status was negatively and selectively associated only during task conditions requiring greater amounts of cognitive control. Second, we supplemented BMI with more accurate measures of adiposity, and indicated that central adiposity was more robustly related to cognition.
Although the current study does not address the mechanisms underlying the relationship between adiposity and cognition, the selective relationship to cognitive control lead to speculation that weight status may be related to the neural network that has been implicated in cognitive control. It has been well established that the prefrontal cortex plays an important role in cognitive control (18). Additionally, neuroimaging studies have indicated that higher BMI is related to smaller gray matter volume in brain regions involved in cognitive control, including the prefrontal cortex (20–22). Further, it has been reported that the prefrontal cortex exhibits protracted maturation (19), and immature prefrontal activation (i.e., inability to recruit prefrontal cortex regions in the same manner as young adults) is associated with
$watermark-text
$watermark-text
poorer performance in children during tasks requiring greater amounts of cognitive control (37). Taken together, the selective relationship between adiposity and cognitive control may relate to less effective functioning of the prefrontal cortex for overweight and obese
children; however, neuroimaging studies are required to support such a claim.
Despite the observed negative relation of weight status to cognitive control and academic achievement, the results should be interpreted with caution. First, in the present study, no participants had WRAT3 scores less than 70, which is classified as the deficient range (31), and mean WRAT3 scores were higher than 90, which is classified as the average range (31), across groups and the three subtests (see Table 1). Further, most participants (> 90%) were above the low average range (i.e., ≥ 80) across the three subtests (> 85% even in obese children). Thus, the observed negative associations do not imply that being overweight and obesity during childhood can result in cognitive impairment. Second, it should be noted that recent longitudinal studies have observed the negative relationship between weight status and cognition in both directions (7–9, 38, 39). Specifically, moving from “not-overweight” to “overweight” during the first 4 years of school was associated with reductions in
scholastic performance (7). Further, school-based obesity prevention interventions including nutrition and physical activity programs improved academic achievement (8,9). Conversely, a longitudinal study indicated that inferior inhibitory control in toddlers (2 years of age) can be a predictor of obesity in early childhood (5.5 years of age (38)). Further, a recent neuroimaging study showed that smaller gray matter volume in brain regions implicated in inhibitory control such as the superior frontal gyrus and middle frontal gyrus can predict the next year's weight gain in adolescents (39). Based on these findings, the direction of the relationship between adiposity and cognition remains unclear, and it is entirely possible that causality may run in both directions. Thus, further investigation using longitudinal
randomized control interventions is warranted to better establish a causal link between changes in weight status and cognition. Third, as may be seen in Table 1, NoGo response accuracy did not appear to differ between overweight and obese children, whereas group differences in WRAT3 scores appeared to be larger between overweight and obese children than between healthy weight and overweight children. These data imply that the negative association between weight status and cognition may be nonlinear, and the association may differ between cognitive control and academic achievement. However, if overweight children exhibit inferior inhibitory control, this may result in future weight gain as discussed above, and possibly poorer academic performance. Given that this is merely speculation, future studies are necessary to elucidate the possible nonlinear relationship based on different aspects of cognition using longitudinal study designs. Lastly, limitations exist with respect to the effects of nutrition. It has been well established that nutrition can influence cognitive development (for review see ref. (40)). That is, nutritional status may partially mediate the relation of weight status to cognitive control and academic achievement. As such, future research needs to consider potential interactions of nutritional status, adiposity, and cognition.
The present study provides evidence that BMI and adiposity is negatively associated with cognition and academic achievement. Further, the current data provides new insight into the negative and selective relationship between adiposity and cognitive performance on tasks requiring extensive amounts of cognitive control, which is implicated in scholastic performance (12–14). As such, these data speak to the relationship between adiposity and brain health. Such findings are important as they may serve to improve cognition and maximize brain health during preadolescent development, which has implications for scholastic success.
$watermark-text
$watermark-text
Acknowledgments
Support for our research and the preparation of this manuscript were provided by a grant from the National Institute of Child Health and Human Development (NICHD R01 HD055352) to Charles Hillman.
REFERENCES
1. Ogden CL, Carroll MD, Curtin LR, Lamb MM, Flegal KM. Prevalence of high body mass index in US children and adolescents, 2007–2008. JAMA. 2010; 303:242–249. [PubMed: 20071470] 2. Ogden CL, Flegal KM, Carroll MD, Johnson CL. Prevalence and trends in overweight among US
children and adolescents, 1999–2000. JAMA. 2002; 288:1728–1732. [PubMed: 12365956] 3. Whitaker RC, Wright JA, Pepe MS, Seidel KD, Dietz WH. Predicting obesity in young adulthood
from childhood and parental obesity. N Engl J Med. 1997; 337:869–873. [PubMed: 9302300] 4. Fontaine KR, Redden DT, Wang C, Westfall AO, Allison DB. Years of life lost due to obesity.
JAMA. 2003; 289:187–193. [PubMed: 12517229]
5. Olshansky SJ, Passaro DJ, Hershow RC, et al. A potential decline in life expectancy in the United States in the 21st century. N Engl J Med. 2005; 352:1138–1145. [PubMed: 15784668]
6. Castelli DM, Hillman CH, Buck SM, Erwin HE. Physical fitness and academic achievement in third- and fifth-grade students. J Sport Exerc Psychol. 2007; 29:239–252. [PubMed: 17568069] 7. Datar A, Sturm R. Childhood overweight and elementary school outcomes. Int J Obes (Lond). 2006;
30:1449–1460. [PubMed: 16534518]
8. Donnelly JE, Greene JL, Gibson CA, et al. Physical Activity Across the Curriculum (PAAC): a randomized controlled trial to promote physical activity and diminish overweight and obesity in elementary school children. Prev Med. 2009; 49:336–341. [PubMed: 19665037]
9. Hollar D, Messiah SE, Lopez-Mitnik G, Hollar TL, Almon M, Agatston AS. Effect of a two-year obesity prevention intervention on percentile changes in body mass index and academic
performance in low-income elementary school children. Am J Public Health. 2010; 100:646–653. [PubMed: 20167892]
10. Li Y, Dai Q, Jackson JC, Zhang J. Overweight is associated with decreased cognitive functioning among school-age children and adolescents. Obesity (Silver Spring). 2008; 16:1809–1815. [PubMed: 18551126]
11. Gunstad J, Spitznagel MB, Paul RH, et al. Body mass index and neuropsychological function in healthy children and adolescents. Appetite. 2008; 50:246–251. [PubMed: 17761359]
12. Agostino A, Johnson J, Pascual-Leone J. Executive functions underlying multiplicative reasoning: problem type matters. J Exp Child Psychol. 2010; 105:286–305. [PubMed: 19913238]
13. Bull R, Scerif G. Executive functioning as a predictor of children's mathematics ability: inhibition, switching, and working memory. Dev Neuropsychol. 2001; 19:273–293. [PubMed: 11758669] 14. St Clair-Thompson HL, Gathercole SE. Executive functions and achievements in school: Shifting,
updating, inhibition, and working memory. Q J Exp Psychol. 2006; 59:745–759.
15. Meyer DE, Kieras DE. A computational theory of executive cognitive processes and multiple-task performance: Part 1. Basic mechanisms. Psychol Rev. 1997; 104:3–65. [PubMed: 9009880] 16. Norman, DA.; Shallice, T. Attention to action: Willed and automatic control of behavior. In:
Davidson, RJ.; Schwartz, GE.; Shapiro, D., editors. Consciousness and self-regulation: Vol. 4. Advances in research and theory. Plenum Press; New York: 1986. p. 1-18.
17. Diamond, A. The early development of executive functions. In: Bialystok, E.; Craik, FIM., editors. Lifespan cognition: Mechanisms of change. Oxford University Press; New York: 2006. p. 70-95. 18. Miller EK, Cohen JD. An integrative theory of prefrontal cortex function. Annu Rev Neurosci.
2001; 24:167–202. [PubMed: 11283309]
19. Gogtay N, Giedd JN, Lusk L, et al. Dynamic mapping of human cortical development during childhood through early adulthood. Proc Natl Acad Sci U S A. 2004; 101:8174–8179. [PubMed: 15148381]
20. Horstmann A, Busse FP, Mathar D, et al. Obesity-Related Differences between Women and Men in Brain Structure and Goal-Directed Behavior. Front Hum Neurosci. 20011; 5:58. [PubMed: 21713067]
$watermark-text
$watermark-text
21. Maayan L, Hoogendoorn C, Sweat V, Convit A. Disinhibited eating in obese adolescents is associated with orbitofrontal volume reductions and executive dysfunction. Obesity (Silver Spring). 2011; 19:1382–1387. [PubMed: 21350433]
22. Raji CA, Ho AJ, Parikshak NN, et al. Brain structure and obesity. Hum Brain Mapp. 2010; 31:353–364. [PubMed: 19662657]
23. Hillman CH, Erickson KI, Kramer AF. Be smart, exercise your heart: exercise effects on brain and cognition. Nat Rev Neurosci. 2008; 9:58–65. [PubMed: 18094706]
24. DuPaul, GJ.; Power, TJ.; Anastopoulos, AD.; Reid, R. ADHD Rating Scale – IV: Checklists, norms, and clinical interpretation. The Guilford Press; New York: 1998.
25. Kuczmarski R, Ogden C, Grummer-Strawn L, et al. CDC growth charts: United States. Adv Data. 2000; 8:1–27. [PubMed: 11183293]
26. Field AE, Laird N, Steinberg E, Fallon E, Semega-Janneh M, Yanovski JA. Which metric of relative weight best captures body fatness in children? Obes Res. 2003; 11:1345–1352. [PubMed: 14627755]
27. Kaufman, AS.; Kaufman, NL. Kaufman Brief Intelligence Test manual. American Guidance Service; Circle Pines, MN: 1990.
28. Mezzacappa E. Alerting, orienting, and executive attention: developmental properties and sociodemographic correlates in an epidemiological sample of young, urban children. Child Dev. 2004; 75:1373–1386. [PubMed: 15369520]
29. Shrewsbury V, Wardle J. Socioeconomic status and adiposity in childhood: a systematic review of cross-sectional studies 1990–2005. Obesity (Silver Spring). 2008; 16:275–284. [PubMed: 18239633]
30. Birnbaum AS, Lytle LA, Murray DM, Story M, Perry CL, Boutelle KN. Survey development for assessing correlates of young adolescents' eating. Am J Health Behav. 2002; 26:284–295. [PubMed: 12081361]
31. Wilkinson, GS. Wide Range Achievement Test 3– Administration manual. Jastak Associates; Wilmington, DE: 1993.
32. American College of Sports Medicine. ACSM's guidelines for exercise testing and prescription. 7th edn. Lippincott Williams & Wilkins; New York: 2006.
33. Utter AC, Robertson RJ, Nieman DC, Kang J. Children's OMNI Scale of Perceived Exertion: walking/running evaluation. Med Sci Sports Exerc. 2002; 34:139–144. [PubMed: 11782659] 34. Shvartz E, Reibold RC. Aerobic fitness norms for males and females aged 6 to 75 years: a review.
Aviat Space Environ Med. 1990; 61:3–11. [PubMed: 2405832]
35. Alloway TP, Alloway RG. Investigating the predictive roles of working memory and IQ in academic attainment. J Exp Child Psychol. 2010; 106:20–29. [PubMed: 20018296]
36. Blair C, Razza RP. Relating effortful control, executive function, and false belief understanding to emerging math and literacy ability in kindergarten. Child Dev. 2007; 78:647–663. [PubMed: 17381795]
37. Bunge SA, Dudukovic NM, Thomason ME, Vaidya CJ, Gabrieli JD. Immature frontal lobe contributions to cognitive control in children: evidence from fMRI. Neuron. 2002; 33:301–311. [PubMed: 11804576]
38. Graziano PA, Calkins SD, Keane SP. Toddler self-regulation skills predict risk for pediatric obesity. Int J Obes (Lond). 2010; 34:633–641. [PubMed: 20065961]
39. Yokum S, Ng J, Stice E. Relation of regional gray and white matter volumes to current BMI and future increases in BMI: a prospective MRI study. Int J Obes (Lond). 2011 epub ahead of print 6 Sep 2011;doi:10.1038/ijo.2011.175.
40. Bryan J, Osendarp S, Hughes D, Calvaresi E, Baghurst K, van Klinken JW. Nutrients for cognitive development in school-aged children. Nutr Rev. 2004; 62:295–306. [PubMed: 15478684]
$watermark-text
$watermark-text
$watermark-text
$watermark-text
$watermark-text
Table 1
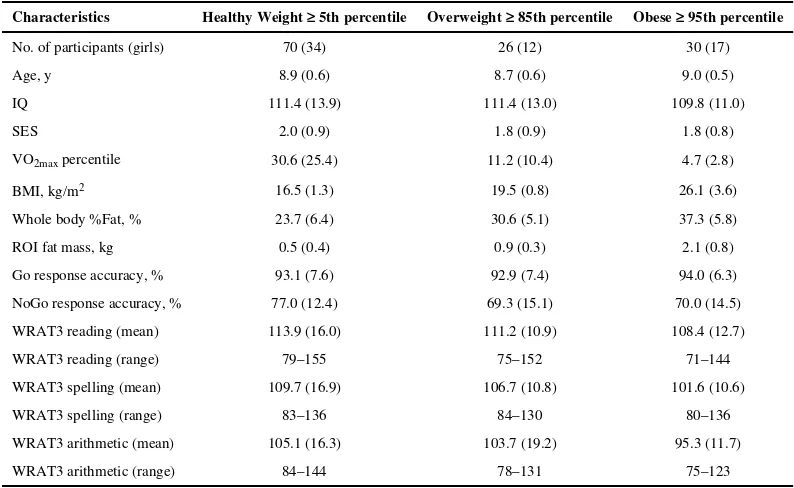
Participant demographics, task performance, and WRAT3 scores by weight status category
Characteristics Healthy Weight ≥ 5th percentile Overweight ≥ 85th percentile Obese ≥ 95th percentile
No. of participants (girls) 70 (34) 26 (12) 30 (17)
Age, y 8.9 (0.6) 8.7 (0.6) 9.0 (0.5)
IQ 111.4 (13.9) 111.4 (13.0) 109.8 (11.0)
SES 2.0 (0.9) 1.8 (0.9) 1.8 (0.8)
VO2max percentile 30.6 (25.4) 11.2 (10.4) 4.7 (2.8)
BMI, kg/m2 16.5 (1.3) 19.5 (0.8) 26.1 (3.6)
Whole body %Fat, % 23.7 (6.4) 30.6 (5.1) 37.3 (5.8)
ROI fat mass, kg 0.5 (0.4) 0.9 (0.3) 2.1 (0.8)
Go response accuracy, % 93.1 (7.6) 92.9 (7.4) 94.0 (6.3)
NoGo response accuracy, % 77.0 (12.4) 69.3 (15.1) 70.0 (14.5)
WRAT3 reading (mean) 113.9 (16.0) 111.2 (10.9) 108.4 (12.7)
WRAT3 reading (range) 79–155 75–152 71–144
WRAT3 spelling (mean) 109.7 (16.9) 106.7 (10.8) 101.6 (10.6)
WRAT3 spelling (range) 83–136 84–130 80–136
WRAT3 arithmetic (mean) 105.1 (16.3) 103.7 (19.2) 95.3 (11.7)
WRAT3 arithmetic (range) 84–144 78–131 75–123
Data are expressed as mean (s.d.) unless otherwise specified. Participants were categorized using the Centers for Disease Control and Prevention BMI-for-age growth charts (ref. 25).
Kamijo et al.
Page 11
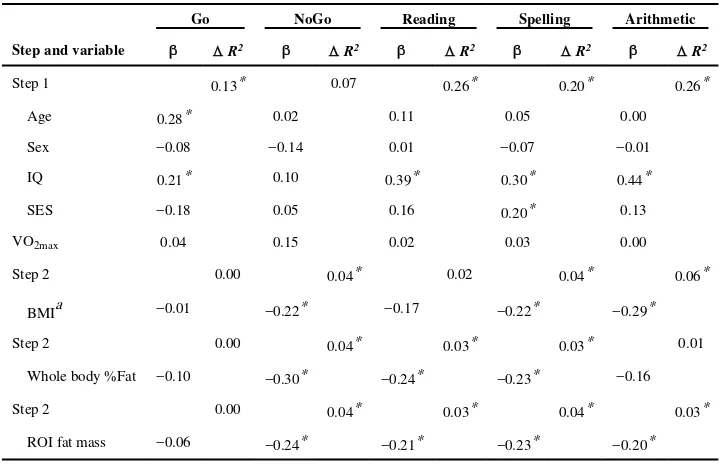
Table 2
Summary of regression ansilyses for variables predieting response accuracy and WRAT3 scores
Go NoGo Reading Spelling Arithmetic
Step and variable Δ R2 Δ R2 Δ R2 Δ R2 Δ R2
Step 1 0.13* 0.07 0.26* 0.20* 0.26*
Age 0.28* 0.02 0.11 0.05 0.00
Sex −0.08 −0.14 0.01 −0.07 −0.01
IQ 0.21* 0.10 0.39* 0.30* 0.44*
SES −0.18 0.05 0.16 0.20* 0.13
VO2max 0.04 0.15 0.02 0.03 0.00
Step 2 0.00 0.04* 0.02 0.04* 0.06*
BMIa −0.01 −0.22* −0.17 −0.22* −0.29*
Step 2 0.00 0.04* 0.03* 0.03* 0.01
Whole body %Fat −0.10 −0.30* −0.24* −0.23* −0.16
Step 2 0.00 0.04* 0.03* 0.04* 0.03*
ROI fat mass −0.06 −0.24* −0.21* −0.23* −0.20*
The results remained unchanged from those reported in the results section using BMI.
IQ, intelligence quotient; SES, socioeconomic status; VO2max, maximal oxygen consumption; BMI, body mass index; ROI, regions of interest.
a
We further conducted all analyses using standardized BMI (zBMI), which was calculated from age- and gender-normative data (ref. 25).
* P < 0.05.
Obesity (Silver Spring)
. Author manuscript; available in PMC 2013 June 01.