THE ANALYSIS OF MACROECONOMIC VARIABLES, REGIONAL STOCK INDEX, AND GOLD PRICE IMPACT ON JAKARTA ISLAMIC INDEX: AN APPROACH OF
VECTOR ERROR CORRECTION MODEL (VECM) (PERIOD OCTOBER 2012- MARCH 2016)
ANALISIS VARIABEL MAKROEKONOMI, PASAR SAHAM REGIONAL, DAN HARGA EMAS DUNIA TERHADAP JAKARTA ISLAMIC INDEX: PENDEKATAN
VECTOR ERROR CORRECTION MODEL (VECM) (PERIODE OKTOBER 2012-MARET 2016)
UNDERGRADUATE THESIS
Written by: SALMA NUR KARIMA
20130430022
FACULTY OF ECONOMICS AND BUSINESS
INTERNATIONAL PROGRAM FOR ISLAMIC ECONOMICS AND FINANCE (IPIEF) UNIVERSITAS MUHAMMADIYAH YOGYAKARTA
THE ANALYSIS OF MACROECONOMIC VARIABLES, REGIONAL STOCK INDEX, AND GOLD PRICE IMPACT ON JAKARTA ISLAMIC INDEX: AN APPROACH OF VECTOR ERROR CORRECTION MODEL
(VECM)
(PERIOD OCTOBER 2012- MARCH 2016)
ANALISIS VARIABEL MAKROEKONOMI, PASAR SAHAM REGIONAL, DAN HARGA EMAS DUNIA TERHADAP JAKARTA ISLAMIC INDEX: PENDEKATAN VECTOR ERROR CORRECTION
MODEL (VECM)
(PERIODE OKTOBER 2012-MARET 2016)
UNDERGRADUATE THESIS
In partial fulfillment for the requirement for the degree of Bachelor of Economics (Sarjana Ekonomi) at International Program for Islamic Economics and Finance
(IPIEF), Economics Department
Written by: SALMA NUR KARIMA
20130430022
FACULTY OF ECONOMICS AND BUSINESS
INTERNATIONAL PROGRAM FOR ISLAMIC ECONOMICS AND FINANCE (IPIEF)
DECLARATION
Name : Salma Nur Karima Student Number : 20130430022
I declared that this undergraduate thesis entitled “The Analysis of Macroeconomic Variables, Regional Stock Index, and Gold Price Impact on Jakarta Islamic Index: An Approach of Vector Error Correction Model (VECM) (Period October 2012- March 2016)” does not consist of any content that ever being proposed for any degree in other university, ideas of any research and publication of others, in exception all quotes and ideas which are purposely taken are considered as the research references and listed in the reference list. Therefore, if any violation of intellectual right is found in this study, I agree to accept any relevant academic consequences.
Yogyakarta, April, 22nd 2017
And more much more than this, I did it my way –
FRANK SINATRA
I’m not the goodie goodie you think I’m – RACHEL ZANE
ACKNOWLEDGEMENT
Bismillahirrahmanirrahim
In the name of Allah, the most Merciful, the most Gracious. All praise is due to Allah; we praise Him, seek His help, and ask for His forgiveness. I am thankful to Allah, who supplied me with the courage, the guidance, and the love to complete this thesis. Also, Peace and salutation always be to the Prophet Muhammad peace be upon him altogether with his accompanies.
This undergraduate thesis entitled “The Analysis of Macroeconomic Variables, Regional Stock Index, and Gold Price Impact on Jakarta Islamic Index: An Approach of Vector Error Correction Model (VECM) (Period October 2012- March 2016)” has been made as partial fulfillment for the requirement to achieve the bachelor degree of economics (Sarjana Ekonomi). So that, I would like to give my sincere gratitude for all parties who are contribute in this thesis. In particularly they are:
1. My family who always be my lifetime biggest supporter. For relentless prays and warmest embraces. I might never be a doctor. Yet there is
something that I could give to make you guys proud of me. There’s only
superlative word to describe how precious they are.
2. Marissa Ishak for being the very first person who supported my decision
on moving here. Thanks for always reminding me, “It’s never too late to come to Mannheim whenever you are ready”.
3. Nadya Rose. Thanks for these precious 3 years, for being a very good friend of mine. Wishing all the best things for this beauty. I’m forever
grateful for lots of things you could ever share to me. It’s never too late to
have a cup of coffee at Starbucks talking about many things
4. S Faradibah Iskandar. Thanks for staying through thick and thin as well taking care of me anytime. Wishing you could be a very good dentist. You are the reason why this city will always be missed. Get well so soon and
let’s have much more fun.
5. Nizar Haiydar and Nadier Raffi. Thanks for making me laugh like no one else. Wishing you guys are healthy, wherever you are. Be a good doctor
buddy, don’t just do reckless things. Let’s have a big bite of Big Mac once
we meet again.
6. Akbar Rizki. Thanks for being my goofing partner. Let’s eat lots of food and joke about all the nonsense things. Wishing you wouldn’t involve in any other accidents.
7. IPIEF 2013 for being so helpful and sharing lots of joy altogether.
9. IPIEF lectures and staffs who always be a good family and giving all the valuable lessons.
10. To all of my friends, colleagues and every person I met for making my college memories become much more precious.
Yogyakarta, April 22nd 2017
CONTENTS
CHAPTER I INTRODUCTION ... 1
A. Research Background... 1
B. Research Limitation ... 9
C. Research Question ... 9
D. Research Objective... 10
E. Research Benefit ... 10
CHAPTER II LITERATURE REVIEW... 11
A. Theories ... 11
7. Jakarta Islamic Index... 23
8. Exchange Rate ... 25
9. Oil Price ... 27
10. FTSE Malaysia ... 29
11. Gold Price ... 31
C. Research Framework ... 34
D. Hypothesis ... 36
CHAPTER III DATA AND RESEARCH MEYHODOLOGY ... 37
A. Data Collecting Method and Sources ... 37
B. Econometric Model ... 37
C. Operational Definition ... 38
1. Dependent Variable ... 38
2. Independent Variables ... 39
D. Analysis Method ... 39
1. Unit Root Test ... 40
2. Lag Length Criteria ... 40
3. Stability VAR Model Test ... 40
4. Co-Integration Test ... 41
5. Vector Error Correction Model (VECM) ... 41
6. Impulse Response Function ... 42
7. Variance Decomposition ... 42
E. Research Outlines... 42
CHAPTER IV RESEARCH FINDING AND DISCUSSION ... 37
A. Research Variable Overview ... 44
1. Jakarta Islamic Index ... 44
5. Vector Error Correction Model (VECM) ... 53
6. Impulse Response Function ... 57
C. Discussion ... 61
1. VECM in Short Term ... 61
2. VECM in Long Term ... 63
3. IRF Analysis ... 65
4. FEVD Analysis ... 66
CHAPTER V CONCLUSION AND RECOMMENDATION ... 68
A. Conclusion ... 68
B. Recommendation ... 69
REFERENCE ... 71
LIST OF TABLE
1.1 The Development of Market Capitalization ... 3
1.2 Top Countries with Islamic Market Capitalization ... 5
2.1 The Instrument of Conventional and Islamic Investment ... 17
2.2 List of Companies in Jakarta Islamic Index ... 24
3.1 Data and Sources ... 37
4.1 Unit Root Test ... 49
4.2 Lag Length Criteria ... 50
4.3 Test of VAR Stability ... 51
4.4 Co-Integration Test ... 52
4.5 VECM Estimation Result ... 53
4.6 VECM in Short Term ... 55
4.7 VECM in Long Term ... 56
LIST OF FIGURE
1.1 The Pattern Movement of JII ... 4
2.1 The Investor Utility Index ... 14
2.2 List of Countries with Islamic Capital Market ... 19
2.3 Research Framework ... 36
3.1 VAR/VECM Analysis Process ... 41
4.1 JII Price Movement ... 44
4.2 Exchange Rate Price Movement ... 45
4.3 Oil Price Movement ... 46
4.4 Gold Price Movement ... 47
4.5 FTSE Malaysia Price Movement ... 48
4.6 Response JII on exchange rate ... 57
4.7 Response JII on oil price ... 58
4.8 Response JII on FTSE Malaysia ... 58
ABSTRACT
This research examines the relationship between a number of variables influencing Jakarta Islamic Index. The study employs monthly series data panning from the period October 2012 to March 2016. Variables that are used in this research are Jakarta Islamic Index, exchange rate, oil price, FTSE Malaysia and gold price.
The analysis tool that is used in this research is Vector Error Correction Model (VECM) to establish the short-run and long-run relationship. The result indicates in the short run, gold price negatively influencing JII and oil price positively influencing JII. However, in the long run all variables are significantly influencing JII. Exchange rate and oil price are positively influencing JII, while gold price and FTSE Malaysia are negatively influencing JII.
INTISARI
Penelitian ini bertujuan untuk mengetahui hubungan beberapa variabel dengan Jakarta Islamic Index (JII). Penelitian ini menggunakan data bulanan dari periode Oktober 2013 sampai Maret 2016. Variabel yang digunakan dalam penitilian adalah Jakarta Islamic Index, kurs, harga minyak, FTSE Malaysia, dan harga emas.
Alat analisis yang digunakan dalam penilitian ini adalah Vector Error Correction Model (VECM) untuk mengetahui hubungan jangka pendek dan jangka panjang. Dari hasil penelitian diketahui bahwa di jangka pendek, harga emas berpengaruh signifikan dan negatif terhadap JII, dan harga minyak berpengaruh signifikan dan positif terhadap JII. Sedangkan di jangka panjang, semua variabel berpengaruh signifikan terhadap JII. Kurs dan harga minyak berpengaruh positif terhadap JII, sedangkan FTSE Malaysia dan harga emas berpengaruh negatif terhadap JII.
1
CHAPTER I
INTRODUCTION
A. Research Background
The need of capital either for company or person tends to increase each year. The increasing activities can be seen from the increasing rate of production. In order to ease the society’s activities to rise capital; the government along with the related institutions should be able to create environment for the capital market participants. Furthermore, government has power to create the strict regulation to the participants to prevent the confusion in the market.
Capital market is a part of financial market that functions as both for economic and financial function. As economic function; capital market allocates fund from the issuer to the fund-seeker. While as financial function; capital market gives return (capital gain) for the fund issuers based on the types of investments they have (Sri 2012).
2
According to Beik and Fatmawati (2004) capital market has an important role in the development of global economy. As a country in which experiencing the booming financial market, capital market takes over the Indonesian economy to play an important role. The capital market can be used as the fund intermediary, as an alternative market to invest, or as indicator of macroeconomic stability.
Since the 1980’s the capital market in Indonesia highlighted a significant growth. It marks the positive growth in accordance with the ratification of Law No. 8 of 1995 on Capital Market, and also the regulation after the crisis on 1997 on the good cooperate governance (GCG). In 2013, the supervisor of the capital market in Indonesia has been transferred from Bapepam-LK and the Central Bank to the Indonesian Financial Service Authority (OJK). IDX is a result of Jakarta Stock Exchange and Surabaya Stock Exchange merger (Jeffrey 2013)
3
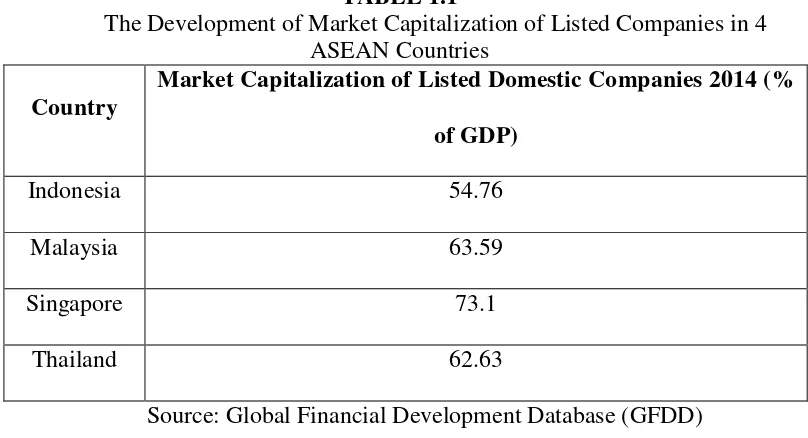
The performance of the market capitalization is quite excellent. It can be seen from the value which keeps increasing. Although in 2008 the value slumps from the previous year, it might be caused by the global crisis back then. The good capital performance is an excellent indicator to trigger the economic performance in Indonesia. Comparing to other
countries in ASEAN, Indonesia’s market capitalization is still lack behind.
TABLE 1.1
The Development of Market Capitalization of Listed Companies in 4 ASEAN Countries
Country
Market Capitalization of Listed Domestic Companies 2014 (% of GDP)
Indonesia 54.76
Malaysia 63.59
Singapore 73.1
Thailand 62.63
Source: Global Financial Development Database (GFDD)
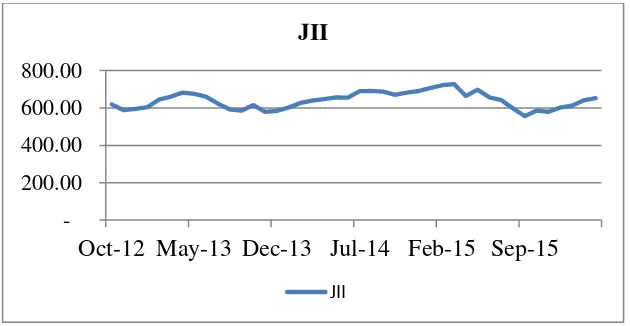
4
grow up. From the year of 2012 until 2016, the rate keeps increasing. Although in the end of 2015, the value slumps a little.
Source: Fusion Media.Ltd FIGURE 1.1
The Pattern Movement of Jakarta Islamic Index
From the research by Shiller (1988) it showed one of the things causing the volatility is the regulation made by the government. The regulation which initially aims to reduce the policy might actually increase the volatility; while the regulation aims to improve the economic performance might decrease the volatility. The volatility in 2008 can also happen because of the global crisis. The crisis led to the slump market yet the recovery took such a short time to get back to normal.
In other country cases, such as Malaysia and Bahrain, the Islamic Capital Market prolific to all level of capital market and the derivatives product. In each country, the market development is quite high. Capital market also records in rapid speed in terms of the development. For the international market, Dow Jones as one of the renowned market provider
200.00 400.00 600.00 800.00
Oct-12 May-13 Dec-13 Jul-14 Feb-15 Sep-15 JII
5
along with the prominent apprentice and scholar outline the Dow Jones Islamic World Markets (DJIWM) functions to refine the Sharia based investment (Bacha and Mirakhor 2013).
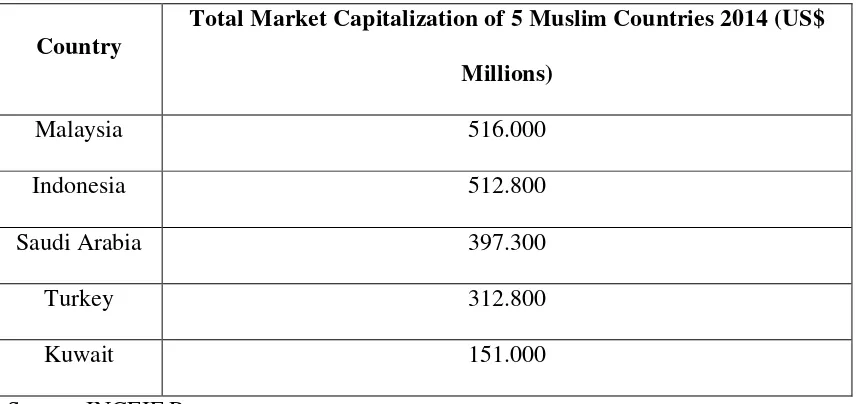
Up to 2014 Malaysia ranks in the first position for the countries with the largest ICM, followed by Indonesia, Saudi Arabia, Turkey and Kuwait. Malaysia has become the pioneer in the ICM. Malaysia has relative market stability among the countries with ICM.
TABLE 1.2
Top 5 Countries with Largest Islamic Market Capitalization
Country
Total Market Capitalization of 5 Muslim Countries 2014 (US$ Millions)
Malaysia 516.000
Indonesia 512.800
Saudi Arabia 397.300
Turkey 312.800
Kuwait 151.000
Source: INCEIF Report
6
Rupiah appreciation is a positive signal for investor in capital market. Meaning rupiah appreciation will make stock market stronger and vice versa. Rupiah depreciation will increase the export value of a certain
company. An increasing in export value will increase the company’s
revenue, leads to the increasing profit that in the end will increase JII. When one company has higher profit, overall stock market will also have increasing value.
Capital market in Indonesia is developing as well. According to the report from Indonesia: Financial System Stability Assesment (2010) it declares that Indonesia capital market is still limited to several types of investments. The government has to actively maintain the strategy on getting the economic stability, for example using the macroeconomic stability.
Besides exchange rate, another important macroeconomic variable influencing stock market is oil price. Oil price impacts most of the economic activities. The impact of oil price influences the supply and demand side in the market. Oil price has continuously becomes an indicator to estimate the stock market. While majority it gives significant relationship on the stock market, different countries will have the different result on this.
7
$112 to $47 on the period of June 2014 until January 2015. It can be caused from the financial crisis at that time (Baumeister and Killian 2014).
As one of the AEC members, Indonesia should maintain the relationship with the neighbor countries. In terms of economy activity, the effect of regional stock market to Jakarta Islamic Index (JII) performance is also important. One of the advanced stock markets in ASEAN besides Indonesia is Malaysia. Malaysia also has stock market which is FTSE Malaysia. Established in January, 12 2006 Bursa Malaysia Berhad and FTSE International cooperation signed an agreement to establish Islamic indices in Malaysia. The index was officially launched in 26 June 2006 (Russel 2009).
The report from Arslanalp, et al. (2006) concludes that a shock from one country to the financial condition to other countries can be said as a financial spillover. There are a number of reasons on the countries shock influences to the others, namely; the magnitude, the linkage, and the vulnerability. So, it can be concluded that there are the linkages of one country financial stability to the other countries.
8
used in the financial industry as a holding. Another use for gold is also become the source of wealth for the owner of gold (Bilal, et al. 2013).
Nowadays holding gold is regarded an important to do, especially in the stock market development. The result from the gold price on the stock market relationship shows the interesting finding. According to the result from the research of (Bhunia and Das 2012) shows the movement between the gold prices and the stock market returns. The movement even occurred during the crisis period. In case of India, people not only think gold as a precious yellow metal, but also as the kind of important investment. The sentiment also reasons why people hold gold as an investment in India. It is an interesting research that suggests the investors to consider the fluctuation on oil prices and gold prices surely affect the stock market return both in short and long run.
9
and gold price. The monthly data basis is also applied on the exchange rate (ER) and FTSE Malaysia price. This research will use the Vector Error Correction Model (VECM) analysis.
B. Research Limitation
A number of factors are influencing the stock market volatility. Thus, the research limitation restricts what are the problems that will be analyzed and occurred in the analysis. This study restricts to the following limitations:
This research only limits the variables of Jakarta Islamic Index, Exchange Rate, Oil Price, FTSE Malaysia and Gold Price during October 2012-March 2016 period.
C. Research Question
Based on the background explained earlier, these following problems will be solved throughout the research:
1. What is the impact of exchange rate on JII both in short run and long run?
2. What is the impact of oil price on JII both in short run and long run?
3. What is the impact of FTSE Malaysia on JII both in short run and long run?
10
D. Research Objective
Based on the research questions, thus the research objectives from this paper are as follows:
1. In order to know the impact of exchange rate on JII both in short run and long run
2. In order to know the impact of oil price on JII both in short run and long run
3. In order to know the impact of FTSE Malaysia on JII both in short run and long run
4. In order to know the impact of gold price on JII both in short run and long run
E. Research Benefit
The benefits from the research are surely for the development of Islamic Capital Market in Indonesia. The detailed objectives will be mentioned as follow:
1. It is expected to explain the long-run and short run relationship among: JII, exchange rate, oil price, FTSE Malaysia, and gold price
2. It is expected to give deeper knowledge to the current investor, or to the future investor on the factors affecting the Islamic Capital Market in Indonesia
CHAPTER II
LITERATURE REVIEW
A. Theories 1. Investment.
a. The Definition of Investment.
The definition of investment based on Mankiw N (2010) states that investment is a spending on a new capital; it can be goods, building, land etc. Investing can also be described as employing the fund of the owners to be invested and enhance the investor wealth. The wealth which is invested can be the assets-owned, assets-borrowed, or savings (Levisauskaite 2010).
b. The Types of Investment.
The types of investments are classified based on the type of risks that the investors are facing. The types of investments are divided into two types of investment, namely
1) Direct Investment.
12
2) Indirect Investment.
The investors participate in financial intermediaries. The risk is alleviated by participating in the financial intermediaries.
c. Real Investment and Financial Investment.
It is important to distinguish the real investment and the financial investment. Real investment typically employs the tangible assets, such as building land or machinery. However, financial investment deals with contract such as, stock, bonds or T-bill.
d. Types of Investors.
The types of investors can be divided into two ways, the first one is by a number of investors, and the second is by the risks that the investors are facing. The first type can be classified, as follow;
1) Individual Investors.
The investor owns their assets and invested by their own. The investors can either participate by direct or indirect investment.
2) Institutional Investors.
13
the institutional investors have larger fund than the individual investors.
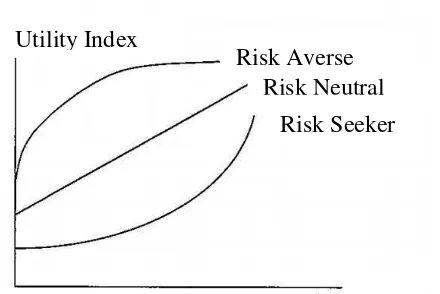
Another type of investors can be classified by the type of risk that they are facing. There are three types of investors to be mentioned below:
1) Risk Seeker.
This type of investors prefer to highest return of investment. Their behavior tends to be aggressive and speculative.
2) Risk Neutrality.
The next type of investors demand the same return for every increasing risk they get. Their behavior tends to be prudent and flexible
3) Risk Averse.
The last type is in contrary with the seeker investors. They tend to choose the lowest return of investment. This type of investor chooses the safest way on getting return without sacrificing too many assets.
14
FIGURE 2.1 The Investor Utility Index
The risk averse investor has an arc utility with the decreasing income. The risk neutral investor has straight line curve. As for the risk seeker investor has an arc curve with the increasing income.
e. Investment Process.
The process of doing investment is a cycle. It goes continuously. Referring to Tandelilin (2010) the investment process can be divided into five processes:
1) The investment objectives 2) The investment regulation 3) The portfolio strategy
4) The asset and portfolio formulation
5) The estimation and evaluation of portfolio investment Utility Index
Risk Averse Risk Neutral
Risk Seeker
15
2. Islamic Investment.
Islam is a religion that supports the knowledge to cope with the advancement. The investment concept is a knowledge that also has Sharia norms. It can be described from Surah Al-Hasyr verse 18
ْرظْ تْل َا ا قتا ا مآ يذلا ا يأ اي
ريبخ َا إ َا ا قتا دغل ْتمدق ام سْف
( ل ْعت ا ب
٨١
)
Translation:
O you who have believed, fear Allah. And let every soul look to what it has put forth for tomorrow-and fear Allah. Indeed Allah is Acquainted with what you do.
The word of “waltanzhur nafsun maa qaddamat lighadin” can be translated as count and check yourself out before being checked, and look at what you have saved (invest) from the god
deed (after here investment) as a provision in front of Allah”. It is a
command from Allah SWT to believe and doing investment as a provision by doing the good deeds for facing Judgement day (Huda and Nasution 2007).
16
Organization for Islamic Financial Institution (AAOIFI) was established.
a. Islamic Investment Principle.
The classification of Islamic investment principle from (Ismail 2012) can be seen below:
1) The prohibition of Riba’, Gharar and Maisir. Riba’ is interest, Gharar is uncertainty and Maisir is gambling. 2) The objectives of investment aim for both success in the
world and hereafter.
3) The investment should be chosen from Halal activities and products.
4) The investor final decision is not only about the return but also the affect for the society and environment.
b. Islamic Investment Product.
There are a number of products which are offered in Islamic investment. In Islamic investment, the investor
shouldn’t be worry on getting the profit. There is a higher aim
17
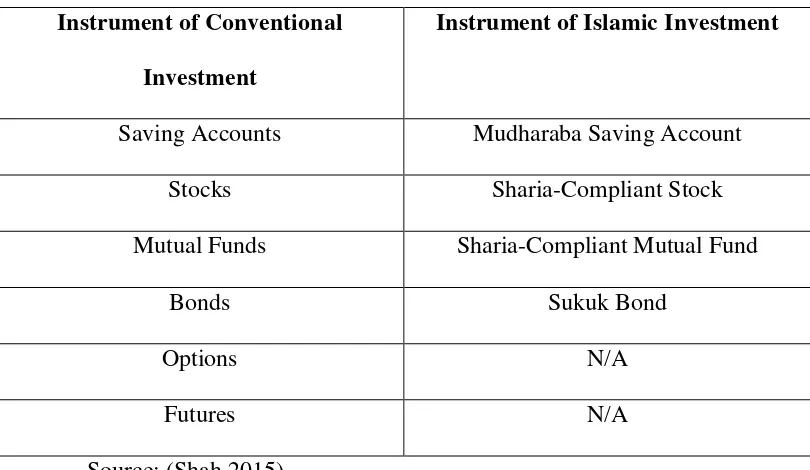
TABLE 2.1
The Instrument of Conventional and Islamic Investment Instrument of Conventional
Investment
Instrument of Islamic Investment
Saving Accounts Mudharaba Saving Account
Stocks Sharia-Compliant Stock
Mutual Funds Sharia-Compliant Mutual Fund
Bonds Sukuk Bond
Options N/A
Futures N/A
Source: (Shah 2015)
3. Capital Market.
Capital market is a market for the long-term financial instruments namely; bonds and equities which are issued by the government or privates companies being traded. The long-term financial is characterized by period longer than a year.
18
a. Function of Capital Market.
The function of Capital Market based from Goldsmith (1965) has two explanations. Firstly, it refers to the allocation from the saving from the users within that market or as the supply of financing in certain period of time. Secondly, it refers as the media for transferring the assets; either tangible or intangible among the parties within the market.
b. Types of Capital Market.
Capital market is divided into two types; it might be primary market or secondary market Vihar (2007). The classifications are as follow:
1) Primary Market.
Primary market offers the initial stocks for the first time. The issuer of stocks can be either a new firm or an existing firm.
2) Secondary Market.
Product such as an outstanding security is traded in secondary market. It also known as stock market dominantly acts in equity shares.
4. Islamic Capital Market
19
Islamic teaching and law within the activity. It leads to the offer that is slightly different offered to the investor. The ICM offers the Islamic bond securities, and the Islamic equity securities (Finance 2012).
The flourishing demand and awareness for the Sharia-compliant products result in the rapid growing of ICM among the countries. The growing development of capital market can also be seen from a number of Market Indices with the Sharia compliant basis.
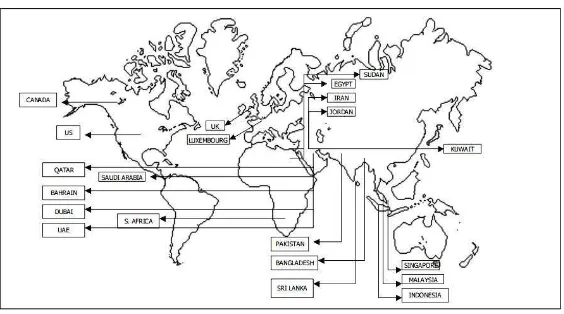
Source: OICU-IOSCO Report FIGURE 2.2
List of Countries Offering Islamic Capital Market
20
(
٥٧٢
)
……
Translation:
But Allah has permitted trade and has forbidden interest
a. Function of Islamic Capital Market
There are six functions of Islamic Capital Market that can be explained as follow (Sudarsono 2007):
1) Allowing the society to participate in business and get return from the risk they already put.
2) Allowing the shares owner to sell his shares and get liquidity.
3) Allowing the company to pool the capital to build production.
4) Separating business activity from short-term fluctuation. 5) Allowing the investment becomes one of the principles in
economic activity.
6) Increasing Muslim economic activities in order to increase their welfare.
5. Risk and Return.
21
early of 1960. This calculation is very useful for the investor in order to know the relation on risk and return that not every risk has significant relation with the return (Perold 2004). The calculation of CAPM can be written as follow;
Es = rf + β (Em– rf)
Where:
rf = return on risk with the free rate
β = systematical risk
Em= market return
Based on Sadaf and Andleeb (2004) CAPM with the return risk free rate is inconsistent with the Islamic teaching. In the Quran, it is written in Al Baqara, Verses 278-279 that concludes the prohibition of interest. Several scholars then replaced the return on risk with free rate with other factors, such as; Zakah (alm), or nominal GDP. So, the equation can be written as;
Es = Z + β (Em– Z) or Es = NGDPg+ β (Em– NGDPg)
6. Stock Market Index.
a. Definition and Calculation of Stock Market Index.
22
On the calculation method, global majority index mostly uses the Market Value Weighted Average Index. The formulation is;
Index =
x 100
Market value is the total amount of noted stock (for index calculation) times with market value. Market value may also be explained as market capitalization. The formula to estimate the market value is:
Market value = p1q1+p2q2+…+pnqn Where:
p1= closing price for company i
q= the amount of listed stock for company i n= the amount of companies in the market
Basic value is the cumulative of stock amount times time the base day price. For example the base day for IHSG is August 10, 1982 (Exchange 2008).
b. Types of Stock Market Index.
Indonesia Stock Market has 8 types of indices, including:
1) Indeks Harga Saham Gabungan (IHSG) 2) Indeks Sektoral
3) Indeks LQ45
23
5) Indeks Kompas100 6) Indeks Papan Utama
7) Indeks Papan Pengembangan 8) Indeks Individual
7. Jakarta Islamic Index.
Islamic Capital Market in Indonesia has started in the year of 1997 when PT Danareksa Investment Management issued the Islamic Mutual Fund. Then on July, 3 2000, the company along with Indonesia Stock Exchange on (formerly known as Jakarta Stock Index) launched the Jakarta Islamic Index (JII).
In Indonesia, the first step that is made by the Ulema Council formulated the first fatwa or law in regard to the capital market by Fatwa No. 20/DSN-MUI/IV/2001 as the framework for the Sharia Mutual Fund. The Financial Service Authority formed a team in 2003 to work on the Islamic Capital Market in Indonesia. On March 2004, as the authority to regulate the market along with the Indonesian Ulema Council (DSN-MUI), they created MoU to develop ICM in Indonesia more.
24
- Sharia Securities List, - Sharia Securities Insurance - Akad on the Sharia Securities. a. Screening Process.
According to Sudarsono (2007) screening process in Jakarta Islamic Index can be divided into three steps, namely; 1) Sharia screening including; companies should involve in
gambling and forbidden industry. Company is not a
conventional financial institution. It shouldn’t involve in
selling haram (forbidden) food and beverages. Lastly,
company shouldn’t sell, distribute or supply goods which
destroy morality or known as mudharat.
2) Capitalization screening screens 60 stock companies with highest market capitalization in BEJ then minimizes into screening 30 stock companies with highest average transaction in BEJ. The minimizing process will only include companies which passed the first step. 3) Evaluation process every 6-month is necessary to be
conducted.
TABLE 2.2
List of Companies in Jakarta Islamic Index (JII) Period December 2015-May 2016
Number Company
Codes Company Names Notes
1 AALI Astra Agro Lestari Tbk. Fixed
25
Cont Table 2.2
3 AKRA AKR Corporindo Tbk. Fixed
4 ASII Astra International Tbk. Fixed
5 ASRI Alam Sutera Realty Tbk. Fixed
6 BSDE Bumi Serpong Damai Tbk. Fixed
7 ICBP Indofood CBP Sukses Makmur Tbk. Fixed
8 INCO Vale Indonesia Tbk. Fixed
9 INDF Indofood Sukses Makmur Tbk. Fixed 10 INTP Indocement Tunggal Prakarsa Tbk. Fixed
11 JSMR Jasa Marga (Persero) Tbk. Fixed
12 KLBF Kalbe Farma Tbk. Fixed
13 LPKR Lippo Karawaci Tbk. Fixed
14 LPPF Matahari Department Store Tbk. Fixed 15 LSIP PP London Sumatera Indonesia Tbk. Fixed 16 MIKA Mitra Keluarga Karya Sehat Tbk. Fixed 17 PGAS Perusahaan Gas Negara (Persero) Tbk. Fixed 18 PTBA Tambang Batubara Bukit Asam (Persero)
Tbk. New
19 PTPP PP (Persero) Tbk. Fixed
20 PWON Pakuwon Jati Tbk. Fixed
21 SCMA Matahari Putra Prima Tbk. New
22 SILO Siloam International Hospitals Tbk. Fixed 23 SMGR Semen Indonesia (Persero) Tbk. Fixed
24 SMRA Summarecon Agung Tbk. Fixed
25 SSMS Sawit Sumbermas Sarana Tbk. Fixed 26 TLKM Telekomunikasi Indonesia (Persero) Tbk. Fixed
27 UNTR United Tractors Tbk. Fixed
28 UNVR Unilever Indonesia Tbk. Fixed
29 WIKA Wijaya Karya (Persero) Tbk. Fixed 30 WSKT Waskita Karya (Persero) Tbk. Fixed
Source: OJK Report 8. Exchange Rate.
26
According to Warjiyo (2013) exchange rate movement in
Indonesia doesn’t always represent the basic value. The volatility
of exchange rate can be caused by the capital flows volatility, the market behavior, and the influence from the offshore market. The role from Central Bank is also needed in order to maintain the exchange rate in stabile position.
The fluctuation of exchange rate of USD to IDR is highly effecting by the worldwide economy condition, especially USA. On some occasions, market reacts differently on the economic
condition, sometimes the actual things occur aren’t in line with the
expectation from market. That is why the weakening or strengthening in the market depends on the market reaction on the economy (Untara, Sugiharto and Lestari 2010).
In 1978, Indonesia exchange rate changed into a managed float regime from the fixed exchange rate regime. The system was completely managed by the Central Bank (BI) with the supervisory board. Then, on August 1997, the exchange rate was changed into the floating exchange rate regime from managed float regime (Hidayat 2014).
27
1) Nominal exchange rate defines as the respective price of domestic currency against foreign country, or commonly known as e.
2) Real exchange rate defines as the respective price of domestic goods comparing to foreign goods.
There are two approaches on the association of exchange rate and stock market. Based on Tian and Ma (2010) the approaches can be defined as follow:
1) The goods market theory or known as traditional approach explains that appreciation of domestic currency gives disadvantages to the exporters. The company’ shares likely become undesirable and affected the export-country. So that the relation between stock prices and exchange rate is positive.
2) The portfolio balances theory known as stock-oriented-approach explains that the causality relation is from stock market to exchange rate. If the price in shares increases then it will attract the capital inflow that results in the depreciation of domestic exchange rate. So that, the relation between exchange rate and share market is negative.
9. Oil Price.
Oil is one of the determinants on country’s macroeconomic
28
for the researchers to employ this variable on the macroeconomic condition (Berk and Aydogan 2012). The International Oil Price
uses Brent’s price as the standard (Arouri and Nguyen 2010).
The report from Europe (2013) explains that Brent oil is a high rank crude oil taken from the North Sea or precisely is the location among British, Europe and Scandinavian. The characteristic is light yet comparing to another type of crude oil (West Texas Intermediate), it is heavier. There are two majors benchmark for international standard oil price, namely; Brent Crude Oil and West Texas Intermediate (WTI).
The increasing price of oil has various results on global economy condition. Such as the shift of the consumers to the producers of oil, the increasing prices of goods and services, and also financial markets worldwide (Lin, Fang and Cheng 2009).
Theoretically, Rafailidis and Katrakilidis (2014); explains that the association between the oil price and stock market can be seen from the changes in expected cash flow or the discount rates. The cash flow can be predicted by the oil prices because most companies use oil in the production process. That in the end causing the different dividend or earning and the stock price importantly.
29
influences the operational cost from a company so that affect its revenues. If the stock market is efficient the increasing of oil price is likely negatively affecting the cash flow and in the end causing the declining return in stock market. The low return in stock market causing one index cannot attract investors to put the investment.
10.FTSE Malaysia.
The integration of global financial system is likely integrated each day. The international integration occurs because the residents whether national or overseas residents can decide to hold the financial instrument in other countries. The increasing rate of participation from international investors in one country affects regulation made by the government, such as; exchange rate, diversification, etc. (Kearney and Lucey 2004).
From Baele, et al. (2014) shows that the explanation on financial integration can be described by these following explanations;
1) The single rule is set to conduct the financial activity.
2) There’s no asymmetric information on the financial system.
3) The treatment for each participant is equal.
30
market. Generally, the regional stock market is likely effecting each other. The neighbor countries such as KLSE or FTSE in Malaysia, STI in Singapore or Hangseng in Hong Kong are the major stock markets are influencing Indonesian stock market (Mie and Agustina 2014).
FTSE Malaysia has become the prominent stock index in ASEAN. Launched in 2006, the stock prominently rose to the top index in market. According to Rashid, Hassan and Yein (2014) the emergence of Islamic capital market attracts both Muslim and non-Muslim investors to invest in that market. FTSE Bursa Malaysia has several screening process in order to list the company into the index. The screening process is conducted by the Securities Commissions Sharia Advisory Committee (SAC) along with Yasaar Ltd. So that the factors that are effecting stock market different from the others.
31
There are several strengths from FTSE Burse Malaysia, such as: the standard that is used in calculation is much clearer in the stock market. Second is the barometer used in calculation depicts the accurate state of market condition in Malaysia. The limitation of a number companies listed give better potential to the market (Romli , Mohamad and Yusof 2012).
The capital market integration occurs because the stock trade integration between countries keeps increasing. The trades involving the foreign investors buy the domestic share, and the domestic investors buy the international share. Thus if the trade increases between countries, the share price increases altogether in the same time (co-movement). The regional capital markets are likely having the same investors, so that the change in one market will be transmitted to others (Mansur 2005).
11.Gold Price.
The thing that can be summarized from the CAPM model is that there are a lot of factors influencing stock market. The CAPM model tells that the investor decides the portfolio based on Markowitz criterion. The stock market can be affected by various factors, such as: gold price, house price, and other macroeconomic variables (Yahyazadehfar and Babaie 2012).
32
become one of the precious gold to be traded. Based on Khan, Naseem, and Khan (2016) states that gold variously becomes a commodity to be used in the industry; it can also be the exchange commodity, and saving. Due to its superiority and the frequent trade, the price of gold is closely monitored by the economic factors. There is also the investor sentiments on picking put gold as an investment to acknowledge the importance of gold price (Omag 2012).
Gold is the kind of investment that firstly used as reserve if the instability occurs. Yet by the time goes, it is used as the primary goods for portfolio investment. The gold market in London is an international benchmark for gold trading. The price is set twice a day (AM & PM) under the surveillance from Bank of England. The regulator to decide the price is The London Gold Market Fixing Ltd.
33
B. Previous Study
The researches or studies on factors which affecting stock market have been conducted plenty of times. The studies are conducted in the domestic market or in the international markets. The findings show the various results in order to enrich the previous studies material. Here are a number of the studies on the factors affecting the stock market.
Based on the finding from Hsing (2011) shows that Czech stock market is negatively effected by the CZK/USD variable. The study is using the GARCH method in the research, and the scatter graph on the test shows the depreciation value of the Czech currency causes the stock market to decline. In the contrary, according to Barakat, Elgazzar, and Hanafy (2016) shows the positive relationship between exchange rate and stock market performance. However the evidence of non-relationship exchange rate on stock market is studied by Gay (2008).
34
dependent variable in the research. Another positive relationship between oil price and JII shows by the study from Rusbariand, et al. (2012).
The non-relationship between FTSE Malaysia and JII can be concluded from the study conducted by Husin, et al. (2013). However, the negative relationship between FTSE Bursa Malaysia and JII is explained by the research from Darsono, Muqorobin and Yudhi (2016). As for the positive relationship, the study between FSE Malaysia and IHSG can be seen from Jayanti, Darminto, Sudjana (2014). The positive relationship between gold price and stock market can be seen from the research conducted by Irianto (2002) that uses IHSG as the dependent variable. The negative relationship between gold price and JII is shown by the conducted by Putra and Damansyah (2015). The last is the non-relationship between gold price and stock market done by the research from Surbakti, Achsani and Maulana (2016). The dependent variable uses JCI (Jakarta Composite Index). C. Research Framework
Based on those theories and previous study, it will be revealed the relationship among independent variables on dependent variable along with the research framework. It can be seen as follow:
1. Effect of exchange rate towards JII.
35
of domestic currency gives advantages to the exporters. The
company’ shares likely affected the export-country. So that the
relation between stock prices and exchange rate is positive. 2. Effect of oil price towards JII.
If the stock market is efficient the increasing of oil price is likely negatively affecting the cash flow and in the end causing the declining return in stock market. Hence, the relation between oil price and stock market is negative.
3. Effect of FTSE Malaysia towards JII.
The regional capital markets are likely integrating on each other. The downturn in certain capital market will reduce the
return in other country’s stock market. Hence, the relation of
two variables is negative. 4. Effect of gold price towards JII.
36
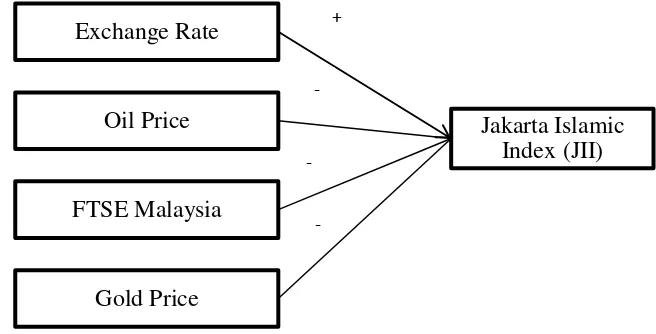
FIGURE 2.3
Research Framework
D. Hypothesis
Based on theoretical background, previous research results and research framework, this study develops the hypothesis:
1) Exchange rate has significant and positive impact on JII both in short-run and long-run.
2) Oil price has significant and negative impact on JII both in short-run and long-short-run.
3) FTSE Malaysia has significant and negative impact on JII both in short-run and long-run.
4) Gold price has significant and negative impact on JII both in short and long run.
Jakarta Islamic Index (JII) Exchange Rate
Oil Price
FTSE Malaysia
Gold Price
+
-
-
CHAPTER III
DATA AND RESEARCH METHODOLOGY
A. Data Collecting Method and Sources
This research aims to examine the effect of macroeconomic variables, FTSE Malaysia and gold price on Jakarta Islamic Index (JII) performance. This study employs secondary data on monthly basis starting from October 2013 until March 2016 taken from various sources. The following table represents the data variables and its sources.
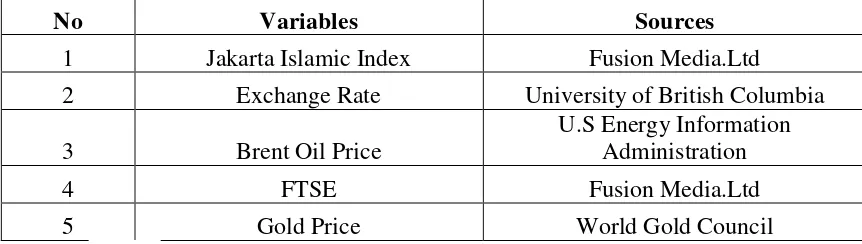
TABLE 3.1 Data and Sources
No Variables Sources
1 Jakarta Islamic Index Fusion Media.Ltd 2 Exchange Rate University of British Columbia 3 Brent Oil Price
U.S Energy Information Administration
4 FTSE Fusion Media.Ltd
5 Gold Price World Gold Council
This study also applies other relevant sources such as; journal, articles, books and website to enrich the information.
B. Econometric Model 1. Model 1
2. Model 2
ERt = A0 + A1JIIt-1 + A2ERt-1 + A3 Ot-1 + A4 FTSEt-1 + A5 Gt-1 +et
3. Model 3
Ot = A0 + A1 JIIt-1 + A2ERt-1 + A3 Ot-1 + A4 FTSEt-1 + A5 Gt-1 + et
4. Model 4
FTSEt = A0 + A1JIIt-1 + A2ERt-1 + A3Ot-1 + A4FTSEt-1 + A5 Gt-1 + et
5. Model 5
Gt= A0 + A1JIIt-1 + A2ERt-1 + A3Ot-1 + A4FTSEt-1 + A5 Gt-1 + et
Where JII is Jakarta Islamic Index, ER is exchange rate, O is oil price, FTSE is FTSE Malysia, G is gold price, and e1 is error term (t 1,2,3,4,5,6), l is lag length with t = 1,2…x and x is maximum lag.
C. Operational Definition
1. Dependent Variable.
Dependent variable or sometimes being called as response variable is the representative of the treatment outcome (Leroy
2011). Jakarta Islamic Index return is the dependent variable that is obtained from the monthly closing price. The return value can be obtained by this equation:
Rt = ln (Pt) – ln (Pt-1)
2. Independent Variables. a. Exchange Rate.
Exchange rate is that is used in this research is the monthly rate. The exchange rate is stated in USD/RP. b. Oil Price.
As the International oil price benchmark, Brent Oil Price is used in this research as the representative for oil price. It uses the monthly closing price of Brent Oil. c. FTSE Malaysia.
This variable is obtained from the monthly closing price of FTSE Malaysia.
d. Gold Price.
Gold price is the representative from commodity market. It uses the monthly closing price of gold price. D. Analysis Method
The method of analysis that is applied in this study are; Co-Integration test and Vector Error Correction Model (VECM) in order to see the relationship of four independent variables on the dependent variable both in short-run and long run.
(VECM), Impulse Response Function and Variance Decomposition Test. The thorough explanation will be explained as follow:
1. Unit Root Test.
Unit root test can be described as an estimation to test stationarity in time series data. A certain equation can be described having stationarity if a movement in time causes no change in the distribution. Unit root test contributes to the non-stationary variable (Andale 2016).
2. Lag Length Critera.
Lag is an important thing in VAR system. It functions to show how long the reaction from one variable to the other, the optimum lag also functions to erase the autocorrelation in VAR system (Firdaus 2011).
Lag length test can be identified by using Akaike Information Criterion (AIC), Schawrz Information Criterion (SIC),
Hanan-Quinn Criterion (HQ), etc.
3. Stability VAR Model Test.
4. Co-Integration Test.
This is the relationship between xt and yt that are both
co-integrated and contains unit root test (Sorensen 2005). Based on Horvath and Watson (1995) the most recognizable way to test the co-integration is by using Johansen method. The estimation on Johansen test functions to estimate the co-integration when two variables or more employ in the data (Dwyer 2015).
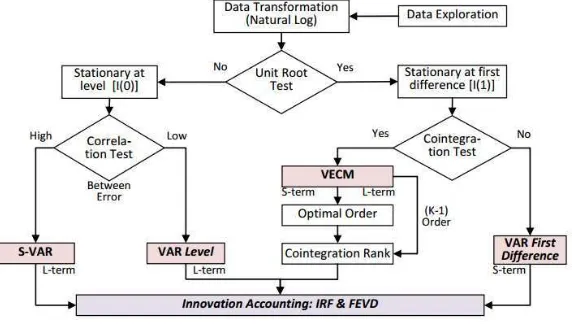
5. Vector Error Correction Model (VECM).
VECM specification restricts the long-run endogen variables relationship in order to stay convergent in the co-integration relationship, yet still regard the short-run relationship existence (Basuki and Prawoto 2016). The process to decide VECM method can be seen from the figure below
Source: Gujarati
FIGURE 3.1
6. Impulse Response Function (IRF).
IRF can explain the response of one variable to a shock from other variables. So, the influence of shock of one variable because of other variables can be explained clearly. The IRF result shows the length of time needed from one variable to response the others.
7. Variance Decomposition.
Forecast variance decomposition is the prominent tool in interpreting the linear and non-linear multivariate time series models along with the impulse response (Lanne and Nyberg 2014). Variance decomposition aims to estimate each variables contribution because certain changes on the system. This analysis also pictures the independent variables relationship on the VAR system due to the shock (Juanda and Junaidi 2012)
E. Research Outlines
In order to acknowledge and understand the research, this research is divided into a number of chapters respectively. The description will be explained thoroughly as follow.
1. Chapter I Introduction.
2. Chapter II Literature Review.
This chapter explains the theories regarding investment, Islamic investment, capital market, Islamic capital market, risk and return, stock market index, JII, exchange rate, oil price, FTSE Malaysia, and gold price. Another important thing is explained in this chapter is the previous studies. This chapter concludes the hypothesis and research framework.
3. Chapter III Data and Research Methodology.
This chapter explains the data and methodology, data collecting method and its sources, research model and definitions, operational definition of dependent and independent variables, and analysis method.
4. Chapter IV Research Finding and Discussion.
This chapter explains the overview of macroeconomics variables represent by exchange rate and oil price, FTSE Malaysia, gold price, and Jakarta Islamic Index. In this chapter, there will be the analysis of VECM analysis, the results, the analysis of empirical analysis comparing to the theoretical framework and previous studies.
5. Chapter V Conclusion and Recommendation.
CHAPTER IV
RESEARCH FINDING AND DISCUSSION
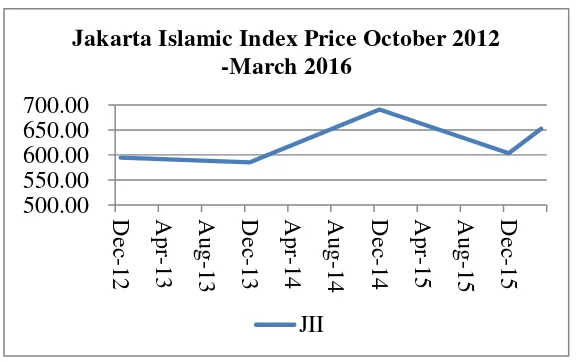
In this chapter, there are a number of tests on factors influencing Jakarta Islamic Index (JII) price in Indonesia. The dependent variable is Jakarta Islamic Index and the independent variables are exchange rate, oil price, FTSE Malaysia, and gold price. The variables are taken from November 2013 until March 2016. The approach is using Vector Error Correction Model (VECM). E-Views 7 will be used to run the data. Index (JII) is almost stagnant from December 2012 until December
500.00
Jakarta Islamic Index Price October 2012 -March 2016
2013. It starts with point of 594.79 in December 2012. In 2013 the price fluctuates. In March, the point increases to 660.34 and in December slumps to 585.11 point. Going into March 2014, the price increases to 640.41 point. As for December 2014 the price tips to 691.04. For 2015, the price goes to 728.20 point in March and reaches to 603.35 point. Lastly, in March 2016 the price goes to 652.59.
2. Exchange Rate.
Exchange rate becomes one of the indicators to show the strength
of one country’s economic.
Source: University of British Columbia FIGURE 4.2
Exchange Rate Movement October 2012-March 2016
Referring to the earlier graph, in December 2012 the rate listed in Rp9.642. Rupiah depreciates to Rp9.709 in March 2013 and in the end of the year it goes to Rp12.085. Coming into March 2014, Rupiah appreciates to Rp11.412 and depreciates to Rp12.433
Rp-Exchange Rate Movement October 2012 - March 2016
in December. Along in March 2015 it depreciates to Rp13.071 and went to Rp13.831 in December. On December 2015 it appreciates to Rp13.197.
3. Oil Price.
As a widely used commodity, oil price is a benchmark in a company performance. As well in stock market performance, it has important impact in it. Brent oil price is one of the international standards for oil industry.
Source: U.S Energy Information Administration FIGURE 4.3
Oil Price Movement October 2012-March 2016
In December 2012 the price is set Rp1.459.064/barrel. The price in March the following year drops to Rp1.445.471 and increases a little to Rp1.475.988 in December 2013. However in March 2014 the price flops to Rp1.432.278 and drops dramatically to Rp830.743 in December. It can be seen that in March 2015 the price continuously to slump with Rp744.790 and in the end of 2015
-Oil Price Movement October 2012 - March 2016
goes down to Rp506.521. Even in March 2016 the price downs to Rp509.186.
4. Gold Price.
One of the important commodities is gold. The price of gold is relatively stagnant. It doesn’t fluctuate frequently. The following graph is the price movement for gold.
Source: World Gold Council FIGURE 4.4
Gold Price Movement October 2012-March 2016
Gold price is commonly set per/ounce. Initially, the price in December 2012 is Rp16.264.068/ounce. The price weaken to Rp15.463.845 in March 2013 and goes to Rp14.780.146 in the end of 2013. Moreover, in March the following year the price increases to Rp15.253.877 and drops back to Rp14.942.203 nine months later. As for March 2015, the price surges toRp15.399.076 and flops to Rp14.813.554 in December. In March 2016, the price ups to Rp16.434.524
Gold Price Movement October 2012-March 2016
5. FTSE Malaysia
As for the regional Islamic Index, FTSE Malaysia is one of the leading indices. The price is higher than Jakarta Islamic Index (JII). Below is the movement since October 2012 until March 2016.
Source: Fusion Media.Ltd FIGURE 4.5
FTSE Malaysia Movement October 2012-March 2016
B. VECM Estimation Process 1. Unit Root Test.
The method which is used to test the stationarity is ADF
Test (Augmented Dicky Fuller) by using α=5%. If the value of ADF Test lower than MacKinnon critical value, it can be concluded that the data is stationary or having no unit root. The test will be conducted from level until first difference (Basuki 2017)
TABLE 4.1
Unit Root Test-Augmented Dickey-Fuller
Test ADF
Stationary -5.920507 0.0000 Stationary ER -1.25763 0.6399 Non
Stationary -4.915848 0.0003 Stationary O -0.468177 0.8869 Non
Stationary -4.226654 0.0019 Stationary G -2.523773 0.1178 Non
Stationary -5.572937 0.0000 Stationary FTSE -1.681915 0.4327 Non
Stationary -7.049091 0.0000 Stationary Source: Data processed
Because all variables are stationary in first difference; therefore the relationship among all variables will be conducted in VECM estimation.
2. Lag Length Criteria.
After conducting the unit root test, then it will continue to the lag length test. The lag optimum test is highly needed to reduce any autocorrelation in VAR model. The lag optimum test in VAR model can be recommended by Final Prediction Error (FPE), Akaike Information Criterion (AIC), Schwarz Criterion (SIC) and Hannan-Quin (HQ). Lag optimum occurs when a certain lag has
the most stars sign (Basuki and Prawoto 2016) TABLE 4.2
Lag Length Criteria
Lag LogL LR FPE AIC SC HQ
0 -1841.988 NA 9.39E+34 94.71731 94.93059 94.79384 1 -1672.834 286.2593 5.86E+31 87.32484 88.60450* 87.78397 2 -1638.25 49.65955 3.83E+31 86.83334 89.17939 87.67508 3 -1605.788 38.28877* 3.12e+31* 86.45066* 89.86309 87.67501*
Source: Data processed
3. Stability VAR Model Test.
To test the stability in VAR estimation, it will be the test for roots of characteristics polynomial. A VAR system is stable if all of the roots have modulus less than 1.
On the table below, the VAR model is already stable on its optimum lag, which is 1. So, the VAR estimation that will be estimated for the IRF and FEVD analysis is valid.
TABLE 4.3 Test of VAR Stability
Root Modulus
0.938848 - 0.060210i 0.940777 0.938848 + 0.060210i 0.940777 0.586029 - 0.397577i 0.708165 0.586029 + 0.397577i 0.708165 0.661301 - 0.172586i 0.683451 0.661301 + 0.172586i 0.683451 0.147559 - 0.499832i 0.521158 0.147559 + 0.499832i 0.521158 -0.112336 - 0.153049i 0.189851 -0.112336 + 0.153049i 0.189851
Source: Data Processed
4. Co-Integration Test.
TABLE 4.4 Co-Integration Test
Hypothesized
Eigenvalue Trace 0.05 Prob.**
No. of CE(s) Statistic Critical Value
None * 0.582392 107.4465 69.81889 0 movement from all variables have stability relationship and the long-term equal movement. In other words, on each short-term
No. of CE(s) Statistic Critical Value
5. Vector Error Correction Model Estimation.
VECM shows the short-term and long-term relationship. On short-term relationship, one variable tend to adapt with other variables to form the long-term equilibrium. This estimation uses lag 3 based on lag length criteria.
Cont Table 4.5
Cont Table 4.5
-0.01573 -63.4586 -402.032 -0.03013 -0.23915 [-0.54554] [-0.33352] [-0.30094] [-0.81331] [-0.61802] D(ER(-3)) 0.015768 -28.1425 -458.6889 -0.004101 -0.109304 -0.01603 -64.6756 -409.742 -0.0307 -0.24373 [ 0.98379] [-0.43513] [-1.11946] [-0.13355] [-0.44846] C -1.929404 -13327.87 28278.75 5.291293 128.6298 -4.62987 -18682.4 -118360 -8.86944 -70.4059 [-0.41673] [-0.71339] [ 0.23892] [ 0.59658] [ 1.82697] R-squared 0.715813 0.475305 0.585025 0.533761 0.486916 Adj.
R-squared 0.499289 0.075537 0.268853 0.178531 0.095995 Source: Data Processed
TABLE 4.6
Factors Influencing JII in Short Term
Variable Coefficient t-Statistic Coinnt Eq1 -0.512443 [-3.75989] D(JII(-1)) 0.425862 [ 2.42330]
According to table 4.6, in the short-term relationship, there are three variables significant in α=5%.
variable is gold in lag 2 which negatively influencing for about -2.42. It explains that an increasing of gold price on the previous two months will decrease the stock price for -2.42 unit. The last variable which significant is gold price in lag 3 which explaining an increase of gold price on the previous three months will decrease the price for -2.74.
TABLE 4.7
Factors Influencing JII in Long Term
Factors Influencing JII in Long Term
Variable Coefficient t-Statistic O(-1) 0.000262 [ 21.7305] G(-1) -6.78E-05 [-18.1313] FTSE(-1) -0.968418 [-27.8538] ER(-1) 0.066434 [ 21.5448] Source: Data processed
6. Impulse Response Function (IRF).
This test may describe the response from a certain variable due to the shock from other variables. Thus, the length of afterward shock effect until the effect is gone or return to the balance point can be seen from here. This test shows how long the time is needed from one variable to response the shock from other variables.
a. JII Response on Exchange Rate.
Source: Data processed FIGURE 4.6
Response of JII on Exchange Rate
b. JII response on Oil Price.
Source: Data Processed FIGURE 4.7
Response of JII on Oil Price
JII is positively response on oil price. However on the third period, it negatively responses on the shock from oil price. Since the fourth period until the tenth period, the response back to normal. Although in the eight period, the shock quite slumps. c. JII Response on FTSE Malaysia.
Source Data Processed FIGURE 4.8
According to table 4.8, JII starts to response on FTSE since the first period. In contrary, from the third period until the tenth period, the response tends to decrease dramatically. An increasing price from FTSE will be responded by an increasing price from JII. d. JII Response on Gold Price.
Source: Data Processed FIGURE 4.9
Response of JII on Gold Price
Table 4.8 shows that JII starts to response on gold price positively since the first period. It keeps increasing until the third period. Meanwhile on the fourth period the response slumps a bit. The response keeps increasing since the fifth period until 8th period. Since then, the shock is decreasing until 10th period.
7. Variance Decomposition.
This test aims to know how the variance from variable is
Malaysia, it 0% affects JII in the first period and in the tenth period it impacts on JII by 2.05%. Lastly, exchange rate is 0% affected JII while in the tenth period it impacts JII by 2.70%.
C. Discussion
1. VECM in Short Term.
In the short term, the estimation indicates that oil price in 3rd lag is significantly influencing JII with the positive relationship by 0.000133. Meaning an increase in oil price will increase JII by 0.000133 unit. The positive relationship on the short period triggers the positive confidence of investors of mining sectors that significantly affect JII. The positive relationship might happen because Indonesian capital market is dominated by the mining sector with 39.7 percent. Because the stock market is dominated by the foreign investors with mostly invested in mining sector, thus an increasing in oil price will increase the stock price in mining sector and impact to the stock market in Indonesia. It is in line with the research from Rusbariand, et al. (2012) and Antonio, Hafidhoh and Fauzi (2013).
investment with free risk, so when economic instability occurs in the short run, investors tend to pick out gold as an investment. FTSE Malaysia is 1st, 2nd or 3rd lag has insignificant effect JII. The result is found in the study conducted by Husin, et al. (2013). This might happen because the changes in unit of FTSE Malaysia in short term do not give huge effect to the investors on putting their assets in JII. Their confidence level can still be maintained pretty well. It might also be caused of the regional market which has the same investors’ characteristics.