STUDY OF STREAMLINE AND EDDY CURRENT BEHAVIOR
IN SUDDEN ENLARGEMENT CIRCULAR PIPE
Sarjito
Mechanical Engineering Department, Muhammadiyah University of Surakarta Jl. A.Yani Tromol Pos I Pabelan, Kartosura
E-mail: [email protected]
ABSTRACT
The steady and unsteady flow through sudden enlargement circular pipe was studied experimentally and computionally both in one and two-phase flows. In this paper, the CAD model of Computational Fluid Dynamic method was selected to investigate of properties flow distribution. The models designed in Solid Works and analyzed by exemploying Computational Fluid Dynamics (CFD) package. At the end, the streamline of model is compared with current data secondary that has been measured experimentally. Improving flow-rate and selecting an accurate turbulence model for predicting flow separation were also studied. Eddy current behavior during enlargement, maximum speed and length of circulation were calculated in detail as an initial steady state simulation. Full model of the pipe produced in an appropriate domain to look at the laminaer and turbulence behavior at the front and rear of the enlargement in different time steps. It was found that the flow-rate quality had a great influence to convergence and changed Eddy current length. In particular, it is important to have estimates of pressure drops along pipe, lift and side force characteristics at an early stage in a design. It was also determined that the pipe geometry parameters (edge, ratio of diameter, front side, inner body surface, rear end tail extension and underbody roughness) had a significant role in shifting laminar, turbulence and Eddy current behavior of the flow in pipe. Controlling the length, drag and pitching moment needs a great understanding of the fluid dynamics around the pipe. Keywords: Suddent enlargement - Eddy current - two-phase flow - CFD
Introduction
The experimental of flow pattern both of one and two phase flows in suddent enlargement has been studied. “The pressure drop of sudden enlargement especially in two phase flow is still difficult to be determined analytically. Eventhough considerable advances have been made over recent years in computational fluid dynamics (CFD),
pressure drops has remained impossible to predict by these methods, at least not with accuracy needed for decision making”
solutions to the problem of the external airflow over vehicle shapes. For such techniques to be use within the automotive design process, not only must the solutions provide useful aerodynamic information, but also they must be successfully integrated into the design process (Gonbadipoor N., Simpsom G and Yufeng Yao, 2006).
Two forms of the equations governing incompressible flow are used commonly; either the full Navier-Stokes equations that describe incompressible viscous flow or a reduced set of equations that describe potential flow with modifications to allow for wakes.
In this paper, new experience has also been doing by computational fluid dynamics (CFD) to predict Eddy current, streamline behavior and velocity distributions in sudden enlargement.
CFD in design process
Designing of pipe system is a process that can be carried out in many ways. At present, it is common that the master model of pipe system is in fiberglass full-scale model. For an initial prediction of the streamline characteristics, models were tested in section model, the pressure drop surface data, which was used to generate pressure along pipe, were using pitots. The model now could be developed mathematically on a computer aided design (CAD), rather than use the more time-consuming full-scale and fiberglass approach model. This made the experimental and to be computational properties essentially identified and continued.
Computational techniques can be used to evaluate the pressure drop performance in a pipe system at any stage if a mesh of the surface. At present a representation of a
pipe’s surface can be made by a digitizer, however, equipment is limited. Further development, data produced from the survey can then be used to produce surfaces measurement within a computer-aided design (CAD) database.
If the CAD data is produced first, then both computational meshes and pipe models can be built from the same database and then computational predictions along pipe evaluations of a streamlines made. With this capability it is important that the treamline information, be it piped-or computer-produced, can be obtained quickly and relayed back to the designers, so it can be assessed and the pipe shape refined if necessary. The advantage of such a process in terms of the reduction in time taken to produce a design is obvious. However, if CFD is to contribute to the full in this process it must be possible to take the CAD data and build computational models from it, as well as to produce sensible flow pattern predictions.
Area of study
The aim of this research is to simulate streamline along sudden enlargement horizontal circular pipe. This case study is concentrated to the flow disturbances leading to length formation related to steady state simulation and transient simulation. It also looks at the laminaer and turbulence structure, wake and trailing vortices formation. After generating the CAD model in the SOLIDWORKS, the CFD settings are applied which are: • Discretization of pipe surface or the
computational domain, termed “preprocessing”.
0 500 1000 1500 2000
1 3 5 7 9 11 13
Reynold Number (Re)
L
e
n
g
th
o
f
E
d
d
y
C
u
rr
e
n
t
(X
l)
Sarjito (2002) Rino (2004) Sheen et al. (1997)
• A suitable graphic representation of the
numerical results, termed
“postprocessing”.
Initial computations on the maximum speed, velocity coefficient and pressure coefficient will be done in the steady state simulation. At the end, computational result to be compared to the full scale experiment results
Literature review
Durst dan Whitelaw (1978), Fearn, Mullin dan Cliffe (1990), Durst, Preira dan Tropea (1993) and Sarjito (2002) reported that, laminaer flow in 2-D viscous toward simetric sudden enlargement pipe with enlargement (S) oulet and inlet ratio of 2:1 and 3:1 has similar size and pattern simetrically around the angle of enlargement. The length of circulation areas was influenced by Reynold number (Re).
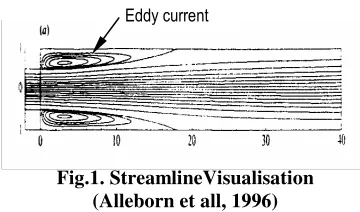
Alleborn et al. (1996) analyzed numerical 2-D way incompressible flow viscous in sudden enlargement. As a continuation method namely Arnoldi-based Iterative Method for calculating Eigen pattern, yet, the result was unstable. The visualization of streamline resulted by Allborn et al (1996) is shown in fig.1
Fig.1. StreamlineVisualisation (Alleborn et all, 1996)
Sheen et al. (1997), within Sarjito (2002) described, there are 4 patterns, all of these depend on the Reynold number,
and wich are: open anular flow, closed anular, vortex shedding dan stable central flow.
Huang and Darve (2000) within Sarjito (2000) reported that, helium flow in suddent enlargement and was applicated in heat exchanger shows at the fig.2.
Fig.2. Mass flow rate Vs Pressure Delta (Huang and Darve ,2000)
Sarjito, Rino and Effendy (2004) did investigation of internal one and two phase flows performance, the experiment was to predict of pressure drop along of suddent enlargement pipe horizontally. The result of experiment showed that length of Eddy current around the enlargement was influenced by Reynold number. Conclusion of the experiment was described both in analytical and visualitation. Information for gaining the visualitation, some of liquid colour was used. Correlation between Reynold Number and length of Eddy current can be seen at fig.3
Fig.3. Re Vs length of Eddy current (Xl) (Sarjito, Rino and Effendy, 2004)
In the last decade, piping system has become an important design consideration. More recently, however, as inefficient system has been reduced in order to improve economy value, there has been increased interest in the role of fluid dynamic.
It is believed that, computational fluid dynamic (CFD) is a tool that widely used in industry; however it is a tool that requires significant understanding in its application. It will be a very powerful tool for experienced engineers. It is easier to generate inaccurate results than useful ones. It has come out as a modern alternative for reducing the use of experimental in piping engineering. CFD is now being intensively applied to various stages of fluid dynamic piping design; simulation will be made as well as in this research.
Theorytical Review
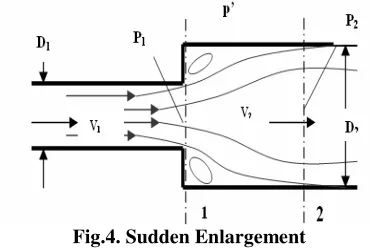
It’s generally accepted that, internal flow through the enlargement, head looses will be influenced by two aspects, e.i. major and minor looses. Looses of hydraulic energy will also encounter due to the head looses. Therefore, in sudden enlargement, pressure increase from P1 to P2, while, velocity reduce, from v1 to v2 around the enlargement, circulation happen namely Eddy Current.
Fig.4. Sudden Enlargement
Whilst, the pressure drops can be represented:
∆Pf =
ρ
.g.∆hf (1) Where:hf = Friction looses (m) that can be stated as:
hf = f
g
D
V
L
2
.
.
2(2)
if D = 4R, substituted to equation 3, the equation will be:
hf =
g
R
V
L
f
2
.
.
4
.
.
2(3)
where :
f = friction factor L = pipe length (m) g = gravitational ( 2
s
m )
R = jari-jari penampang persegi (m)
In other way, losses in enlargement pipe can also be determined the equation .4
Hs = (
γ
1
2
h
h
−
) + (
6
,
19
2 2 2
1
V
V
−
) (4)
Where :
Hs = Pressure defferentiation h1 = Suction head
h2 = Discharge head V1 = Inlet velocity V2 = Outlet velocity
The Numerical Model
approximations of N-S equations which are then unenable to numerical solution.
There are a number of different solution methods which are used in CFD codes. In most common, and the one on which Cosmos Flow Work based, is known as the finite volume technique. The basic steps of CFD computation are essentially: a) Discreetization of the domain or body surfaces, termed “preprocessing”. b) Computation for each control volume, temed “solving”. c) Graphical representation of the numerical results, “postprocessing”
B
BBaaasssiiiccc EEEqqquuuaaatttiiiooonnn FFFooorrr IIInnnvvviiisssccciiiddd C
CCooommmppprrreeessssssiiibbbllleeeFFFlllooowww
First, the mass conservation for incompressible flow Invicid fluids:
V. A = constant (5)
Where A denotes the local cross-section of a small stream-tube and the V is the local velocity, which is assumed to be constant across A. This equation shows narrow distances between streamlines in region of high velocity and vice versa. Furthermore, the integration of the momentum equation along streamlines for incompressible flow leads to
pt= p +1/2
ρ
w
2= constant (6)This is Bernoulli’s equation, which relates the pressure p and the velocity w along the streamline (p is the static pressure,
2
2
/
1
ρ
w
is the dynamic pressure, and ptis the total pressure). In Inviscid flow, the sum of static pressure and the dynamic pressure is constant along a streamline. Eq. (8) indicates low pressure in regions of high local velocities and vice versa. Effect of ViscosityThe development of the flow field is strongly influenced by the viscous flow
inside the thin boundary layer at the wall. The occurrence of drag in two-dimensional incompressible flow can be explained only by these viscous effects.
T
TThhheee LLLaaammmiiinnnaaarrr AAAnnnddd TTTuuurrrbbbuuullleeennnttt B
BBooouuunnndddaaarrryyyLLLaaayyyeeerrrDDDeeevvveeelllooopppmmmeeennnttt
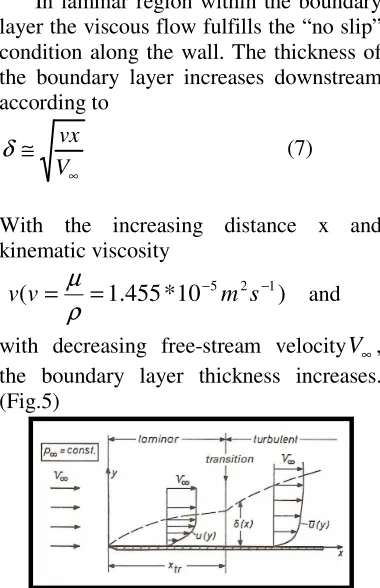
In laminar region within the boundary layer the viscous flow fulfills the “no slip” condition along the wall. The thickness of the boundary layer increases downstream according to
∞
≅
V vx
δ
(7)With the increasing distance x and kinematic viscosity
)
10
*
455
.
1
(
v
=
=
−5m
2s
−1v
ρ
µ
and
with decreasing free-stream velocity
V
∞, the boundary layer thickness increases. (Fig.5)Fig. 5. Boundary layer profile along thin flat plate.
all three coordinate directions. The velocity component parallel to the wall in the Fig. 5 is thus
U (y, t) = u(y)+u′(y,t) (8)
And u(y)is defined as
)
(y
u = +∆
∆ t t
t u y t dt
t
0
0
) , ( 1
(9)
Therefore, in addition to the shear stress caused by molecular friction according to Eq 11, a shear stress due to turbulent mixing
v
u
turb
=
−
ρ
′
′
τ
(10)is present. The expression of u′and
v′stand for velocity fluctuations in x- and y- direction and u′v′is the time-average derived from Eq. (11). Therefore the boundary layer thickness along the flat plate in Fig. 5 increases more rapidly downstream of the transition point as
5 5
4
)
(
x
V
v
∞
≅
δ
(11)Result and Discussion
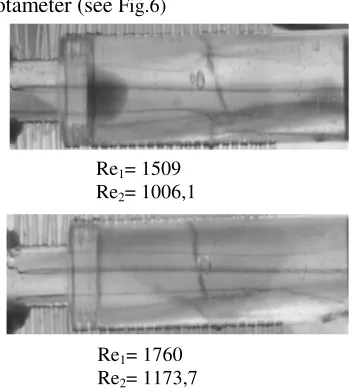
Firstly, discussion will be in trajectories of experimental visualisasion and computational. As we can see at the stream line that, the trajectories visualization seems straight on the enlargement 1,5 : 1 with the length of circulation zones X1, and enlargement height between inner small pipe to inner large pipe (H) is the function from Re, on mass flux (G) = 4,733 kg/m2sec. to (G) = 13,253 kg/m2sec. With X1/H in a row 20,7 ; 20 ; 11,02 ; 7,87 and 3,14 while on the ratio 2 : 1 and 2,5 : 1 the relation Re to X1
and H is difficult to see as the limitation of test section and equipment apparatus as well as precision pressure gauge and rotameter (see Fig.6)
Fig.6. Trajectories visualisation single phase flow in S = 0.4 experimentally
(Sarjito and Indarto, 2002)
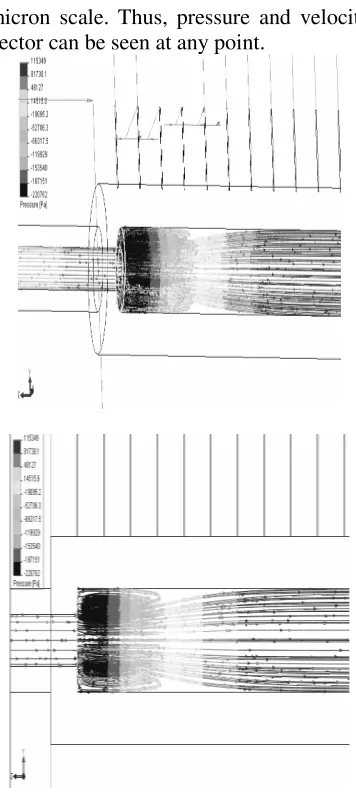
Whereas, trajectories in computational can be visualized attractively in 1D, 2D and 3D. It also can be presented in colour which represented pressure and velocity differences each place and aech point; however, there are not clearly shown relationship between length of circulation zones X1, is the function from Re, nonetheless, in one case saw as fig.7 relationship L1, H and Re. It seems that this relation has not been specifically identified (see Fig.7). For information, tajectories in computational shows smoother than experimantal trajectories, whilst, problem was encountered when install of collumn manometer in experimental, hence to measure of pressure in experiment is not as easy as computationally. Meanwhile, computational provides meshing grade in
micron scale. Thus, pressure and velocity vector can be seen at any point.
Fig.7. Trajectories visualisation single phase flow in S = 0, 4 computationally
Secondly, discribe of pressure distribution both in experimental and computational, the result of pressure measurement and calculation of distribution along pipe shows that the pressure drops increase with the increase of mass flux (G) and quality (x). The pressure drops on the homogen flows assumption or single phase is bigger than
the separate flow assumption by using Chisholm theory.
Fig.8. Profil of static pressure distribution along pipe single phase S = 0.4 experimentally (Sarjito and Indarto, 2002)
Fig.9. Profil of static pressure distribution along pipe single phase S = 0.4
computationally
The graphs show that both of experiment and computational have the similar trends, but, as can be seen that graph which has been made based on experimental is not as smoth as computational and the graph in experiment at suction pipe, such pressure distribution was fluctuating operation due to unsteady condition and compression flow, as well as in discharge line. On the other hand, graph that has been produced by computational, related with the Navier Stoke’s equation
3, " +
and refer to computational difference method both in implicit and explicit shows, pressure start from leading edge was steady decreased along pipe until the enlargement pipe, since than, pressure was sicnificantly increased, however, pressure will shortly decreased until trailing edge. It is beleived that, pressure drop was influenced by minor and major head losses. Furthermore, in computational there are some ways could be used, as well as in generating and meshing of geometry, whereas, CPU time for analyzing depend on the meshing and generating grade.
CONCLUSION
It is understandable that, by using computer aided design (CAD) and computerized fluid dynamic (CFD), analyisis of fluid dynamic can be done easily. The result can also be gained attractively and precisely. This is important and useable to make comparative study within experimental study.
ACKNOWLEDGEMENTS
This paper was supported by Dr.Dani Harmanto from Derby University UK and Dr.George Simpson from Kingston University UK.
REFERENCES
Alleborn , 1997, Further contributions on the two dimensional flow in sudden expansion, International journal Fluid Mechanics,vol 330, pp 169-188,Cambridge University Press
Chistine Darve, 2000, US-IT-HXTU Pressure drop distribution,http://WWW_bd New.fnal.Gov / Cryo-darve/het exchanger
Gonbadipoor N., Simpsom G and Yufeng Yao, 2006, Steady And Transient Simulation Of Aerodynamic Behaviour around The Body, M.Sc. Thesis, Kingston University, London
Sarjito, 2002, Studi aliran dua fase gas-cair melewati perbesaran saluran secara mendadak penampang lingkaran, Tesis S-2, Jurusan Teknik Mesin Universitas Gadjah Mada Yogyakarta