Abstract--The unbalanced conditions are taken into account in the Volt/VAr control of distribution system. The aim of the control is to simultaneously minimize energy loss and improve voltage profile. The optimization may be achieved by optimal dispatch of Load Tap Changer (LTC) and shunt capacitors considering system unbalanced. A Genetic Algorithm (GA) is developed to determine the load curve division useful for effective LTC scheduling and switching constraint satisfaction. GA is also appointed for the dispatch due to the ability of simultaneously scheduling the devices and checking the fulfillment of switching constraints prior to performing calculations. The algorithm is further enhanced by including fuzzy approach into the existing GA procedure. For power flow analyses under unbalanced conditions, Forward/Backward Propagation Algorithm is developed. The optimization is implemented on the IEEE 34-bus unbalanced distribution system. The advantages of fuzzy inclusion are highlighted. The main contribution is inclusion of unbalanced system conditions into the optimal dispatch problem.
Index Terms-- Forward/Backward Algorithm, Fuzzy procedure, Genetic Agorithm, LTC, optimal dispatch, shunt capacitors, unbalanced conditions, volt/VAr control
I. INTRODUCTION
ITH the constantly changing of electricity load, the operation of distribution system has become quite complicated. If not carefully managed, load variations may result in electricity demand not being fully satisfied, unacceptable quality of the electricity supplied to the customer, voltage violation and extensive power losses. The operation planning is therefore necessary to satisfy the demands in both technically acceptable and economically optimal. One of the planning strategies is optimal volt/VAr control in distribution system for the prevention of voltage violation and power loss escalation. This may be carried out by scheduling Load Tap Changer (LTC) and shunt capacitor. The planning objective is to keep the voltage within the preset limits under changing load conditions while minimizing power losses.
Optimal volt/VAr control is a well-researched topic. It has been solved using a number of methods resulting in satisfied results [1-4]. However, the optimization is so far carried out by simply assuming that both loads and systems are balanced. Therefore, such analyses are performed for single phase. Distribution systems are inherently unbalanced, due to factors such as the unbalanced customer loads, the occurrence of unsymmetrical line spacing, and the
combination of single, double and three-phase line sections. Therefore, three-phase model of distribution system is required to represent the system more accurately. However, inclusion of system unbalance will increase dimension and complexity of optimal dispatch problem as all three phases need to be considered.
This paper proposes volt/VAr control taking unbalanced conditions into account. The optimal load interval division approach [5] is used to assist LTC dispatch schedule. A robust three-phase power flow using forward-backward propagation algorithm [6] is developed and used as backbone of optimization algorithms. Two GAs are developed in this study to respectively determine the optimal load intervals and optimal dispatch schedule of the controlled devices. A fuzzy approach is incorporated into the GA for optimal dispatch schedule to further enhance the optimization results. The optimizations are presented for IEEE 34-bus unbalanced distribution system including LTC with 15 taps and 13 shunt capacitors. The application of different load curves for every phase is also studied.
II. THREE-PHASE POWER FLOW
Distribution system is commonly constructed as radial system or sometimes weakly meshed system with high R/X ratio. These characteristics are the well-known obstacles that may cause the sophisticated power flow algorithms fail to converge. When R/X ratio increases, power flow iteration becomes unstable and may even diverge. Power flow analysis for unbalanced systems is therefore complicated requiring a robust power flow algorithm.
This paper uses forward-backward propagation algorithm for unbalance power flow analyses [6]. The algorithm works directly on the system without any modification. Conversion of load and shunt elements into their equivalent injection currents is necessary to form the equivalent bus injection currents. Distribution line charging is usually too small to be included [7]. The algorithm offers robust and good convergence characteristics for radial distribution system [6].
The accuracy of three-phase power flow results greatly depends on the system components model and, therefore, the proper model of line section, load and shunt admittance need to be firstly established. The model of distribution line feeder in [8] is developed and used in this paper. The three-phase load and shunt capacitors are represented by their
Application of Genetic Algorithms and
Hybrid Fuzzy-Genetic Algorithm
for Optimal Control of LTC and Shunt Capacitor
on Unbalanced Distribution System
Agus Ulinuha
*, Hasyim Asy’ari
*, Agus Supardi
**
Department of Electrical Engineering, Universitas Muhammadiyah Surakarta Ahmad Yani ST, Pabelan PO Box 1, Kartasura, Surakarta
equivalent injection currents using the model developed in [9].
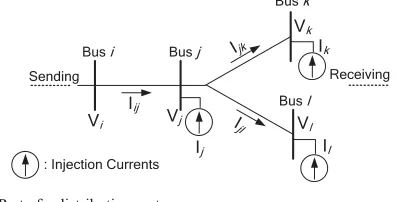
With the components model in hand, the algorithm starts with mapping the distribution network to determine the forward and backward propagation paths. The backward and forward propagations are used to calculate branch current and bus voltage respectively. The calculations may be explained in Fig. 1 and eqs. (1) and (2).
Fig.1. Part of a distribution system
From Fig. 1, the relationships between branch currents and injection currents are:
k
where Ijk is the current flowing through the line section from bus j to bus k, and Ij is injection current at bus j. The bus voltages may then be obtained using the following equations: updated and bus injection currents are again calculated. The outlined calculations are repeated and the calculation converges if the different of bus voltages for the consecutive iterations is no more than the prescribed tolerance. Power loss calculations taking the difference between power in and
power out per phase is used instead of usingI2Rthat may result in errors [8]. All calculations are carried in the three-phase frame.
III. PROBLEM DESCRIPTION
The objective of volt/VAr control is minimization of energy loss for 24-hour period.
min P Q T t
where Ploss,3Iis the total three-phase real power loss at hour t as a function of Qt and Tt that are the status of shunt capacitors and tap position of LTC, respectively. While, 't
is time interval that is normally taken as 1 hour. The aforementioned objective function is subjected to the following constraints:
x Voltage constraint
VimindVi,abcdVimax (4)
where Vi,abc is the voltages of bus i for phase a, b, c that are required to be within the minimum Vimin and
maximum Vimax bus voltage limits.
x Maximum switching operations of LTC T maximum limit of LTC daily switching.
x Maximum switching operations of shunt capacitors
C C Kc n nc the maximum limit of capacitors daily switching. While
nc is the number of shunt capacitors.
IV. SOLUTION PROPOSED
The interdependence between bus voltage and capacitor setting makes the optimization problem very complicated. The switching constraints makes computation very intense, as they can only be confirmed after evaluating the dispatch for the scheduling period [10, 11]. Taking unbalanced conditions into account will further increase the problem dimension.
To effectively satisfy the LTC switching constraint, load curve partition is employed. For the optimal dispatch problem, GA is developed for simultaneously scheduling the controlled devices and confirming the switching constraints prior to performing calculations. The algorithm is further enhanced by integrating fuzzy approach into the existing GA. As the backbone of the optimization problem, a robust forward-backward propagation algorithm is developed for system analyses under unbalanced situations.
A. Load Interval Division
Curve of Real Load
0
Curve of Reactive Load
Fig.2. Typical daily load patterns (a) real and (b) reactive loads [12] Fig. 2 shows the different load patterns for both real and reactive parts[12]. Load interval division is determined based on the minimum loads variation in the interval. A number of intervals need to be given and determined. The intervals can then be used for effective LTC dispatch scheduling where the tap position remains constant during an interval and may alter at the different interval. With highly accurate load forecasts provided by the modern techniques [13-15], the LTC dispatch may be precisely determined.
A GA is developed to identify the start and the end of each interval. The chromosome representing a possible intervals combination may be constructed as:
010
The chromosome
5 3 ... 2 m The substring value 1st 2nd … nth m The n intervals
A chromosome includes a number of binary substrings depending on the interval number. Every substring corresponds to the value indicating the length of an interval. The sum of all substring values denotes the total length of the entire interval, which is 24 hours. If the length of substring is 4, as the abovementioned case, the length of chromosome is n u 4 where n is the number of interval assumed. The population consists of some chromosomes and every chromosome is evaluated using the following fitness function:
Where Fmax is constant that converts fitness function to standard form, Ptl and Qtl are active and reactive load at tth hour of the lth load interval, PAl and QAl are average active and reactive load at lth load interval. li is number of hour at
lth load interval and n is number of interval for the whole load period.
B. Optimal Volt/VAr control using GA and GA-Fuzzy
With the optimal load intervals in hand, the possible hourly LTC tap position can be determined. The construction of chromosome for LTC tap scheduling is:
010
The chromosome
5 6 ... 10 m The substring value 1st 2nd … nth m The n intervals
The number of binary substring depends on the load interval number. The substring value denotes a tap position number with the duration determined by the obtained interval. It is assumed that the difference between the consecutive LTC tap positions is no greater than 15 [5] and, hence, the substring of 4 bits is used. The eligible chromosome to have sum of substring values no more than the maximum allowable LTC switching operation.
The switching operation of shunt capacitors at substation is limited by a preset number. The chromosome representing
the switching schedule for the capacitors contains some substrings where, every substring denotes a 24-hour switching status for a capacitor. If the tthbit is 0, the status of the related capacitor at hour tis “off”. Therefore, the length
of every substring is 24 bits and the length of chromosome for sc capacitors is scu 24 bits. The chromosome is eligible if the switching number in every substring is no more than the maximum switching limit.
Shunt capacitors at distribution feeders are normally allowed to be switched “on” and “off” once a day [5]. The substring that represents a capacitor schedule can be formed by two segments denoting the switch on time and the “on”
duration, respectively. As the latest time to switch it on or
the maximum “on” duration is 24, a segment of 5 bits is used
and, therefore, the length of substring is 10 bits. For the following substring example:
0010 0
0110
1 m
The substring
4 13 m The segment value 1st 2nd m The segment The associated actual schedule is 000111111111111100000000.
The eligible substring is that, which has total segment value of no more than 24. An eligible chromosome is formed by a number of eligible substrings. The length of chromosome for fc feeder shunt capacitors is fcu 10.
The final eligible chromosome representing the 24-hour scheduling of LTC and shunt capacitors is consecutively constructed by the eligible chromosomes for LTC, substation shunt capacitors, and feeder shunt capacitors. For the optimization problem where the number of load interval assumed is n, and the number of substation and feeder shunt capacitors are respectively sc and fc, the length of chromosome is n u 4 + sc u 24 + fcu 10. The population consists of some chromosomes according to the predefined population size. Assessment of every single chromosome requires running power flow for 24 times. For volt/VAr control using GA, the chromosome is evaluated by the following fitness function.
»»wv are weighting function for real power loss and voltage deviation, respectively.
For inclusion of fuzzy into the developed GA, membership functions are established for chromosomes assessment in term of objective achievement and constraints fulfillment. This configuration forms a multi objective optimization problem and its application on GA enables the algorithm maintaining the promising chromosomes while improving the solutions [16, 17]. Various membership functions have been examined and the most suitable membership functions are selected and used in this paper.
the compensated system increases. Furthermore, if the loss of compensated system is even higher than that of uncompensated system, then the zero membership is given. The membership function is shown in Fig. 3 and expressed in (10).
Fig.3. Fuzzy membership function for real loss reduction
°¯
where P~loss is membership of loss reduction, while loss0
and loss are loss for uncompensated and compensated system, respectively.
For voltage regulation purpose, a membership function that maintains voltage levels as close to the preset value as possible is employed. This paper uses an exponential decreasing membership function as shown in Fig. 4 and expressed in (11).
V
Fig.4. Fuzzy membership function for bus voltage regulation
V V e '
' 100
~
P (11)
whereP~'V is the membership for voltage regulation and ∆V
is the absolute phase voltage deviation to the preset voltage. For minimization of LTC tap displacements, the maximum and the average daily tap movements are considered in constructing LTC membership function [18]. The average value may be taken from the past experience while the maximum value is determined considering LTC maintenance cost and LTC expected lifetime. The LTC movement up to the average number is therefore completely accepted. This is intended to not strictly limit the LTC movement causing voltage control difficulties. However, frequent LTC movement more than the average number may return lower membership value. Furthermore, LTC movement more than the maximum permitted number results in zero membership indicating that it is unacceptable. In this paper, the average daily LTC movement of 8 is used and may be changed depending on the practical situation. While, the maximum allowed LTC movement is set to 30 taps. The membership function implementing the aforementioned control purposes is given in Fig. 5 and expressed in (12).
1
Fig.5. Fuzzy membership function for LTC switching minimization
maximum permitted LTC movement, respectively. The switching limits of substation and feeder shunt capacitors are typically small and there is no advantage to fuzzify them; therefore, these switching constrains are calculated as crisp constraints.
The abovementioned membership functions are clearly intended to reward the high membership values for the most preferred operating conditions. Therefore, the fitness function of the proposed GA-Fuzzy is simply constructed by maximizing the membership values rewarded by the membership functions. In comparison with the fitness function of GA (9), the fitness function of hybrid GA-Fuzzy (13) does not need normalization and is therefore simpler.
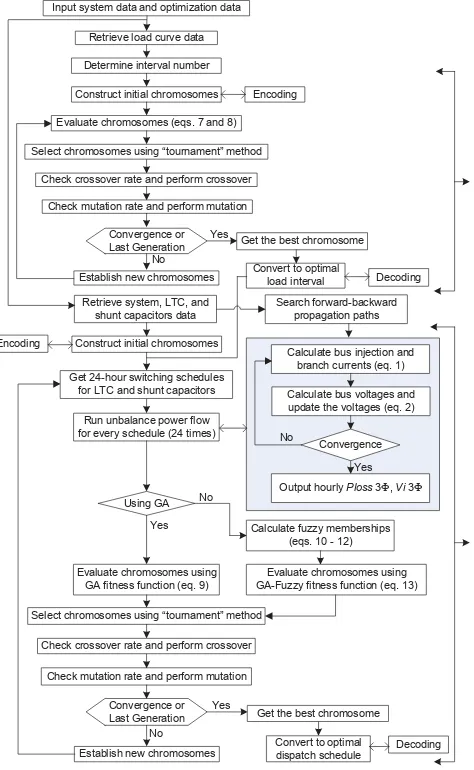
» voltage, and LTC switching, respectively. Index i refers to the bus ID and index t refers to the hour. Hence, index itdenotes the condition of bus i at hour t. The evaluation of every chromosome using the abovementioned fitness functions requires running the harmonic power flow for 24 times. Flowchart of load curve partition using GA and optimal dispatch of LTC and shunt capacitors using GA and GA-fuzzy is shown in Fig. 6.
V. RESULTS AND DISCUSSION
A. The Evolutionary Strategy of GA
The initial chromosomes are randomly generated and selected for constructing the initial population. The selected chromosomes are those, which satisfy the switching constraints. The selection of parents for crossover uses tournament method and the children are generated by one-point crossover from their parents [19]. The probability of crossover and mutation are fixed throughout the generation as well as the weighting functions. Detail of optimization parameters is given in Appendix (Table A).
generate a slight different results and, for a fair result comparison, a maximum of two runs are applied for the different optimization cases and the better result is taken to be presented and analyzed.
B. The System Data
The optimizations are carried out for the IEEE 34-bus unbalanced distribution system [6] using GA and GA-fuzzy. Some modifications are made to demonstrate the effectiveness of the optimal dispatch scheduling. These include system loads doubled and more shunt capacitors involved. The loads of each phase are set to be different and change following the different load curves of Fig. 2. However, for comparison purpose, the same load curve (load a) is firstly used for all phases. The system is shown in Fig. 7 and the data is available in [6]. The shunt capacitor data is given in Table 1 and the load data is given in Appendix (Table B).
Input system data and optimization data
Retrieve load curve data
Determine interval number
Evaluate chromosomes (eqs. 7 and 8)
Select chromosomes using “tournament” method
Check crossover rate and perform crossover
Convergence or
Check mutation rate and perform mutation
Get the best chromosome Encoding
Convert to optimal
load interval Decoding
Retrieve system, LTC, and shunt capacitors data
Construct initial chromosomes Encoding
Evaluate chromosomes using GA fitness function (eq. 9)
Select chromosomes using “tournament” method
Check crossover rate and perform crossover
Convergence or Last Generation
No
Establish new chromosomes Yes Check mutation rate and perform mutation
Calculate bus injection and branch currents (eq. 1)
Get the best chromosome
Convert to optimal
dispatch schedule Decoding
Calculate bus voltages and update the voltages (eq. 2)
Convergence No
Using GA
Yes Calculate fuzzy memberships
(eqs. 10 - 12) No
Get 24-hour switching schedules for LTC and shunt capacitors
Run unbalance power flow for every schedule (24 times)
Evaluate chromosomes using GA-Fuzzy fitness function (eq. 13)
Output hourly Ploss 3), Vi 3) Yes Search forward-backward
propagation paths
Fig.6. Flowchart of load curve partition using GA and optimal dispatch of LTC and shunt capacitor for unbalanced system using GA and GA-Fuzzy
TABLE 1
THE SHUNT CAPACITOR DATA FOR THE IEEE34-BUS SYSTEM
Capacitor Bus Location Connection kVAR
C1 802 Y-grounded 100
816 818 820 822
824
852 832 858 864
888
890
834
860
842 844 846 848
836
Fig.7. The IEEE-34 bus unbalanced distribution system for simulations
C. Simulation Results
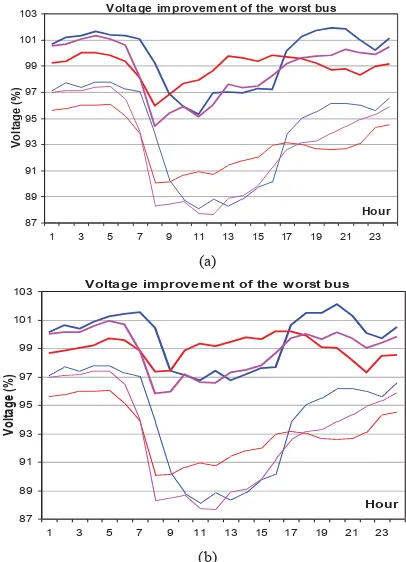
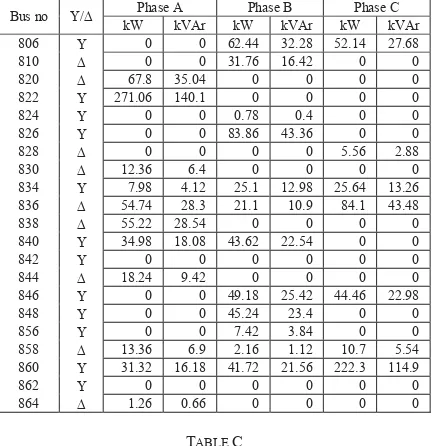
The optimizations are firstly carried out for the system loads changed to follow the same load pattern (load a, Fig. 2) and then extended to follow load a, b, and c patterns of Fig. 2 for the loads of phase a, b, and c, respectively. Due to the space limit, only one schedule is displayed for illustration purpose (Appendix, Table C). However, all generated schedules have been carefully checked in terms of constraints fulfillments. Voltage improvement for all buses may also not be entirely displayed and only the improvement of the buses with lowest voltages is shown to confirm that the system voltages have been improved to the acceptable level.
Case 1: Similar load pattern
Voltage improvement of the worst bus
87 89 91 93 95 97 99 101 103
1 3 5 7 9 11 13 15 17 19 21 23
Hour
Vo
lta
ge
(%
)
Phase a uncompensated Phase a optimized Phase b uncompensated Phase b optimized Phase c uncompensated Phase c optimized
(a)
Voltage improvement of the worst bus
87 89 91 93 95 97 99 101 103
1 3 5 7 9 11 13 15 17 19 21 23
Hour
Vo
lta
g
e
(%
)
(b)
Fig.8. Voltages improvement of the worst buses of the 34-bus unbalanced system for the similar load curves provided by (a) GA (b) GA-fuzzy
It may be observed that the voltages are improved to the acceptable level. Calculations of bus voltage regulation confirm that the average voltage regulation provided by GA-fuzzy is better (1.287 %) than that given by GA (1.928 %). The hourly power loss reduction provided the both methods is shown in Fig. 9. Total daily energy saving presented by GA and GA-fuzzy are 369.539 kWh and 397.602 kWh, respectively. The benefits of optimization are comparatively indicated in Table 2.
Hourly real power losses
0 20 40 60 80 100 120 140 160
1 3 5 7 9 11 13 15 17 19 21 23
Hour
R
ea
l
p
o
w
er
l
o
ss
es
(
kW
)
Uncompensated GA GA-Fuzzy
Fig.9. Hourly real power loss reduction of the 34-bus unbalanced system using the similar load curves given by GA and GA-fuzzy
Case 2: Different load patterns
In addition to the unequal phase loads, the loads also vary according to the different load curves. The loads of phase a,
b, c now alter following load a, b, c of Fig. 2, respectively. This is aimed to make the system completely unbalanced. Inspection of optimization results indicates that bus 838, 848, and 838 are again detected suffering lowest voltages for phase a, b, c, respectively. The voltage improvements for the buses presented by GA and GA-fuzzy approaches are
respectively given in Figs. 10 (a) and (b), respectively. It may be observed from voltage improvement of Fig 10 (a) that application of GA is no longer able to completely maintain the voltage of the worst bus to the minimum level. The voltage of bus 838, phase c, at 8 a.m. is 94.38 % failing to meet the minimum voltage level of 95 %. On the other hand, GA-fuzzy is able to maintain the voltage of the worst bus to the acceptable level. Detail calculations of bus voltage regulation again confirm that GA-fuzzy provides better voltage regulation (1.233 %) than that given by GA (1.620 %).
Voltage improvement of the worst bus
87 89 91 93 95 97 99 101 103
1 3 5 7 9 11 13 15 17 19 21 23
Hour
V
o
lt
a
g
e
(
%
)
(a)
Voltage improvement of the worst bus
87 89 91 93 95 97 99 101 103
1 3 5 7 9 11 13 15 17 19 21 23
Hour
V
o
lt
ag
e
(%
)
(b)
Fig.10. Voltages improvement of the worst buses for the 34-bus unbalanced system using the different load curves provided by (a) GA (b) GA-fuzzy
The hourly real power loss for uncompensated system and optimized conditions provided by the both methods are shown in Fig. 11. The daily saving of energy presented by GA and GA-fuzzy are 477.591 kWh and 519.735 kWh, respectively. The optimization benefits are summarized in Table 2.
Hourly real power losses
0 20 40 60 80 100 120 140 160
1 3 5 7 9 11 13 15 17 19 21 23
Hour
R
ea
l
p
o
w
er
l
o
ss
es
(
kW
)
Fig.10. Hourly real power loss reduction of the 34-bus unbalanced system using the different load curves given by GA and GA-fuzzy
the similar and different load patterns using GA and GA-fuzzy. In addition to the significant improvements provided by GA, inclusion of fuzzy procedure into the existing GA leads to the better optimization benefits including higher energy saving and more robust voltage control. The energy savings of the system under different load pattern is higher due to the losses of the uncompensated system is high. Hence, more losses reduction may be earned by the optimal dispatch planning. It is also observed that fuzzy inclusion does not significantly complicate the algorithm as confirmed by the required computation times.
TABLE 2
COMPARISON OF OPTIMIZATION RESULTS FOR THE 34-BUS UNBALANCED SYSTEM USING SIMILAR AND DIFFERENT LOAD CURVES
Optimization benefits GA GA-Fuzzy
Similar load curves
Energy Saving (kWh) 369.539 397.602 Average Voltage Regulation (%) 1.928 1.287 Average computing time (sec)* 523.41 520.72
Different load curves
Energy Saving (kWh) 477.591 519.735 Average Voltage Regulation (%) 1.620 1.233 Average computing time (sec)* 491.84 527.89 *) Intel Pentium (R) 4 with Intel 3.0 GHz processor and 2.5 GB RAM
D. Iteration analyses
The calculation progress was also recorded in this study. The progress of fitness growths for the different optimization cases is shown in Fig. 11. Since the methods employ different fitness functions causing different fitness values, the values are normalized with respect to their maximum achieved value for comparison purpose.
Iteration progress
60 65 70 75 80 85 90 95 100 105
1 6 11 16 21 26 31 36 41 46 51
Generation
P
ro
g
re
ss
(
%
)
GA (similar load) GA-Fuzzy (similar load) GA (dif f erent load) GA-Fuzzy (dif f erent load)
Fig.11. Iteration progress of GA and GA-fuzzy for different optimization cases
In general, both GA and GA-fuzzy require more iteration to achieve the highest fitness for the system under different load patterns. This is due mainly to the difficulty of fulfilling the constraints. For GA-fuzzy in particular, inclusion of fuzzy approach into the existing GA enable the method providing soft restriction of objective achievement and constraints fulfillment. As a result, GA-fuzzy will explore more extensive solutions. From the optimization standpoint, it is method’s ability to explore the wider solution region. Consequently, the method may start with lower fitness, as shown in Fig 11. In term of solution improvement, employment of fuzzy membership functions also enables maintaining the promising solutions while improving them. Hence, the method may subject to fluctuations before achieving the highest fitness. The advantage of GA-fuzzy is
due to the combination of extensive exploration of solution area and maintenance of promising solutions while improving them. Even though the method even may start with lower fitness, the iteration will be progressing well and achieve better final solution, as indicated in Table 2. Nevertheless, if the preset generation number is too small than GA-fuzzy may come with worse optimization results since there is no enough opportunity to improve the solutions.
VI. CONCLUSION
Optimal volt/VAr control for unbalanced distribution system is carried out using GA and GA-fuzzy taking into account the similar and different load patterns for system loads fluctuations. Main conclusions are:
x The optimization enables improving the system operations by reducing the energy loss and maintaining the voltage to the acceptable levels,
x In addition to the significant improvements presented by GA, GA-fuzzy provides better improvements including higher energy saving and more robust voltage control, x For the system under different load patterns, more
iterations are required by both methods to converge, x Inclusion of fuzzy approach into the existing GA may lead
the method start with lower fitness and encounter fluctuations but achieve a better final solution.
VII. APPENDIX TABLE A
OPTIMIZATION PARAMETERS USED IN THE OPTIMAL VOLT/VAR CONTROL PROBLEM
Parameter Value
Population size 50
Maximum generation 50 Probability of crossover 60 % Probability of mutation 1% Convergence tolerance*
1 u 10-6
Maximum switching of LTC 30 tap displacements per day Maximum switching of substation capacitor 6 times per day
Maximum switching of feeder capacitor 2 times per day Deviation of bus voltage 0.95 – 1.05 p.u. THD limit of bus voltage 5 %
Weighting coefficient**) of GA (Eq. 9) Voltage (wV) 0.6667
Power loss (wloss) 0.3333
Weighting coefficient of Hybrid GA-fuzzy (Eq. 13) Voltage (wV) 0.4286
Power loss (wloss) 0.2857
LTC tap switching (wS) 0.2857
*) The deviation of the successive fitness values used to terminate the iterations
**) Indicates the importance level of one objective with respect to the other objectives or constraints
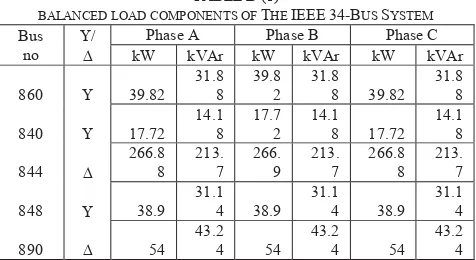
TABLEB(1)
BALANCED LOAD COMPONENTS OF THE IEEE34-BUS SYSTEM Bus
no 8
' kW Phase A kVAr kW Phase B kVAr kW Phase C kVAr 860 8 39.82
31.8 8
39.8 2
31.8
8 39.82 31.8
8 840 8 17.72
14.1 8
17.7 2
14.1
8 17.72 14.1
8 844 '
266.8 8
213. 7
266. 9
213. 7
266.8 8
213. 7 848 8 38.9
31.1 4 38.9
31.1
4 38.9 31.1
4
890 ' 54
43.2 4 54
43.2
4 54 43.2
TABLEB(2)
UNBALANCED LOAD COMPONENTS OF THE IEEE34-BUS SYSTEM Bus no 8' Phase A Phase B Phase C
kW kVAr kW kVAr kW kVAr 806 8 0 0 62.44 32.28 52.14 27.68 810 ' 0 0 31.76 16.42 0 0 820 ' 67.8 35.04 0 0 0 0 822 8 271.06 140.1 0 0 0 0
824 8 0 0 0.78 0.4 0 0
826 8 0 0 83.86 43.36 0 0
828 ' 0 0 0 0 5.56 2.88
830 ' 12.36 6.4 0 0 0 0
834 8 7.98 4.12 25.1 12.98 25.64 13.26 836 ' 54.74 28.3 21.1 10.9 84.1 43.48 838 ' 55.22 28.54 0 0 0 0 840 8 34.98 18.08 43.62 22.54 0 0
842 8 0 0 0 0 0 0
844 ' 18.24 9.42 0 0 0 0 846 8 0 0 49.18 25.42 44.46 22.98 848 8 0 0 45.24 23.4 0 0
856 8 0 0 7.42 3.84 0 0
858 ' 13.36 6.9 2.16 1.12 10.7 5.54 860 8 31.32 16.18 41.72 21.56 222.3 114.9
862 8 0 0 0 0 0 0
864 ' 1.26 0.66 0 0 0 0
TABLE C
OPTIMAL DISPATCH SCHEDULE USING FOR THE 34-BUS UNBALANCED SYSTEM UNDER DIFFERENT LOAD PATTERNS USING GA-FUZZY
H
our
L
T
C
C1 C2 C3 C4 C5 C6 C7 C8 C9 C10 C11 C12 C13
1 4 0 1 0 0 1 0 0 0 0 0 0 0 0
2 4 0 0 0 0 1 0 0 0 0 0 0 0 0
3 4 0 0 0 0 1 0 0 0 0 0 0 0 0
4 4 1 0 1 0 1 0 0 0 0 0 0 0 0
5 4 1 0 1 0 1 0 0 0 0 0 1 0 0
6 4 1 0 1 1 1 0 0 0 0 0 1 0 1
7 4 1 0 1 1 1 0 0 0 1 0 1 0 1
8 7 1 1 1 1 1 0 0 0 1 0 1 0 1
9 7 0 0 1 1 1 0 0 0 1 1 1 0 0
10 7 0 0 1 1 1 0 1 1 1 1 1 1 0
11 7 0 1 1 1 1 1 1 1 1 1 1 1 0
12 7 1 1 1 1 1 1 1 1 1 1 1 1 0
13 7 1 1 1 0 1 1 1 1 1 1 1 1 0
14 7 0 0 1 0 1 1 1 1 1 1 1 1 0
15 7 0 1 1 0 1 1 1 1 1 1 0 1 0
16 7 0 1 1 0 1 1 0 1 1 1 0 1 0
17 7 0 1 1 0 1 1 0 1 1 1 0 0 0
18 7 0 1 1 0 1 0 0 1 1 1 0 0 0
19 7 0 1 1 0 1 0 0 1 0 1 0 0 0
20 7 0 1 1 0 1 0 0 1 0 1 0 0 0
21 7 1 1 1 0 0 0 0 0 0 1 0 0 0
22 6 1 1 1 0 0 0 0 0 0 0 0 0 0
23 6 0 1 1 0 0 0 0 0 0 0 0 0 0
24 6 0 1 0 0 0 0 0 0 0 0 0 0 0
VIII. REFERENCES
[1] M. A. Abido and J. M. Bakhashwain, "Optimal VAR dispatch using a multiobjective evolutionary algorithm," International Journal of Electrical Power & Energy Systems, vol. 27, pp. 13-20, 2005/1 2005. [2] J. Y. Park, S. R. Nam, and J. K. Park, "Control of a ULTC
Considering the Dispatch Schedule of Capacitors in a Distribution System," IEEE Transactions on Power Systems, vol. 22, pp. 755-761, 2007.
[3] A. Ulinuha, M. A. S. Masoum, and S. M. Islam, "Optimal Scheduling of LTC and Shunt Capacitors in Large Distorted Distribution Systems using Evolutionary-Based Algorithms," IEEE Transactions on Power Delivery, vol. 23, pp. 434 - 441, 2008.
[4] S. Auchariyamet and S. Sirisumrannukul, "Optimal dispatch of ULTC and capacitors for volt/VAr control in distribution system with harmonic consideration by particle swarm approach," in International Conference on Sustainable Power Generation and Supply, SUPERGEN '09 2009, pp. 1-7.
[5] Z. Hu, X. Wang, H. Chen, and G. A. Taylor, "Volt/VAr control in distribution systems using a time-interval based approach," IEE Proceedings-Generation, Transmission and Distribution, vol. 150, pp. 548-554, 2003.
[6] A.Ulinuha, M. A. S. Masoum, and S. M. Islam, "Unbalance Power Flow Calculation for Radial Distribution System Using Forward-Backward Propagation Algorithm," in Australasian Universities Power Engineering Conference (AUPEC), Perth, Australia, 2007. [7] W.-M. Lin and J.-H. Teng, "Three-phase distribution network
fast-decoupled power flow solutions," International Journal of Electrical Power & Energy Systems, vol. 22, pp. 375-380, 2000.
[8] W. H. Kersting and W. H. Phillips, "Distribution feeder line models," IEEE Transactions on Industry Applications, vol. 31, pp. 715-720, 1995.
[9] J. C. M. Vieira, Jr., W. Freitas, and A. Morelato, "Phase-decoupled method for three-phase power-flow analysis of unbalanced distribution systems," IEE Proceedings-Generation, Transmission and Distribution, vol. 151, pp. 568-574, 2004.
[10] Y. Deng, X. Ren, C. Zhao, and D. Zhao, "A heuristic and algorithmic combined approach for reactive power optimization with time-varying load demand in distribution systems," IEEE Transactions on Power Systems, vol. 17, pp. 1068-1072, 2002.
[11] A. Ulinuha, M. A. S. Masoum, and S. M. Islam, "Optimal Dispatch of LTC and Shunt Capacitors in the Presence of Harmonics using Genetic Algorithms," in Power Systems Conference and Exposition (PSCE) - IEEE, Atlanta, Georgia, USA, 2006, pp. 733-740.
[12] A. L. Shenkman, "Energy loss computation by using statistical techniques," IEEE Transactions on Power Delivery, vol. 5, pp. 254-258, 1990.
[13] N. Amjady, "Short-Term Bus Load Forecasting of Power Systems by a New Hybrid Method," IEEE Transactions on Power Systems, vol. 22, pp. 333-341, 2007.
[14] N. Kandil, R. Wamkeue, M. Saad, and S. Georges, "An efficient approach for short term load forecasting using artificial neural networks," International Journal of Electrical Power & Energy Systems, vol. 28, pp. 525-530, 2006.
[15] S. Chenthur Pandian, K. Duraiswamy, C. Christober Asir Rajan, and N. Kanagaraj, "Fuzzy approach for short term load forecasting," Electric Power Systems Research, vol. 76, pp. 541-548, 2006. [16] A. Trebi-Ollennu and B. A. White, "Multiobjective fuzzy genetic
algorithm optimisation approach to nonlinear control system design," in Control Theory and Applications Conference, 1997, pp. 137 - 142. [17] A.Ulinuha, M. A. S. Masoum, and S. M. Islam, "A Hybrid GA-Fuzzy
Algorithm for Optimal Dispatch of LTC and Shunt Capacitors in Distribution System," in Australasian Universities Power Engineering Conference (AUPEC), Melbourne, Australia, 2006.
[18] F.-C. Lu and Y.-Y. Hsu, "Fuzzy dynamic programming approach to reactive power/voltage control in a distribution substation," IEEE Transactions on Power Systems, vol. 12, pp. 681-688, 1997.