Abstract—
Software visualization (SV) as introductory
programming learning-aid tool has been a very popular area of research since early 1980’s and numerous visualization systems have been developed. However, after three decades of research and work, most of system treated the programming as a product rather than as a process. This situation has led coding become a dominant activity in programming cycle and student spend more time dealing with issues related to the syntax than solving problem or evaluating the logical flow of the program. 3De’s – synergetic program visualization– tool is a prototype of visual programming environment intended to help novice students in order to understand programming cycle starting from designing problem-solving, developing code and validating logical flow of the program through visualizing multi level of program abstraction. In this paper, study will compare 3De’s with some representative sample of current visualization system tools. This has led to a novel approach in understanding program using SV tool for novice students.
Index Terms— algorithm, novices, programming, software
visualization,
I. INTRODUCTION
Both, students and instructors recognized that tools such as Software Visualization (SV) have broadly potential as a programming learning-aid tool, even better comparing to static written presentation such as conventional textbooks, or verbal descriptions with blackboard-illustrative supported as occurred in traditional lecture-led class. Meanwhile, from recent survey on educators, proposed a widespread confidence, more than 90%, that visualization technology indeed have pedagogical impact of learning positively [1–3]. There is a great belief among the researchers that SV will give students better understanding of basic programming, since it can shows visually the implicit nature of program process and the inner workings of the algorithm.
First author is a Ph.D student at Faculty of Information and Communication Technology - University Teknikal Malaysia Melaka, Hang Tuah Jaya, 76100 Durian Tunggal, Melaka, Malaysia. Email:
[email protected] He is a lecturer at University of Dian Nuswantoro, Semarang – Indonesia.
Second author is a Professor at University University Teknikal Malaysia Melaka, Hang Tuah Jaya, 76100 Durian Tunggal, Melaka, Malaysia. Email:
Today, a various type of SV can be found in the website with wide spreads topics of algorithm, programming and data structures. Each of system proposed different kind of techniques and methods, it ranges from static visualization of classical pretty printing [4] into dynamic visualization of 3D animation [5–7].
However things occurred beyond of that perception, at the same time other more studies have stated that there is no or less significant result in comprehension level among student who used SV as a learning or teaching aid-tool compare to those who used conventional tool [8–11]. Even the Algoviz, a repository portal of existing algorithm visualization tool, (http://algoviz.org), only recommended less than a quarter of more than four hundreds available tools for use, either as a lecture aid, as the basis for a lab exercise, or for self-study of a topic [2], [12]
Further researches convey that the centric-role of the instructors, amount of time and effort spent and lack of integrity of current tools with learning material are some of the reason that caused this paradox situation can be occurred [9], [13], [14]. However, most of the SV tools used these days support the learning programming as a single- task rather as a multi-task and generally tools uses single perspective rather than uses multiple perspectives to view the abstractness of the program. These restrictions limit the full prospective of the use of visualization in understanding programming as a whole process with multiple abstractions.
This study intends to discover how multiple-tasks and multiple-views of programming aspect can be supported by SV. In particular, this research has developed a synergetic visualization system based on integrated algorithm-program visualization framework. The framework provide users with the ability to construct the problem-solving design, observe the development process and behaviour of the code, and cross-referencing between actual and intended program output based on design and execution result.
II. RELATED WORK
The creation of various visualization of program using different graphical method has promoted the appearance of new terms like software visualization, algorithm animation, algorithm visualization, program visualization, visual program, data visualization, etc. have been defined and used
Integrated Algorithm-Program Visualization:
a Novel Approach of Software Visualization
Development
many times in the literatures. However, these phrases on some literatures have often been used interchangeably. The significant work by Price [15] has established a number of basic terms in the field of visualization. The Price’s taxonomy clarified the basic classification and terminology associated with the SV, which divided in to three categories, Algorithm Visualization (AV), Data Visualization (DV) and Program Visualization (PV). AV defined as the visualization of the higher-level abstractions, which describe software, PV defined as the visualization of actual program code and its behavior in either static or dynamic form, and DV is the process of representing abstractness of data as pictorial information that can aid in understanding the meaning of the data. DV is considered as a part of PV.
As a part of this section, we give an overview of the five SVs that we consider as a representative sample of tools based on Price’s taxonomy and used in introductory level of learning programming.
VILLE: is a PV with parallel view displaying two different
languages simultaneously. System provides step-by-step execution of program that allow student to observe program outputs and monitor changes in variable values [16], [17]. The main feature of the tool is a built-in syntax editor that can be used to defined new language to support a language-independent PV tool. VILLE comes also with the set of explanation of basic introductory programming topics, which can be modified to add the new category of topics, new examples and create automatic assessment. These features are very useful for the instructors since all editors needed are included in the package with friendly control. For students, they can compare and observe any two pre-defined languages at the same time with an easy-to-follow syntax. Students can trace the code with forward or backward mode in the execution and answer some pop-up question related to the current-state of program and data.
Jeliot 3: is a program animation system that has been
developed originally from the Eliot project over the past decade. As the third generation of Eliot, Jeliot 3 has a range of improvements as a sophisticated learning-aid tool [18], [19]. System shows the behavior of the program line-by-line during the execution in complete, coherent, and consistent way to the end of the program. It means visualization shows consistently to reduce the student’s cognitive load, display the element of visualization completely to make sure that it easy for novice to trace the logical flow of the code and coherent in a sense that the appearance of each elements in a well-designed area. The executed source code, control by user through VCR-like button, each line of code is animated in detail and linked to the program code by highlighting related line. System covers a large subset of program written in Java, it will extract the intermediate code after sent it to Java interpreter, based on intermediate code the direction are given to the visualization engine to generate the animation. This automatic animation feature is very important for students and instructors; they can use it straightly with no needs to be invested in order to use it.
Alice 3D: is an algorithm animation system within 3D
interactive programming environment based on micro world that help student in preparing for learning programming concepts through populate and control 3D object [6], [20]. User construct the program through 3D object populate in a virtual world where its appearance and behavior of its object controlled by drag-dropping simple scripts. During the execution system, object responses to the keyboard and mouse event triggered by user that will be translated into a smooth animated over specific duration. Based on Python programming language, Alice 3D offers a sophisticated technology in order to help student learns programming in highly semantic feedback. Using this approach allowing user to interactively “putting the pieces” together and understanding the real functions of each “pieces”.
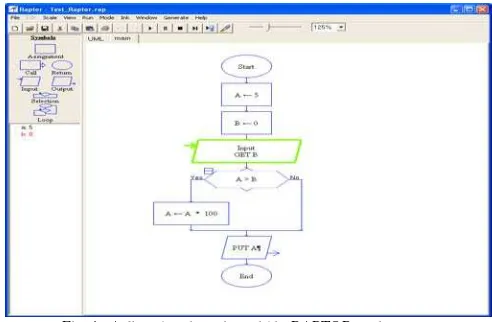
Raptor: is an AV prototyping tool intended to address the
shortcomings of syntactic complexity. It is kind of visual programming based on iconic flowchart symbol that can be executed as a program with embedded syntax within flowchart symbol [21]. Students can control the execution either forward step-by-step or in continuous mode. An executed chart will be highlighted and linked to the defined-data within data-area that will reflect to changes in variable values as seen on figure 1. System is not required students to manually enter any text
in traditional text-based programming environment but prevent students from creating incorrect syntax within each flowchart symbol. Code generator for several programming languages is provided in order to convert the constructed algorithm design into particular syntax.
ALVIS Live!: is a collaborative AV system where user can
access either from code-to-visualization or graphic visualization-to-code to achieve a program comprehension. For code-to-visualization a written algorithm in form of SALSA pseudo-code language will immediately transform into simple graphic art supplies, meanwhile for visualization-to-code, a dragging object will transformed into their related pseudo-code sentences and appended into the code-editor straight away [22] . Illustrated objects in the visualization are in form of low-fidelity, a sketch that highly unpolished refer to the convention student informally rather than symbols that are
widely agreed by an expert. Immediate semantic feedback is another breakthrough which coming with the system to address the shortcoming of inability to see the execution effects of code immediately. According to the Tanimoto’s level of liveness, the immediate level on ALVIS Live! falls somewhere between levels 3 and 4. In particular, while a program is running and user attempts to edit code at the same time then the execution pointer automatically jumps to current position and execution automatically continues.
From those reviewed tools, we found that all tools classified as visualization for program comprehension intended to support novice student in learning introductory of programming. None of those tools provides either multiple views of program abstraction or multiple tasks of programming. Jeliot 3 and Ville emphasized the visualization on behavioral of the program in the syntactic level, where the program construction activity is become the major concern to be supported. Even though there is a significant difference in the representation model, Alice 3D and Raptor are considered as the AV tools, where the higher level of program abstraction is the main commodity to be revealed. Thus, process of problem-solving design becomes the main task that being supported by these tools. ALVIS Live! is the only tool that provide multiple perspective of program abstraction. It provides both the syntactical level and conceptual level but the aspect of consistency and completeness, as Jeliot 3 taken in to account as multimedia element to be consider, cannot be fully adopted. Likely, this is because ALVIS Live uses low-fidelity as the method to represent the algorithm behavior, which it can be subjectively different for each student in a way they presents their own visualization.
III. SYNERGETIC ALGORITHM-PROGRAM VISUALIZATION Learning programming is more than simply learning programming languages, nevertheless, typical introductory programming courses mostly adopt the learning material based on the programming textbooks, which mainly focus in the knowledge of particular programming language [24–26]. Prior researches regarding to the learning of programming stated that mutual dependency among designing, developing and debugging are things that cannot be denied in order to understanding programming as a whole [24], [27].
We build 3De as a synergetic algorithm-program visualization tool that can helps student to understand the programming as multiple tasks with multiple views. System supports active interaction with the students and covers almost all the level of engagement [28]. In order to support the paradigm that programming is a multiple processes, system provides the algorithm-editor to facilitate student in design process. Automatic code generator immediately transforms each of “pieces” of plan from designed problem-solving into syntactical code.
This mechanism helps student to construct a valid map and avoid them from situation of “cannot see the forest for the trees” since most of visualization tools emphasize the representation either on algorithm or on the code, rarely
provides the link between those level of abstraction. Based on this model, students can see it clearly the development process of the code and which part of solution this code gives its contribution. Along with transformation process, system also provides intermediate level, called as the dynamic explanation model. This model works concurrently with the prior model, which mean, when users run/edit their algorithm in the prior model, the environment visually displays the behavioral of the symbol that currently under execution [29].
A. 3De Program Visualization Environment
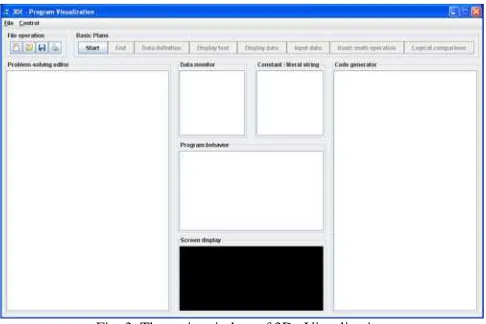
Since most of the current tools merely present the abstraction in single view, 3De proposes a multiple view of program abstraction that managed in the integrated environment. The higher-level abstraction presented in flowchart diagram intended to show the whole design strategy
to solve the given problem (see figure 2). A simple graphical object is used to visualize the behavior of the plan and the changes of the data value. This intermediate part of visualization acts as a dynamic explanatory of the plan execution that appears in three areas of program behavior, data and constant monitor, and console display. Moreover, as the lower level of abstraction, the converted plan is written in form of textual syntax based on simple C++ in the code area.
3De program visualization is arranged in a simple single window form with three integrated main user interfaces: menu
Fig. 2. The structure of the visualization area in 3De Visualization.
and standard toolbar, basic plans, and visualization arena or theater. The user interaction mainly focuses on the visualization arena, which is consisting of six visualization sections namely: problem-solving editor, program behavior, data monitor, constant/literal string, screen display, and code generator.
B. User Interaction on System
One of the main considerations of 3De development is intended to help students understand programming as a process. Thus, three main tasks of programming, i.e. design, develop, and debug, are supported simultaneously to achieve the whole understanding of program and programming. User interacts with the system by designing his or her own problem-solving using provided elements that is called plan. In order to understanding the development process, system immediately will simulate each plan to explain to the user how this plan works and how this plan affected to the data values. To facilitate the debugging task system directly compile and execute current plan and provide the output display in the console window immediately. This real time execution allow students to undertake tracing from the problem-solving design, program behaviour and program result at the same time.
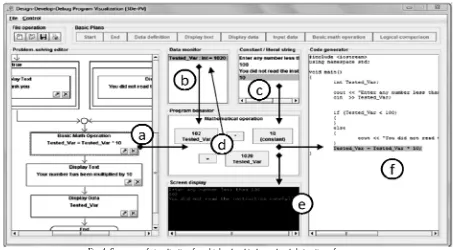
As an initiation step student divides a given problem into sub solutions that can be mapped using simple basic input-process-output plan. System offered eight basic plans including: START, STOP, DATA-DEFINITION, DISPLAY-TEXT, DISPLAY-DATA, INPUT-DATA, BASIC-MATH-OPERATION, and LOGICAL-COMPARISON. Students begin to construct their program by compiling sequences of those plans in the problem-solving editor (figure 4.a). To achieve their expected result of each plan user have to set the plan’s parameter, for example when user take the DATA-DEFINITION plan they also have to define the real data for
this plan through the parameter button within its plan. Plan-Parameter dialog for data definition will appear and user can sets the variable name, data type and initial value for his or her problem-solving requirement.
At the next stage, code development becomes the main task to be supported by system. Based on each constructed plan on
the program editor, an automatic code generator transforms it into textual code in form of simple C++ language (figure 4.f). Generated code is compatible with standard C++, which means code can also be executed within standard developer environment. This error-free-syntax intended to facilitate student in understanding the code development without having to hassle with various syntax errors. Since the most important is students have to understand the meaning or semantics, the behaviour, and the role of each syntax in a program as a whole.
Evaluation stage as the final step of the program development life cycle is supported by system through live monitoring of program and data behaviour. System will display the plan with the parameter that has been set in the form of dynamic textual that allow user to observe and verify his or her own design in term of logical and value of data either variable or constant (figure 4.b and c). Dynamic visualization of each plan lets student to verify between his or her proposed design and the expected results through animated text and console of output screen display (figure 4.d and e). Applying this immediate semantic feedback also gives students a chance to observe and to cross-reference among designed algorithm, syntactical code, to semantic behaviour.
IV. DISCUSSION
TABLE I
Comparison of Visualization Tools
a little weight to analysis, design and testing. Commonly problems related to errors in students’ program are caused of deficiencies in designing problem-solving rather than syntactical misunderstandings [24], [27], [30], [31]. There are mutual and complex dependencies between understanding the conceptual framework of algorithm and the ability to construct and to debug a program. The ability to trace a program becomes one of the factors that are related to the ability to solve problems, and furthermore the ability of construct a problem-solving contributes to the programming skill. 3De attempts to support those comprehensive processes in understanding software development by giving the equal attention on design, development and debug program through visualization tool. Mostly available tools support only a part of programming-phase rather than continuing support through the programming-cycle. The lack of cross-referencing feature forces student to use different tool (e.g. data visualizer, algorithm visualization, program visualization, or debugger) for each stage to assist them in understanding and practicing skills in programming.
From the learner’s point of view, 3De shows clearly how the interwoven relationship between algorithm design, the logical and data flow of program behaviour, the translation into the syntax’s program, and the output or result of the program. It has a potential to help student in understanding the essential behind basic programming concepts. We see an opportunity if each plan that added into a problem-solving design be presented both in lower level and higher level perspectives in concurrent way then it will maintain student's cognitive model quickly and leads to high-level understanding progressively. As well as the integrated environment with immediate semantic feedback that possibly can help student to reduce time needed to do edit-compile-run tasks repeatedly and increase the confidence feeling to the correctness of the program.
There are some similar tools to 3De with some of common features, however; some striking differences provide different representation in level of abstraction among of them. Short comparison of similar tools describe in Table 1.
V. CONCLUSION
Learning to program is a complex process of trial and error, it requires both cognitive and skill performance at the same level through a number of activities and some different forms of program representation rather than learning to write the code or syntax in particular language. With this comprehensive process of design, develop, and debug and multi-level representation of program abstract within integrated edit-run environment, 3De-synergetic PV as learning-aid tool is needed to shift the internal working memory load of students to provide more “space” to the essential knowledge of programming.
Developed system focused merely on the basic knowledge related to the development of algorithms design and code construction in a simple C++ programming language, algorithm design has not yet included in the iterative handling, procedure and function, and advanced data type. In the future 3De is going to be extended to cover some of those issues. Moreover, it is also going to be evaluated on the first programming courses at university level. In addition to the learning performance, the evaluation will focus on student ability to trace and write the code and the viability of 3De’s features.
REFERENCES
[1] C. A. Shaffer, “SIGCSE 2010 AlgoViz Survey Results,”
www.algoviz.org, 2010. [Online]. Available:
http://algoviz.org/news/2010-03-25-sigcse-2010-algoviz-survey-results. [Accessed: 29-Apr-2010].
[2] C. A. Shaffer, M. Cooper, and S. H. Edwards, “Algorithm visualization: a report on the state of the field,” in Proceedings of the 38th SIGCSE
technical symposium on computer science education, 2007, vol. 39, no.
1, pp. 150 – 154.
[3] J. Urquiza-Fuentes and J. Á. Velázquez-Iturbide, “A survey of successful evaluations of program visualization and algorithm animation systems,” ACM Transactions on Computing Education (TOCE), vol. 9, no. 2, pp. 1–21, 2009.
[4] R. M. Baeker and A. Marcus, Human factors and typography for more
readable programs. New York, USA: ACM, 1989, p. 348.
[5] M. H. Brown and M. A. Najork, “Algorithm Animation Using 3D Interactive Graphics,” Proceedings of the 6th annual ACM symposium
on User interface software and technology, 1993.
[6] S. Cooper, W. Dann, and R. Pausch, “Alice: a 3-D tool for introductory programming concepts,” Journal of Computing Sciences in Colleges,
vol. 15, no. 5, pp. 107–116, 2000.
[7] A. R. Teyseyre and M. R. Campo, “An overview of 3D software visualization.,” IEEE transactions on visualization and computer graphics, vol. 15, no. 1, pp. 87–105, 2009.
[8] C. D. Hundhausen, S. A. Douglas, and J. T. Stasko, “A meta-study of algorithm visualization effectiveness,” Journal of Visual Languages &
Computing, vol. 13, no. 3, pp. 259–290, 2002.
[9] P. Ihantola, V. Karavirta, A. Korhonen, and J. Nikander, “Taxonomy of effortless creation of algorithm visualizations,” in ICER 2005 -
International Workshop on Computing Education Research, 2005, pp.
123–133.
[10] V. Karavirta, A. Korhonen, L. Malmi, and K. Stalnacke, “MatrixPro - A tool for on-the-fly demonstration of data structures and algorithms,” In
Proceedings of the Third Program Visualization Workshop, 2004.
[11] R. B. B. Levy and M. Ben-Ari, “We work so hard and they don’t use it: acceptance of software tools by teachers,” ACM SIGCSE Bulletin, vol. 39, no. 3, p. 250, 2007.
[12] “ALGOVIZ: The Algorithm Visualization Portal,” 2010. [Online]. Available: www.algoviz.org.
[13] D. C. Cliburn, “Student opinions of Alice in CS1,” in Frontiers in
[14] A. Gomes and A. J. Mendes, “An environment to improve programming education,” Proceedings of the 2007 international conference on
Computer systems and technologies - CompSysTech ’07, p. 1, 2007.
[15] B. A. Price, Ronald M. Baecker, and I. S. Small, “Machine Learning Methods in Automatic Image Annotation,” in Software Visualization:
Programming as a Multimedia Experience, J. T. Stasko, J. Dominique,
M. H. Brown, and B. A. Price, Eds. MIT Press, 1998, pp. 3–27. [16] E. Kaila, T. Rajala, M.-J. Laakso, and T. Salakoski, “Automatic
assessment of program visualization exercises,” Proceedings of the 8th
International Conference on Computing Education Research - Koli ’08,
p. 101, 2008.
[17] T. Rajala, M. J. Laakso, E. Kaila, and T. Salakoski, “VILLE–A language-independent program visualization tool,” in The Seventh Baltic
Sea Conference on Computing Education Research (Koli Calling 2007),,
2007, vol. 88, pp. 15–18.
[18] A. Moreno, N. Myller, and R. Bednarik, “Jeliot 3, an extensible tool for program visualization,” in Proceedings of the Koli Calling 2005: 5th
Annual Finnish/Baltic Sea Conference on Computer Science Education.,
2005.
[19] S. M. Cisar, D. Radosav, R. Pinter, and P. Cisar, “Effectiveness of Program Visualization in Learning Java: a Case Study with Jeliot 3,”
International Journal of Computers, Communications & Control, vol. 6, no. 4, pp. 669–682, 2011.
[20] P. H. Brown, “Some field experience with Alice,” Journal of Computing Sciences in Colleges, vol. 24, no. 2, pp. 213–219, 2008.
[21] M. C. Carlisle, T. A. Wilson, J. W. Humphries, and S. M. Hadfield, “RAPTOR: A Visual Programming Environment for Teaching Algorithmic Problem Solving,” ACM SIGCSE Bulletin, vol. 37, no. 1, p. 176, Feb. 2005.
[22] C. Hundhausen and J. Brown, “What You See Is What You Code: A ‘live’ algorithm development and visualization environment for novice learners,” Journal of Visual Languages & Computing, vol. 18, no. 1, pp.
22–47, 2007.
[23] M. M. Burnett, J. W. Atwood Jr, and Z. T. Welch, “Implementing level 4 liveness in declarative visual programming languages,” in Visual
Languages, 1998. Proceedings. 1998 IEEE Symposium on, 2002, pp.
126–133.
[24] R. Lister et al., “A multi-national study of reading and tracing skills in novice programmers,” ACM SIGCSE Bulletin, vol. 36, no. 4, p. 119, Dec. 2004.
[25] B. Hanks, L. Murphy, B. Simon, and R. McCauley, “CS1 students speak: advice for students by students,” ACM SIGCSE, pp. 19–23, 2009. [26] K. Ala-mutka, “PROBLEMS IN LEARNING AND TEACHING
PROGRAMMING - a literature study for developing visualizations in the Codewitz-Minerva project,” 2003.
[27] M. McCracken et al., “A multi-national , multi-institutional study of assessment of programming skills of first-year CS students A framework for first-year learning objectives,” ACM SIGCSE Bulletin, vol. 33, no. 4, pp. 125–180, 2001.
[28] T. L. Naps et al., “Exploring the role of visualization and engagement in computer science education,” ACM SIGCSE Bulletin, vol. 35, no. 2, p.
131, Jun. 2003.
[29] Affandy, N. Suryana, S. Salam, and M. Azmi, “3De-synergetic Program Visualization: A visual learning-aid tool for novice students,” in e-Education, Entertainment and e-Management (ICEEE), 2011
International Conference on, 2011, pp. 133–137.
[30] C. Corritore and S. Wiedenbeck, “An exploratory study of program comprehension strategies of procedural and object-oriented
programmers,” International Journal of Human-Computer Studies, vol. 54, no. 1, pp. 1–23, Jan. 2001.
[31] Affandy, N. S. Herman, S. Salam, and E. Noersasongko, “A Study of Tracing and Writing Performance of Novice Students in Introductory Programming,” in Software Engineering and Computer Systems, 2011,