© 2014 The Hazura Haroon, Hanim Abdul Razak, Sahbudin Shaari and P. Susthitha Menon. This open access article is Institute of Microengineering and Nanoelectronics (IMEN), Universiti Kebangsaan Malaysia (UKM), 43600, Bangi, Selangor, Malaysia study the effect of jitter presence in the proposed network and then determine the maximum amount of jitter which the network can withstand. The model is then employed to predict the types of jitter received at the end of the transmission line. For the input power level of 0 dBm and Bit Error Rate (BER) of 1E−09, the observed total jitter, J
T, random jitter, JR and deterministic jitter, JD is 0.2676 UI,
0.1602 UI and 0.1073 UI, respectively.
Keywords: Jitter, WDM Networks, Noise
Introduction
Timing Jitter is one of serious issues in the voice and data transmission which directly contributes to signal degradation in high speed data communications systems. At transfer rates exceed 1 Gbps, digital signal appears to resemble the nature of analog signals. Jitter can be defined as the deviation of received bits as compared to a reference clock, thus leads to bit errors in signal transmission. It is known that, jitter appears to be one of important limitations to the performance of data transmission especially in optical Wavelength Division Multiplexing (WDM) system. Measurement of timing jitter or phase distortion is important to determine the sources, hence further precautions can be taken to reduce the jitter generation.
The overall jitter, J
T is composed of both
deterministic, J
D and Gaussian (random), JR content. JR is
generally generated from laser source’s random noise that produces thermal noise and shot noise (Hancock, 2004), while JD is not intrinsic or random. JD has a
specific cause and often periodic and narrowband. For instance, deterministic noise may be caused by imperfection of the transmitter circuit, poor circuit termination, etc. Ultimately, J
D is correlated to
Inter-Symbol Interference (ISI), duty cycle distortion and bandwidth limitation (Corrigan, 2000).
The presence of jitter can be measured intuitively by eye diagram analyzer. Eye diagram displays a composite view of each transition points over the Unit Interval (UI). Deploying eye diagram analyzer, the relative magnitudes of J
D and JR can be revealed through immediate visual of
jitter characteristic profile. Various mathematical estimation and simulation approaches can be used to predict the performance of a network system with jitter existence. Our work applied the OptiSystem software from Optiwave to study the behavior of jitter in the high speed optical transmission link especially for Wavelength Division Multiplexing (WDM) network.
Jitter Tolerance Evaluations
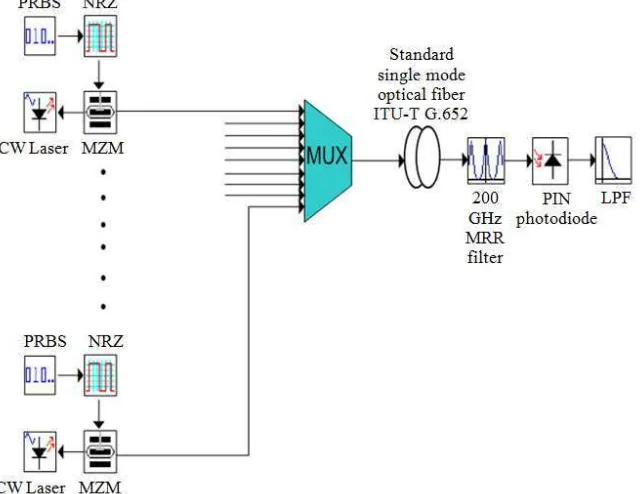
Fig. 1. Simulation setup for the WDM network with jitter generator
(a) (b) (c)
(d) (e) (f)
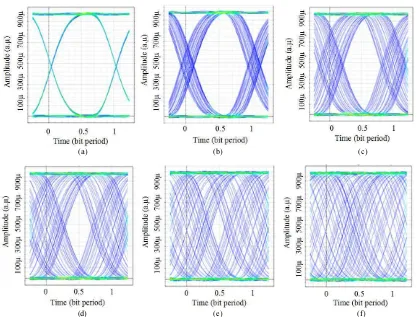
Fig. 2. Eye diagram in the presence of jitter of (a) 0 UI (b) 0.2 UI (c) 0.4 UI (d) 0.6 UI (e) 0.8 UI and (f) 1 UI
Table 1. Simulation parametric values for MRR filter
Parameter (Unit) Value
λ1 (nm) 1546.00
IL (dB) 0.13
BW (nm) 0.90
Q-Factor 1711.00
previous research works (Mulyanti et al., 2014;
Haroon et al., 2012; 2013).
Figure 2 portrays the results of the eye diagram observed with the existence of various jitter values. Horizontal axis eye opening was narrowed with the increase of jitter in the system. The phenomenon restricted the transmission of the data samples and further contributes to bit error. The presence of jitter in optical communication systems will cause noise margin to decrease and as the result, the systems are more vulnerable to transmission errors.
From Fig. 2, it can be clearly seen that, as the jitter presence closes the data eye, the BER is increasing. With the existence of 1 UI jitter as shown in Fig. 2(f), the eye opening was completely closed. Through this research, the maximum jitter tolerance that the network can withstand as for the BER <1×10⁻⁹ is 0.639 UI. A
research conducted by Intel discovered that the jitter tolerance for 10 Gbps digital system with the specifications recommended by the ITU-T G.825 is 0.5 UI, in which any optical transmission systems operated
direct scheme has eight channels and consists of three parts: A transmitter, an optical fiber and a receiver. Eight channels with 200 Ghz channel distributions were combined into a single transmission line by a multiplexer where each signal carry a data rate of 10 Gbps and complied the ITU-T G.692 frequency grid recommendations (Iyer, 2011).
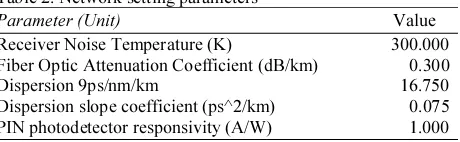
The fiber optic was set to ITU-T G.652 standard includes the attenuation, group delay, group velocity dispersion and effective index of refraction. Other parameters considered as per the practical scenario of WDM system were listed in Table 2.
Through the eye diagram analysis, the three types of jitter as explained before were calculated and plotted as in Fig. 4. It can be clearly seen that the resulted jitter was correlated with the BER value. It can be concluded that, as the BER value getting better, the amount of jitter will be decreased. It is interesting to note that the observed value of JR remains almost
unchanged despite the variation of BER.
Fig. 4. The overall jitter, JT, deterministic jitter, JD and random jitter, JR for 8-channel WDM system with various BER
Table 2. Network setting parameters
Parameter (Unit) Value
Receiver Noise Temperature (K) 300.000 Fiber Optic Attenuation Coefficient (dB/km) 0.300
Dispersion 9ps/nm/km 16.750
Dispersion slope coefficient (ps^2/km) 0.075 PIN photodetector responsivity (A/W) 1.000
In WDM optical transmission system, the J
R occurrence
is due by a laser source which produces thermal noise and shot noise, whereas J
D resulted from the white noise
produced by the components in optical communication systems (Yang and Lee, 2004). Since the presence of J
R
was due to random noise and has no specific boundaries, it is complicated to determine the contributing factors, nevertheless the JD was predictable and the source that
lead to the jitter presence can be determined and eliminated to improve the overall system performance.
J
D can either be reduced with a good network
composition layout, perfect line termination or reduce the line crosstalk (Zarr, 2012).
Conclusion
We have successfully investigate the impact of jitter in high speed 10 Gbps and 200 GHz Wavelength-Division Multiplexing (WDM) optical network using commercially available software. In particular, we have focused on an 8 channel WDM network consists of a transmitter, an optical fiber and a receiver. The observed total jitter, JT, random jitter, JR and deterministic jitter, JD is 0.2676 UI, 0.1602 UI and 0.1073 UI, respectively.
Acknowledgement
The researchers would like to thank Universiti Teknikal Malaysia Melaka (UTeM) for the support.
Funding Information
This research is supported by funding from UTeM (PJP/2013/FKEKK (43C)/S01260). Universiti
Kebangsaan Malaysia is also acknowledged for their contribution via grant no GUP-2012-012.
Author’s Contributions
Hazura Haroon: Participated in experiments, data acquisition, data analysis and drafting the manuscript.
Hanim Abdul Razak: Participated in data acquisition, data analysis and contributed to the writing of the manuscript.
Sahbudin Shaari: Designed the research plan and organized the study, helping in interpretations of data, coordinated the data-analysis and reviewing the manuscripts.
P. Susthitha Menon: Assisted in designed the research plan and organized the study, interpretations of data, contributed to the writing of the manuscript and reviewing the manuscripts.
Ethics
All authors approved the final manuscript. This manuscript has not been published elsewhere.
References
Christensen, B., 2000. A comparison of ITU-T and FC/GE jitter methodology applied to jitter tolerance and eye opening measurements on high-speed CDRs. GIGA Aps.
Corrigan, S., 2000. Skew definition and jitter analysis. Analog Applications Journal. application-notes.digchip.com/001/1-1421.pdf#page=33
Haroon, H.,S. Shaari, P.S. Menon,B. Mardiana and A.R. Hanim et al., 2012. Design and characterization of
multiple coupled microring based wavelength demultiplexer in Silicon-On-Insulator (SOI). J. Nonlinear Optical Phys. Materials, 21: 1250004-1-1250004-8.DOI: 10.1142/S021886351250004X Hancock, J., 2004. jitter-understanding it, Measuring it,