DESIGN VISION SYSTEM TO RECOGNIZE THE SCRIBED NUMBER ON THE
WAFER
LIAW GEOK PHENG
A report submitted in partial fulfillment of the requirements for the degree of Bachelor
of Electrical Engineering (Control, Instrument and Automation)
Faculty of Electrical Engineering
UNIVERSITI TEKNIKAL MALAYSIA MELAKA
“I hereby declare that I have read through this report entitle “Design of Vision System to
Recognized the Scribed Number on the Wafer” and found that it has comply the partial fulfilment for awarding the degree of Bachelor of Electrical Engineering (Control,
Instrumentation and Automation)”
Signature : ………
Supervisor’s Name : Mr.Lim Wee Teck
I declare that this report entitle “Design of Vision System to Recognized the Scribed Number on the Wafer” is the result of my own research except as cited in the references. The report has not been accepted for any degree and is not concurrently submitted in candidature of any other degree.
Signature : ...
Name : ...
ACKNOWLEDGEMENT
ABSTRACT
ABSTRAK
TABLE OF CONTENT
LIST OF APPENDICES xiv
1 INTRODUCTION 1
1.1 Motivation 2
1.2 Problem Statement 3
1.3 Objective 3
1.4 Scope 3
2 LITERATURE REVIEW 4
2.1 Journals Literature 4
2.1.1 Automatic License Plate Recognition 2.1.2 Recognition based on document
2.1.3 Optical Character Recognition on Product Item
6 8 10 2.2 Summary Previous Works Related To Project 11
2.3 Journal Theory Literature 14
2.3.1 Image Acquisition 15
2.3.2 Preprocessing 19
2.3.3 Segmentation 21
2.3.5 Recognition 24
2.3.6 Post-processing 24
2.4 Proposed Model After Studied the Previous Work Related to Project and Theory
3.1 Test Validity and Reliability 31
3.2 Validity 32
3.4 Reliability of data 53
3.4.1 Experiment 1 55
3.4.2 Experiment 2 56
3.4.3 Experiment 3 57
3.4.4 Confirmation Test 58
4 RESULT AND DISCUSSION 73
5 CONCLUSION AND RECOMMENDATION 74
REFERENCES 76
LIST OF FIGURES
FIGURE TITLE PAGE
1.1 The existing tracking process in Silterra Sdn. Bhd. 2 1.2 After implement the proposed low cost vision system 2
2.1 Phases of OCR technique 14
2.2 Conventional preprocessing steps 15
2.3 Color Image 15
2.4 Grey image 15
2.5 Original ship image 16
2.6 After low pass filtering image 16
2.7 Intensity Image 17
2.8 Noise applied 17
2.9 Median Filter applied 17
2.10 Method for binarization 17
2.11 Before Otsu’ method 18
2.12 After Otsu’ method 18
2.13 Before Optimal threshold 18
2.14 After Optimal threshold 18
2.15 (a) a skewed typewritten text; (b) skew corrected image 19
2.16 (a) Original pattern; (b) result of thinning 19
2.17 Strategies for character segmentation 20
2.18 Line segmentation 20
2.19 Word segmentation 21
2.20 Character Segmentation 21
2.21 Three feature extraction method 22
2.22 Before and after the edge detection 22
2.24 After normalization in each difference size of character will become same size.
23
2.25 The proposed OCR model to designing the vision system. 25
2.26 The sample ‘ABC123’ 25
2.27 The process in preprocessing. 26
2.28 The segmented character in 30x20 size image 26
2.29 Generic of Character Recognition Model 27
2.30 (a), (b), (c), (d), (e) shows that the white pixel left after match between the Sample and Template
28
2.31 The process to recognize the character with the range of pixel difference
29
3.1 The flow chart of project 31
3.2 Overview flow to carry out validity and reliability test 31 3.3 The hardware setup to mimic the environment in the Silterra Sdn.
Bhd. manufacturing plant
32
3.4 White color of light 33
3.5 Yellow color of light 33
3.6 The sample for creating the template 34
3.7 The two set of good testing sample(G sample) 34
3.8 The two set of not good testing sample(NG sample) 34 3.9 A group of not good(NG) sample printed on 80mg paper 35 3.10 A group of good(G) sample printed on 80mg paper 35
3.11 The proposed OCR technique to vision system. 36
3.12 The methodology for vision system design. 37
3.13 Simulink block diagram for template saving in training phase. 38 3.14 Simulink block diagram for recognition process in matching phase. 44 3.15 Simulink block for recognition of sample B when the sample is
matching with template B.
49
3.16 Simulink block for recognition of sample C when the sample is matching with template
49
LIST OF TABLES
TABLE TITLE PAGE
2.1 The OCR techniques used by Muhammad Sarfraz, Mohammed Jameel Ahmed, and Syed A. Ghazi to recognize the license plate.
5
2.2 The OCR techniques used by Serkan Ozbay, and Ergun Ercelebi to recognize the license plate.
5
2.3 The OCR techniques used by Kumar Parasuraman and P.Vasantha Kumar to recognize the license plate.
6
2.4 The OCR techniques used by G.Vamvakas, B.Gatos, N. Stamatopoulos, and S.J.Perantonis to recognize the historical documents.
7
2.5 The OCR techniques used by Junaid Tariq, Umar Nauman, and Muhammad Umair Naru to recognize for name cards reading.
7
2.6 The OCR techniques used by Teresa Vania Tjahja, Anto Satriyo Nugroho, Nur Aziza Azis, Rose Maulidiyatul Hikmah, and James Purnama to recognize for (IADR)
8
2.7 The OCR techniques used by Ernest Valveny, and Antonio L´opez to recognize for numerical information in sachets with surgical material
9
2.8 The OCR techniques used by Huihuang. Zhao, and Zhaohua. Wu to recognize characters in surface mount technology (SMT) product
9
3.1 The description for each process in training phase 39 3.2 The list of template need to save in the system. (Kindly refer to
Appendix B).
443
3.3 The description for each process. 45
3.4 The difference result between more and less than 90 white pixel left. 49
3.5 The list for declaration of character. 50
3.6 The white pixel left after match for character from 'A' to 'Z' and '0' to '9'
54
3.7 The comparison between the percentages of recognition with difference image size
55
3.8 The comparison between the percentages of recognition with difference median filter.
56
3.9 The comparison between the percentages of recognition with difference matching percentages.
57
4.1 The comparison between the percentages of recognition with difference image size.
60
4.2 The list of character unable to read with difference image size 61 4.3 The comparison between the percentages of recognition with
difference matrix of median filter.
62
4.4 The list of character unable to read and character wrong recognition with difference matrix of median filter
63
4.5 The comparison between the image with different matrix of median filter.
64
4.6 The comparison between the percentages of recognition with difference matching percentage.
66
4.7 The list of character unable to read and character wrong recognition with difference matric of median filter.
4.8 The comparison between the percentages of recognition after adjustment of white pixel value left at character C, F, and 3 in white light condition.
68
4.9 The comparison between the percentages of recognition after adjustment of white pixel value left at character C, F, and 3 in yellow light condition.
69
LIST OF APPENDICES
APPENDICES TITLE PAGE
A1 100 good(G) testing sample. 79
A2 100 not good(NG) testing sample. 80
B1 The original template with white color light. 81
B2 The original template with yellow color light. 83 B3 The template with different image size and median filter with
white color light stored in database of the vision system.
85
B4 The template with different image size and median filter with yellow color light stored in database of the vision system.
101
C White pixel value left after match for all the character and alphabet.
118
D The result for the comparison between the percentages of recognition after matching with 100 good(G) sample to the template with difference image size when the 3x3 median filter and 86% of matching percentage is fixed and in white light condition.
119
E The result for the comparison between the percentages of recognition after matching with 100 good(G) sample to the template with difference matrix of median filter when the 30x20 of image size and 86% of matching percentage is fixed and in white light condition.
121
F1 The result for the comparison between the percentages of recognition after matching with 100 good(G) sample to the template with difference matching percentage when the 30x20 of image size and 3x3 of median filter is fixed and in white light condition.
F2 The result for the comparison between the percentages of recognition after matching with 100 not good(NG) sample to the template with difference matching percentage when the 30x20 of image size and 3x3 of median filter is fixed and in white light condition.
125
G1 The comparison between the percentages of recognition after adjustment of white pixel value left at character C, F, and 3 in white light condition with the three best parameter for 100 good(G) and 100 not good(NG) testing sample.
127
G2 The comparison between the percentages of recognition after adjustment of white pixel value left at character C, F, and 3 in yellow light condition with the three best parameter for 100 good(G) and 100 not good(NG) testing sample.
129
H Gantt Chart 131
CHAPTER 1
INTRODUCTION
This chapter will discuss the background of machine vision with Optical Character Recognition; problem statement, objective and scope of the project.
1.1Motivation
Machine vision provided important advantage in term of cost and precision. It has been proven successful in controlled environment such as factory production line to ensure repeatability and reproducibility in good quality control, and can run continuously without rest. However, the existing sorting machine in Silterra manufacturing plant is used as a wafer tracking process to scan and sort the wafer base on the scribed number and this can help the workers to determine the wafer position. Unfortunately, the sorting machine is very expensive (around RM600 000).Therefore, this causes the limited number of sorting machine available in the production line.
Figure 1.1: The existing tracking process in Silterra Sdn. Bhd.
For this reason, a low cost vision system design with Optical Character Recognition is created to increase the number of sorting machine in industry, especially dealing with high volume of wafer produced. Figure 1.2 shows after implement the low cost vision system design.
1.2Problem Statement
As a semiconductor manufacturing company, Silterra Sdn. Bhd produces microchip and the wafer processing are one of the existing process in the production. The existing sorting machine are used to scan the scribed number on wafer and store data to an Excel file for wafer tracking process to determine the position of the wafer. But the machine is very expensive (around RM 600,000) and causes limited number of machine available in the manufacturing plant, therefore the time taken of the scanning process will be long and if any breakdown will directly cost the company in both money and time.
1.3Objective
The aim of this project are:
1) To design a vision system to recognize the scribed number on the wafer. 2) To store the detected scribed number to Excel file.
1.4Scope
CHAPTER 2
LITERATURE SURVEY AND PROJECT BACKGROUND
This chapter discuss the summary of previous work related to the project, the theory of OCR technique and proposed model of the vision system design.
2.1 Journal Literature
The comparison between all the previous works related to project such as Optical Character Recognition for Automatic License Plate Recognition, Optical Character Recognition on document reading, and Optical Character Recognition on surface product item. All this previous work are very helpful by giving a lot of ideas and knowledge which can implement and apply to the project.
2.1.1 Automatic License Plate Recognition
In 2005, Serkan Ozbay, and Ergun Ercelebi et al.[2] recognized OCR techniques as shown in Table 2.2. Final output it is proved to be 97.6% for the extraction of plate region, 96% for the segmentation of the characters and 98.8% for the recognition unit accurate, giving the overall system performance 92.57% recognition rate. This system is designed for the identification of Turkish license plates only.
Table 2.2: The OCR techniques used by Serkan Ozbay, and Ergun Ercelebi to recognize the license plate.
Acquisition processing Extraction processing
In 2010, Kumar Parasuraman and P.Vasantha Kumar et al. [3] proposed an algorithm consists of three major parts as shown in Table 2.3. The overall system performance 98% recognition rate. The proposed method is mainly designed for real-time Malaysian license plate, and can be readily extended to cope with license plates of other countries, especially those using Latin characters.
Table 2.3: The OCR techniques used by Kumar Parasuraman and P.Vasantha Kumar to recognize the license plate.
2.1.2 Optical Character Recognition on document reading
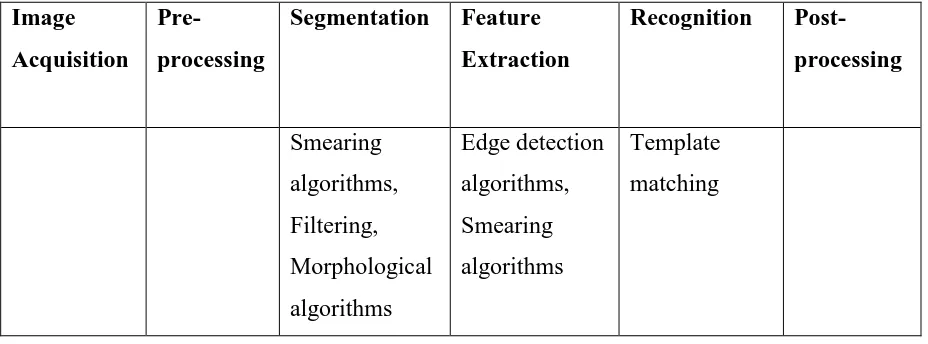
In 2010, G.Vamvakas, B.Gatos, N. Stamatopoulos, and S.J.Perantonis et al. [4] proposed a methodology for recognizing historical documents as shown in Table 2.4. The overall system performance 98.4% of recognition for the test line detection rate, 98% for the text line recognition accuracy and 97% for the word segmentation detection rate, 90.3% for word segmentation recognition accuracy, giving the overall system performance 95.8% recognition rate. This methodology can be applied to either machine printed or handwritten documents. It requires neither any knowledge of the fonts nor the existence of standard database because it can adjust depending on the type of documents that want to process.
S.J.Perantonis to recognize the historical documents.
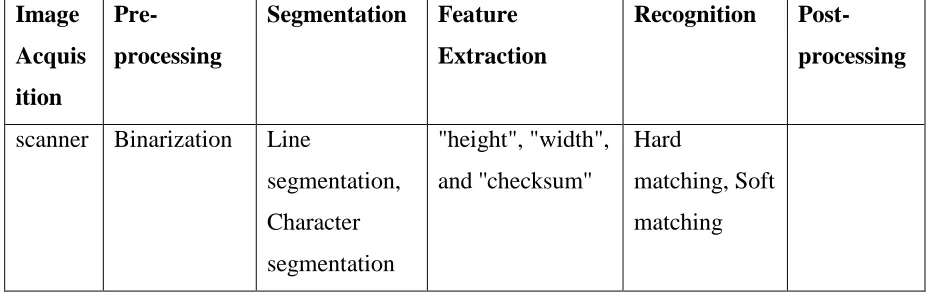
In 2010, Junaid Tariq, Umar Nauman, and Muhammad Umair Naru et al. [5] presented a simple, efficient, and less costly approach to construct OCR for cards reading or any document that has fix font size and style are shown in Table 2.5. Line extraction accuracy is 100%. Character extraction accuracy is 100%. The accuracy result of both the hard matching and soft matching (2 value range) also 100% but in soft matching (4 value matching) is 96.15%. It having some limitation like to use soft matching. For example: character explanation mark "!" might be matched with character capital "L" or small letter "I".
Table 2.5: The OCR techniques used by Junaid Tariq, Umar Nauman, and Muhammad Umair Naru to recognize for name cards reading.
Image
scanner Binarization Line