ISSN: 1693-6930
accredited by DGHE (DIKTI), Decree No: 51/Dikti/Kep/2010 89
A Web-based Geographic Information System for Aceh
Natural Hazards
Nasaruddin*1, Khairul Munadi2, M. Dirhamsyah3, and Dedi Yuliansyah4 1,2
Electrical Engineering Department, Faculty of Engineering, Syiah Kuala University Jl. Syech Abdurrauf no. 7, Darussalam, Banda Aceh 23111, Indonesia 1-4
Tsunami & Disaster Mitigation Research Center (TDMRC), Syiah Kuala University Jl. Tgk Abdul Rahman, Gampong Pie Meuraxa, Banda Aceh 23233, Indonesia
e-mail: [email protected]*1, [email protected], [email protected], and [email protected]
Abstrak
Propinsi Aceh merupakan daerah yang paling parah dilanda Tsunami pada 26 Desember 2004. Aceh juga mengalami banyak ancaman alam lain seperti banjir, gempa bumi, dan gunung merapi. Hingga saat ini, Aceh belum punya sistem informasi ancaman alam yang dapat digunakan untuk meningkatkan kesadaran publik dalam upaya pengurangan dampak dari ancaman tersebut. Sistem informasi ancaman alam akan menyediakan peta-peta ancaman sebagai pedoman perencanaan pengurangan risiko bencana. Sehingga pembangunan sistem informasi berbasis Web GIS untuk ancaman alam Aceh yang disebut sebagai ANHIS, merupakan sebuah keputusan strategis untuk meningkatkan kesadaran publik akan potensi risiko dari ancaman bencana alam di Aceh. Paper ini mengusulkan desain konseptual dan pembangunan purwarupa ANHIS. Tujuan utama dari ANHIS adalah untuk menampilkan peta-peta ancaman alam dan mendisiminasi informasi daerah ancaman ke pihak terkait guna membantu mereka dalam isu peringatan. Untuk membangun prototipe tersebut, kebutuhan-kebutuhan sistem, konfigurasi, desain sistem dan implementasi dibahas di paper ini. Selanjutnya, hasil purwarupa ANHIS ditunjukkan dalam peta ancaman tunggal dan multi-ancaman dari beberapa ancaman alam yang ada di Aceh. Akhirnya, beberapa perspektif untuk implementasi ANHIS ke depan diberikan pada bagian simpulan.
Kata kunci: Web GIS, Sistem Informasi, Peta ancaman, Multi-ancaman, ANHIS
Abstract
Aceh province is the most affected area by the tsunami of 26 December 2004. Aceh also has experiencing a number of natural hazards; flood, earthquakes, and volcano’s eruptions. Until now, Aceh has no natural hazards information system which can be used to increase public awareness in order to reduce the impact of the hazards. Natural hazards information system provides hazard maps as the guideline for disaster risk mitigation planning. Therefore, the development of a Web GIS based information system for Aceh natural hazards, referred as Aceh Natural Hazards Information System (ANHIS), is a very strategic decision to increase public awareness of the risks of natural disaster hazard in Aceh. This paper proposes conceptual design and the development of prototype for ANHIS. The main purpose of ANHIS is to visualize many natural hazards maps and disseminate information of the hazardous areas for disaster agencies, researchers and communities in order to help them act on warning issue. In order to develop the prototype, the system requirements, configuration, system design and implementation are presented in this paper. Furthermore, the results of prototype for ANHIS are demonstrated in terms of individual hazard map and multi-hazard map of many natural hazards in Aceh. Finally, the conclusions give the perspectives for future implementation of ANHIS.
Keywords: Web GIS, Information system, Hazard map, Multi-hazard, ANHIS
1. Introduction
organizations can minimize the risk of disasters. To effective mitigate against natural hazards, information system for natural hazards is an essential factor. Currently, there is no such an information system in Aceh. In fact, the system must be capable of addressing various aspects and phases of disasters. Furthermore, there are many data on natural hazards in Aceh local government institutions and non-governmental organizations. Such data, however, are not always readily accessible to a wider public. Disaster management authorities or organizations need access to timely, accurate and realible information to mitigate the disaster. Therefore, natural hazards information system is a very important information system in any country [2, 4]. It has motivated the development of Aceh Natural Hazards Information System (ANHIS). ANHIS can help mitigate the natural hazards through hazard information and eduction which will improve public preparedness and social that enables action in advance to reduce the risks involved. Hazard information should be regularly disseminated to public and is often presented in the form of a map that can be used for further anlysis in disaster mitigation planning such as land-used planning and regulation development in hazard zones, development and enforcement of building codes, etc. So ANHIS is necessary for decision makers to have an overview of the locations and types of the relevant hazards in Aceh. Therefore, this paper proposes conceptual design and the development of prototype for ANHIS.
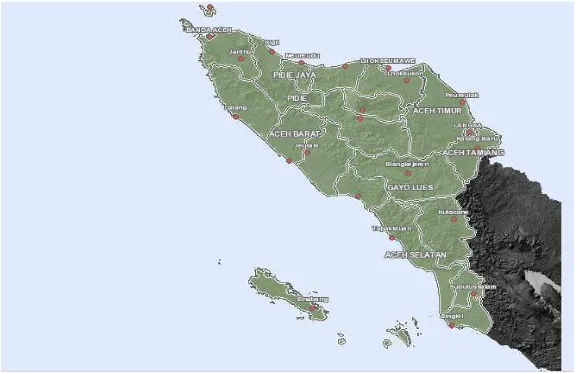
Figure 1. Location map of Aceh province.
2. Research Method
Research method of conceptual design and the development of prototype for ANHIS consist of several steps that are as follows:
System requirements analysis
Determining user requirements is one of the fundamental components of ANHIS design as user has a distinct view of the system and the hazard information produced by it. Furthermore, the potential users of ANHIS include Aceh government, disaster agencies, organizations, researchers and communities. The prototype is developed to provide the hazard map information in Aceh. So the required functions will be browsing, retrieving hazard information, conducting queries, performing location-related analysis to assist decision-making process. In order to meet user requirements, identification of hazards and data sources also should be paid more attentions.
Hardware and software requirements identification
GIS is a technology in evolution with rapid advances in hardware and software. To convert the spatial data into the required information such as hazard maps, it needs procedures. These procedures are fast done by selecting appropriate hardware and software. The software requirements describe the connections between specific software components, including databases, operating systems, and spatial analysis. They identify the data items coming into and going out the system. If the data sharing mechanism must be implemented in a specific way or use of a global data area in a multitasking operating system, this will be as an implementation constraint. In the prototype, architecture hardware is a one-computer configuration, where web server and database server are installed in a computer. The software platform is using open source software.
Prototype design
After identification of user and data requirements, next stage is the development of the prototype which includes design of the user interface and functionalities.
Implementation
Prototype implementation involves designing a system based on user requirements and testing the feasibility of the system. Since ANHIS is prepared to work on the Internet and is developed by a combination of the web system and the GIS. User can operate geographical and statistical data with location on web browser using the web of ANHIS.
3. Development of Prototype for ANHIS 3.1 Concept of ANHIS
The concept of ANHIS is a Web GIS based information system for presenting natural hazards data to improve operational support to disaster preparation and mitigation in Aceh. ANHIS is an interactive system allowing decision makers, geologists, engineers, and communities to explore and visualize available hazards data in order to know the hazards situation in Aceh without any previous GIS knowledge. For designed ANHIS, a client-server model is adopted, where client makes a request to a server and the server processes the request and returns the information to the client [7]. Web Map Service (WMS) offers a standard client-server interaction protocol that each map server implements as a common interface for accepting requests and returning responses [8].
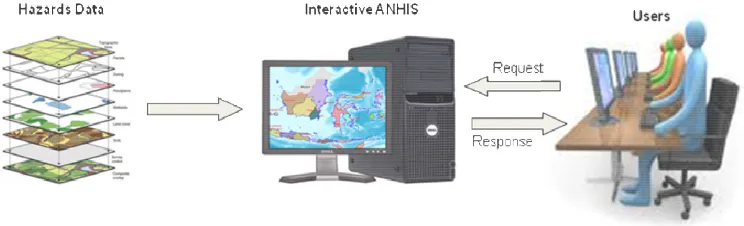
Figure 2 shows an illustration for the concept of a web GIS based for ANHIS. The hazards data will be stored to the database of the interactive ANHIS. Then, users can view the data in terms of hazard map visualizations. The interactive ANHIS offers a variety of map tools to view and investigate property. Various layers of natural hazards can be turned on or off depending on what user wants to see. The advantages of the interactive functionalities in ANHIS are as follows.
Map displayed on browser can be used interactively.
It can have centralized base map data which are large enough to be an individual system.
It can be managed more easily.
3.2 The ANHIS Web GIS Prototype 3.2.1 The Thematic Database
ANHIS has five main database: base administration region, geography, geology, hidrology and ecology. The database consists of spatial data with vector, line, point and raster formats, and tabular data related to disaster events in Aceh.
Base administration region database
It includes district administration boundary, subdistrict administration boundary, district capitals, subdistrict capitals, village locations, country boundary, national streets, district streets, subdistrict streets, and village streets. Base administration region data are main data in the ANHIS in which all thematic database are used them.
Geography database
It includes altitude, slope, pattern space, space structure, strategic area, land system, shoreline, bathymetry, river, contour and altitude points.
Geology database
It includes geology, fracture, riverbed location, soil type, mining region, volcanoes points, volcanoes cones, strike and metal potential.
Hidrology database
It includes watershed basis, groundwater depth and commensurate beach. Ecology database
It includes forest area, deforation, forest cover, conservation and environment quality.
3.2.2 Hardware and Software Configuration
The hardware and software configuration for ANHIS can be described as follows: a) Hardware platform developed prototype widely. Software for ANHIS consists of two main parts:
• Software for servers i. Geo Server
Geoserver is one of many open source GIS servers that release written in java. Geoserver software has capability for share and edit spatial data via online and offline. It publishes data from any major spatial data source using open standards. GeoServer is a reference implementation of the open geospatial consortium (OGC) web feature service (WFS) and web coverage service (WCS) standards, as well as a high performance certified compliant WMS. It forms a core component of the Geospatial Web. Compared to the MapServer, GeoServer supports the most of GIS functions rather than only publish spatial data [10]. In the proposed ANHIS, GeoServer is preferred to its prototype.
ii. Database server
performance for geospatial applications. In the proposed ANHIS, the open source database PostgreSQL with PostGIS extension could support spatial features very well; they are used for the spatial database. PostgreSQL is a powerful, open source object-relational database system. PostGIS is a project which adds support for geographic objects in PostgreSQL, allowing it to be used as a spatial database for GIS. It implements the OGC standard (Simple Features Specification for SQL) for spatial extensions to the SQL language, and is widely supported by other GIS software.
• Software for web applications i. OpenLayers
OpenLayers is a client application based a pure JavaScript library for displaying map data in most modern web browsers with no server-side dependencies. OpenLayers implements a JavaScript API for building rich web-based geographic applications, similar to the Google Maps and MSN Virtual Earth APIs, with one important difference-OpenLayers is free software, developed for and by the open source software community.
ii. GeoExt
GeoExt is a JavaScript library providing the groundwork for creating web-mapping applications based on OpenLayers and ExtJS. Ext JS is a cross-browser JavaScript library for building rich Internet applications.
3.2.3 The Web Interface Architecture
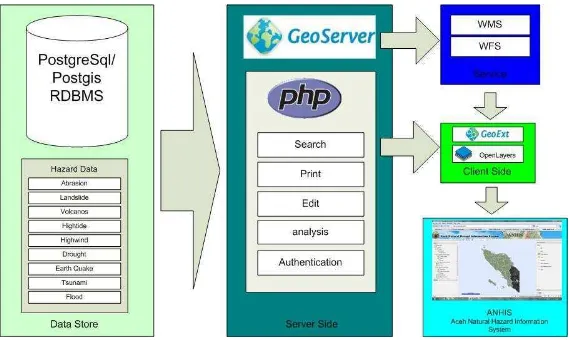
The web interface architecture for ANHIS is a three-tier system including database server, geoserver and browser as shown in Figure 3. It has a lightweight client and a heavyweight backend-processing server to speed up processing a large volume of GIS datasets. The database system is used to store a number of hazards datasets which have been collected for the prototype. The database platform is PostgreSql, while spatial data engine is Postgis paltform which can speed up data access to spatial databases using spatial index technology. At server side, the server processes the request and returns response to the client. In the client side, clients can submit requests for data and analysis to the server.
Figure 3. Web Interface Architecture for ANHIS.
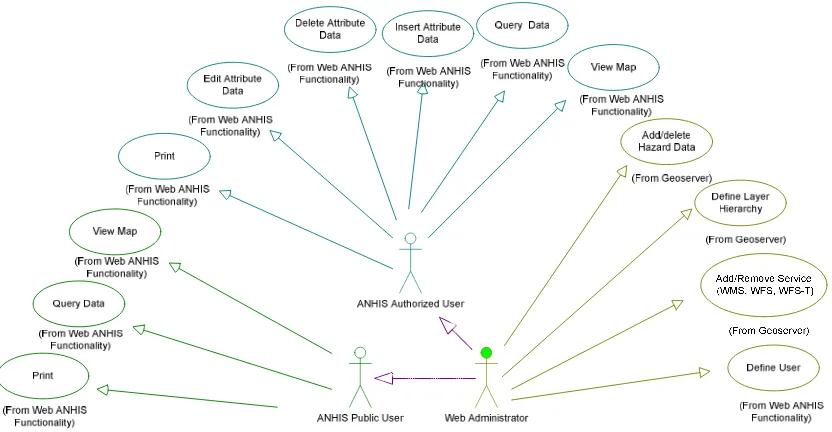
Figure 4. Use-case model for Web ANHIS.
Web ANHIS is used by three classes of users that are ANHIS public users, ANHIS Authorized users and Web Administrator. The use-case model for Web ANHIS is shown in Figure 4 which describes the relationship between user classes that represents ability of a user to play multiple roles. Each user class has different access functionalities as follows:
Web administrator has responsible for managing users, data and layer hierarchy. Administrator can layer hierarchy that is depending on a layer type, assign and remove WMS and/or WFS services to the layer.
ANHIS authourized users have all access to the available functionalities of web ANHIS application. But they cannot add and authorization new user. The authorized users can manage the attribute data by capturing knowledge of a feature’s attributes into a digital format stored on the temporary database or as files. Then, administrator will store the data on the master database. The attribute data are data for location based features, usually in the categories of point, line, polygon, coordinates, and includes statistical results from spatial analysis. The digitalizing process consists of drawing the geometry in the map view and then entering its attributes.
ANHIS public users have limited access to the available functionalities. They can access only for viewing maps, quering geographic features and printing of map.
3.3 Implemented Prototype and Function
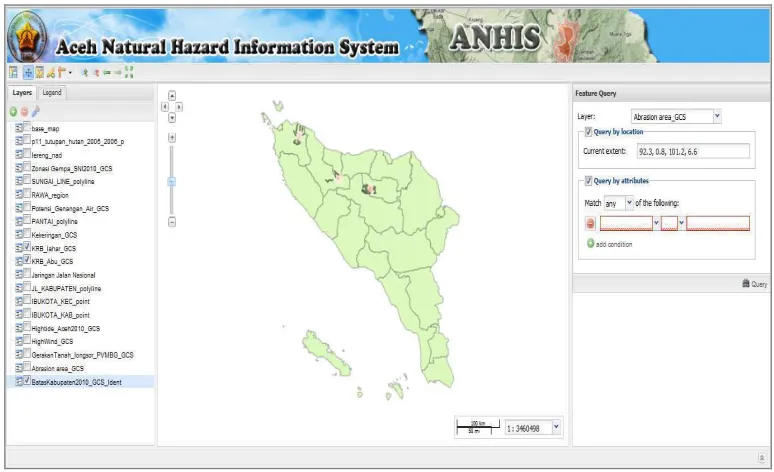
This sub section describes the implementation of prototype based on aforementioned architecture system. Figure 5 shows main page of prototype for ANHIS which visualizes the volcanoes hazard map. It is also as the web interface for public in order to view the hazard map.
The main items and functions of the implemented prototype for ANHIS are as follows: Main Map: It is located in the center of the web page as shown in the Figure 5, and is the main component to visualize the hazard map in Aceh. Its size could be adjusted by the left and right edges.
Layers and Legend Panels: The Panel are a tree layer and legend panel. The tree layer provides list available layers in the map and is also used to active or non-active the layer in the map as shown in Figure 6. While Panel legend will automatically generate the hazard zone of the active layer map as we can see in the Figure 6.
Toolbar: There are 10 functions of toolbar as shown in the top left side of Figure 5. The detail information for the toolbar functions is as follows:
Edit Feature ( ) is to edit or remove feature at map.
Lenght ( ) is to measure the distance of the selected area.
Area ( ) is to calculate the area of the selected area. Zoom in ( ) is zoom in to the selected area.
Zoom out ( ) is zoom out to the selected area. Back ( ) is back to the previous zoom.
Next ( ) is next to the extent zoom.
Zoom to max extent ( ) is to view map to a maximum extent.
Feature Query or Search Panel: It is to search a hazard data and to overlay with another harzard data. This search panel can be based on coordinate extent or attribute data as shown in the most right side of Figure 5.
Figure 5. Main page of Web ANHIS.
4. Results and Discussion
Numerous tools and implementation steps has been developed for the prototype of ANHIS. The expected result of the prototype is generating hazard maps for the primary natural hazards in Aceh. The present section provides several example visualizations generated with the prototype for ANHIS which illustrates its usefulness in obtaining natural hazards in Aceh and highlighting areas where the possible combinations of hazards might occur well known as multi-hazard area.
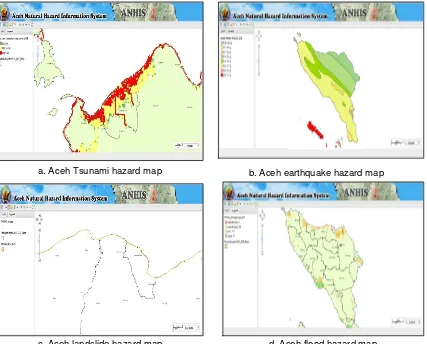
Figure 7. several hazards maps in the Web ANHIS.
One of the important issues in the disaster risk reduction is the generation of the hazard map. A hazard map can be utilized as a means of mitigating natural disaster by knowing its phenomenon. It is to provide disaster agencies, researchers and communities with the information on the range of possible damage and the disaster prevention activities. It is also the important point to provide them with understandable clear information. The prototype for ANHIS is mainly used to disseminate information about the hazardous areas for Aceh disaster agencies, researchers and communities in order to help them act on warning issue. As an example, Figure 7 shows several individual hazard maps for natural hazards and disaters in Aceh, including tsunami, earthquake, landslides and flood, which can be viewed by the Web ANHIS. The hazard maps are showing location and risk level of the natural hazards. Generally, three different colors have been used to identify risk levels (high risk zone, medium risk zone, and low risk zone) on the maps that are marked by red, yellow and green colors, respectively.
Besides the individual hazard map, it is important to look at the wider implications of hazards. Hazards that are interrelated (for example, an earthquake can trigger a landslide and
a. Aceh Tsunami hazard map
d. Aceh flood hazard map b. Aceh earthquake hazard map
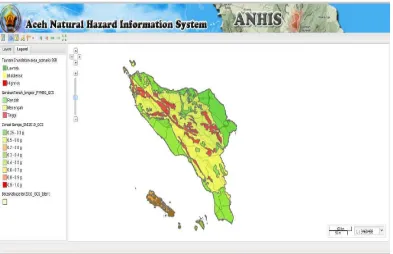
tsunami) need to be recognized in the planning process. Overlaying various hazards information within GIS can be used to identify and address multiple risks in specific locations. The prototype for ANHIS also has ability to generate such multi-hazard map as shown in the Figure 8. Figure 8 shows a multi-hazard map in which it combines earthquake, tsunami and landslide hazards. The red color in the map of Figure 8 is high risk areas for earthquake, tsunami and landslide hazards. The high risk level is defined by multiply each hazard with the score of the hazard in the standard of Aceh action plan for disaster risk reduction. These scores will be added. Then, the scores are classified from low to high. From the classification, the high score indicates the high risk level areas for all observed hazards. While the middle and low risk level areas are indicated by middle and low scores in which they are marked by yellow and green colors, respectively.
Figure 8. Multi-hazard map (earthquake, tsunami and landslide) in the Web ANHIS.
The main purpose of a multi-hazard map is to gather together in one map the different hazard-related information for an area of effect. A multi-hazard map may also be referred to as a "composite," "synthesized," and "overlay" hazard map. One area may suffer the presence of a number of natural hazards as shown in Figure 8. Many natural hazards can be caused by the same natural event. So, several hazards can more easily be seen through the use of a multi-hazard map. Multiple multi-hazard maps are an important tool in the integrated development planning process. The implemented prototype has several constraints as follows:
Analysis of depth data is limited to the district level.
Index score of disaster cannot be determined automatically. High risk area is determined manually by the user analysis.
5. Conclusion
software requirements, prototype design and functionalities. The designed prototype has been implemented by using one-computer configuration architecture and open source software applications. In the implemented prototype for ANHIS, many primary natural hazards in Aceh have been considered. They are tsunami, earthquake, flood, landslide, volcanoes, abrasion, drought, hightide and highwind.The results of prototype for ANHIS are an individual hazard map of them and a multi-hazard map that is to gather together in one map the different hazard-related information of them for an area of effect. A hazard map or multi-hazard map can be utilized as a means of mitigating natural disaster by knowing its phenomenon. It is to provide disaster agencies, researchers and communities with the information on the range of possible damage and the disaster prevention activities. Futhermore, the prototype for ANHIS is prepared for an online accessible and interactive system where it can support many usersand can be accessible from anywhere and at anytime through the Web. It will be important information system for coordinating across all user communities to reduce disaster losses. The proposed Web GIS based information system for Aceh natural hazards will be review and discuss with users regularly for the real implementation of ANHIS in the future.
Acknowledgement
This work was supported by Aceh government and funded by Multi Donor Trust Fund (MDTF) through Disaster Risk Reduction for Aceh (DRR-A) project, with United Nations Development Programme (UNDP) as implementing partner.
References
[1] Zahran K.H, Khalil H, Saleh S, Selim I. Tidal Stress Triggering Earthquakes Case Study the Eastern Part of the Indian Ocean. MESF Cyber Journal of Geoscience. 2007; 5: 1-27.
[2] Glassey P, Forsyth P, Turnbull I. A GIS-based Hazard Information System: Dunedin Pilot Project.
IPENZ Transactions.1997; 24(1/GEN): 16-23.
[3] Nappi R, Alessio G, Bronzino G, Terranova C, Vilardo G. Contribution of the SISCam Web-based GIS to the Seismotectonic Study of Campania (Southern Apennines): An Example of Application to the Sannio-area. Natural Hazards, Springer. 2008; 45: 73-85.
[4] Gogu C, Freimark H, Stern B, Hurni L. Web Based Information System for Natural Hazard Analysis in an Alpine Valley. In: Oosterom P, Zlatanova S, Fendel E. Editors. Geo-information for Disaster Management. Springer. 2008: 1271-1282.
[5] Kunz M, Lienert C, Hurni L. Understanding the Risk; Establishing of an Interactive System for the Visualization and Exploration of Natural Hazards and Associated Uncertainties. Proceedings of 24th International Cartographic Conference (ICC). Santiago de Chile. 2009: 1-11.
[6] Shi P, Wang J, Yang M, Chen J, Pan Y, Wang P, Fang W, Zhou W, Wang Y, Yuan Y, Xu X, Luo W. Understanding of Natural Disaster Database Design and compilation of Digital Atlas of Natural Disasters in China. Geographic Information Sciences. 2000; 6(2): 153-158.
[7] Dogru G, Selcuk T, Ozener H, Gurkan O, Toz G. Developing a Web-GIS Application for Earthquake Information. Proceedings of ISPRS Congress. Turkey. 2004: 1-4.
[8] Lu X. An Investigation on Service-Oriented Architecture for Constructing Distributed Web GIS Application. Proceedings of the 2005 IEEE International Conference on Services Computing (SCC’05). Florida, USA. 2005: 191-197.
[9] Song X, Kono Y, Shibayama M. The Development of Web Mapping Application Using Open Source GIS Solution. Proceedings of International Symposium on Geoinformatics for Spatial Infrastructure Development in Earth and Allied Sciences. Hanoi, Vietnam. 2004: 1-6.