accredited by DGHE (DIKTI), Decree No: 51/Dikti/Kep/2010 245
Comparison of Predictive Models for Photovoltaic
Module Performance under Tropical Climate
Koumi Ngoh Simon1,3*, Njomo Donatien1, Moungnutou Mfetoum Inoussah2,3 1
Environmental Energy Technologies Laboratory (EETL), University of Yaoundé I, PO Box 812 Yaoundé - Cameroon.
2
L3E, Energy, Water and Environmental Laboratory, National Advanced School of Engineering,
PO Box 8090 Yaoundé, Cameroun
3
Department of Thermal Engineering and Energy, University Institute of Technology Douala, PO Box 8698
email: [email protected]
*, [email protected],[email protected]
Abstrak
Makalah ini membahas empat model yang digunakan untuk mengestimasi kinerja modul photovoltaic (PV) ketika iradian dan suhu sel PV diketahui. Model disimulasikan, suhu operasi dan iradian yang bergantung dari efisiensi listrik PV dan keluaran daya dipelajari. Keakuratan model diperoleh dengan membandingkan model dan pengukuran daya maksimum pada modul polycrystalline typical MXS 60 PV pada iklim tropis. Model yang dievaluasi untuk mengestimasi daya maksimum adalah model dioda tunggal, sistem informasi geografis Photovoltaic (PVGIS), Borowy dan Salameh, dan model Hatziargyriou. Analisis kurva kesalahan menunjukkan bahwa model dioda tunggal dan Hatziargyriou memiliki akurasi yang lebih baik. Pendekatan PVGIS dan Borowy tidak tepat sebagai prediksi kinerja modul dalam iklim Sahel Sudan.
Kata kunci: iklim tropis, pemodelan, pendekatan Borowy, photovoltaic, PVGIS
Abstract
This paper examines four models which are used to estimate the performance of photovoltaic (PV) modules when the irradiances and PV cell temperatures are known. The models were simulated and the operating temperature and irradiance dependence of PV electrical efficiency and power output were studied. The models accuracy was obtained by comparing the models and the measurements of maximum power for a polycrystalline typical MXS 60 PV module under tropical climate. The evaluated models for estimating the maximum power are the single diode, the Photovoltaic geographical information system (PVGIS), the Borowy and Salameh, and the Hatziargyriou model. The analysis of the error curves shows that the single diode and Hatziargyriou model have better accuracy. The PVGIS and Borowy approach are not appropriate as the module performance prediction in Sudanese sahelian climate.
Keywords: Borowy approach, modeling, photovoltaic, PVGIS, tropical climate
Abbreviations
Voc Open-circuit voltage V
Vmp Voltage at maximum-power point V
Pm Power at maximum-power point W
k Boltzmann's constant,1,38x10-23 J/K
q Electronic charge, 1,6x10⁻¹⁹ C
TM Cell temperature inside module °C
Iph The photo-generated current A
IR Current owing in the shunt resistance A
Io The dark saturation current A
Is1 Saturation current due to diffusion A
Is2 The saturation current due to recombination A
Rs Cell series resistance Ω Rp The cell (shunt) resistance Ω A The diode quality factor
α0 Temperature coefficient of open-circuit voltage V/°C β0 Temperature coefficient of short-circuit current %/°C
ࣆࢇ࢞ Temperature coefficient of power %/°C Gi Solar radiation W/m²
G0 Solar radiation in standard conditions (1000 W/m²)
PVGIS photovoltaic geographical information system
1. Introduction
ISSN: 1693-6930
246
renewable energies, encouraging a more decentralized approach to power delivery systems [2]. Currently, photovoltaic (PV) generation systems are actively being promoted in order to mitigate environmental issues such as the green house effect and air pollution.
Recent technological advances in small generators, power electronics, and energy storage devices have provided a new opportunity for distributed energy resources that are located closer to loads [3]. The future of the Photovoltaic industry is promising as the efficiency of the cell and sub-modules continues to increase [4]. In spite of their relatively high cost, there has been very remarkable growth in installed Photovoltaic systems. However the sizing and the optimization of photovoltaic system is a difficult stage for the engineer because of the huge influence of meteorological conditions on the characteristics and performance of a photovoltaic module [5]. A number of studies have been made to determine how the efficiency varies for different PV technologies [6-7]. Availability of accurate models that must quantify how these meteorological factors individually influence the performance of all components of PV module is therefore essential in system sizing, cost analysis and monitoring.
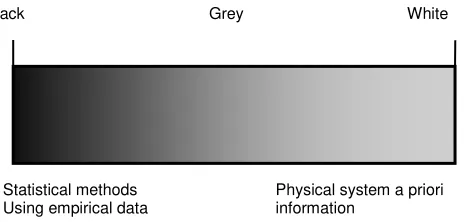
The review of literature presents some background knowledge on the modeling of PV module [8,9]. Models that use constant parameters have been proposed [10] but these models are inaccurate as they do not account for temperature variation. Recently, a lot of researchers have developed single exponential models that neglect the shunt resistance [11,12]. Other researchers have developed models that take account of temperature and irradiance based on datasheet information [13]. Depending on the a priori knowledge of the system structure three different classes of models of the system can be produced as shown in figure 1 [14].
However, many mathematical models and PC software applications for photovoltaic sizing are only appropriate for non tropical region where they are built in. it is important to avoid mistake to make some validations under tropical climate which is not well know.
The aim of the present work is to examine four models among the most used to estimate the performance of photovoltaic (PV) modules under a Sudanese sahelian climate. The operating temperature and irradiance dependence of PV electrical efficiency and power output is simulated. The models accuracy is also computed by comparing modeled and measured maximum power under real conditions. This will help local engineers and technicians working on PV system to choose the most appropriate model for system sizing.
Figure 1. Modeling conceptual sketch
2. Research Method 2.1. Experimental Setup
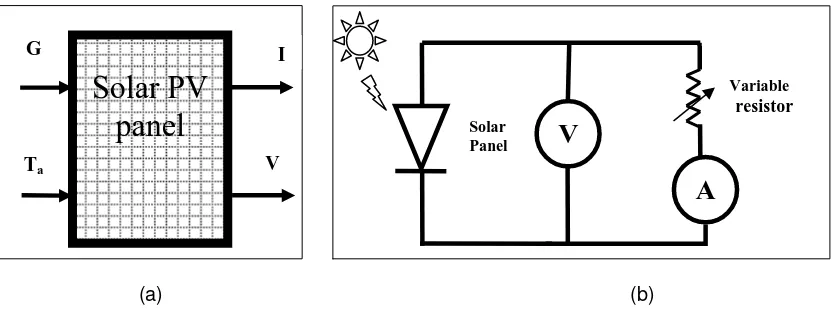
The experiment was performed using a commercial solar cell Solarex MSX60 [15]. The MSX 60 module provides 60 watt of nominal maximum power, and has 36 series connected polycrystalline silicon cells (see table 1). The basic equipment needed for this experiment is an ammeter, a voltmeter and a decade box of resistors (Figure 2). It is important to choose a high impedance voltmeter and low impedance ammeter to prevent loading the circuit. Measurements of global and diffuse incident solar irradiations were carried out using Eppley PSP pyranometers. For temperature measurement, an Universal temperature probe Model EI-1034 is used in association with LABJACK U3 module Transmitter.
The experimental prototype is set up at Garoua (9°20' N; 13°23' E; altitude 241 m) a
tropical region characterized by a Sudanese-Sahelian climate, located at the north of Grey
Black White
Statistical methods
Cameroon. The data obtained from the meteorological station shows a mean annual solar irradiation of 5,5 kWh/m2 per day and the direct sunshine is over 3000 h per year [16]. The site selected for the experimentation is then propitious to implementation and use of PV systems.
(a) (b)
Figure 2. (a) Schematic diagram of the experimental set up; (b) Schematic circuit diagram for determining I and V of a solar cell.
Table 1. Typical electrical characteristics MSX-60 [15]
MSX-60
Maximum power (Pmax) 60W Voltage at Pmax (Vmp) 17.1V Current at Pmax (Imp) 3.5A Guaranteed minimum Pmax 58W Short-circuit current (Isc) 3.8A Open-circuit voltage (Voc) 21.1V Temperature coefficient of open-circuit voltage . . . –(80±10)mV/°C . Temperature coefficient of short-circuit current . . . (0.065±0.015)%/°C Temperature coefficient of power . . . (0.5±0.05)%/°C . . NOCT . . . 47±2°C . . . . . .
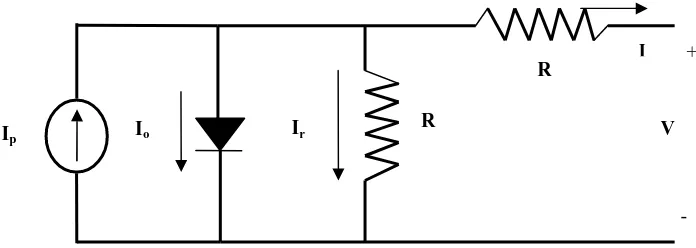
2.2. Model for Estimation of Maximum Power Output from a Photovoltaic Module 2.2.1. First Approach: Single Diode Model [17]
This single diode model assumes that the dark current of a solar cell can be described by a single exponential dependence modified by a diode quality factor as depicted in nonlinear and implicit Equation (1)[18]. The values of the parameters Iph, Is1, Rs, Rsh and A in the equation must be determined to reproduce the IV curve. This requires five equations that will be solved simultaneously to obtain the parameter values [19].
=−
(࢙
− −࢙
(1)
At the open-circuit point on the IV curve, V = Voc and I = 0. After substituting these values in (1) the first needed equation is obtained:
=−
− −
(2)
At the short-circuit point on the IV curve, I = Isc and V = 0. After substituting these values in (1) the second needed equation is:
=−
ࡿ࢙
− −ࡿ࢙
(3)
V
A
Solar Panel
Variable
resistor
Solar PV
panel
GTa
I
ISSN: 1693-6930
248
Figure 3. The single exponential model of photovoltaic cell
At the maximum-power point on the IV curve, I = Imp and V = Vmp. After substituting these values in (1), a third needed equation is obtained:
=−
(࢙)
− −࢙
(4)
More equations can be obtained by obtaining the derivative of (1) with respect to V:
At the open-circuit point again, on the IV curve V = Voc and I = 0 therefore,
=
| (6)
Substituting in (6) the following results:
The power transferred from the PV at any point is given by:
= (9)
The power equation (9) can be differentiated with respect to the voltage, V:
=
+
(10)
To find the value of voltage that gives the maximum power the derivative is equated to 0.
= −
(12)
Substituting in (6) the following equation is obtained
−
Among the equations obtained, equations (2) (3) (7) (8) (13) are the five equations we have choose for numerical resolution using the Newton Raphson method. The initial values of Iph, Is1, Rs, Rsh and A used in the algorithm are similar to analytical expressions obtained from [20], [21].
2.2.2. Second Approach: Model of Borowy and Salameh [22]
The mathematical model (22) was developed by Borowy and Salameh in 1996. The model derived from the single diode model that uses the PV cell characteristic specify by the manufacturers. It gives a simple relation to compute the maximum power delivered from a PV array.
I=−
ࡻ− +∆
(22)
D1, D2 are two parameters computed from the relations (23) and (24).
=−
The tension Vm of module is given by the relation (27):
=+,
+ ∆−∆ (27) The power output from the module is:
P = I × V (28)
2.2.3. Third Approach:Model ofHatziargyriou [23]
Knowing the technical characteristic provided by the module supplier and local meteorological conditions, only one empirical equation is needed to compute the power output from a module [23].
=
!+"#−$%
(29)
Since the module temperature TM is not known a priori, the following approximate relation between TM, the ambient temperature Tamb and the nominal operating cell temperature NOCT, provided by the module supplier, has been employed [24,25]:
=+&
module (ηrel), i.e. the efficiency
' !#&", $ ) cy relative to the efficiency η0 measured at STC:
,"#. $/ 0 * + 1
#, C1, C2 are empirical and were already determine
these relationships between PV module p
gle diode model of the PV module was implemente ct of temperature and irradiance on the performanc directly from the manufacturer’s published curves. e used to simulate the power output from the modu
°23' E; altitude 241 m) and the result are compare
Conditions
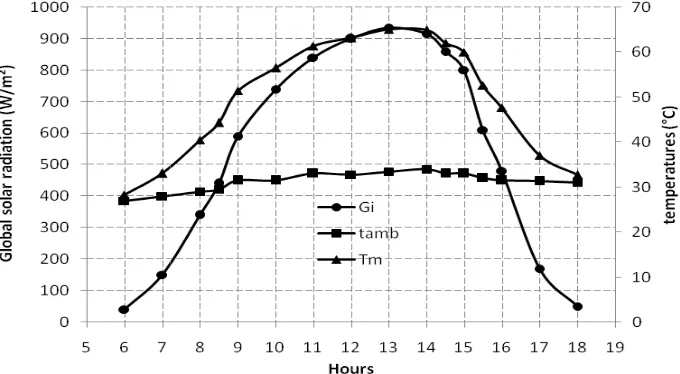
rly variation of global solar radiation Gi and tem me figure the temperature of module compute fro
tion of global solar radiation and temperature for the aroua (9°20' N; 13°23' E; altitude 241 m)
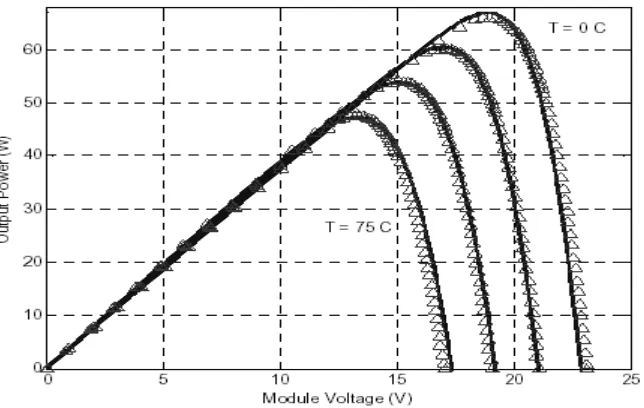
ristic with temperature and irradiance using sin clear view on how the curves vary with temperat ken directly from the manufacturer’s published c
There is significant reduction in the power output of the photovoltaic system as cell temperature increases. This relationship is clearly depicted in Figure 6 where the power is plotted as a function of voltage for 4 different temperatures.
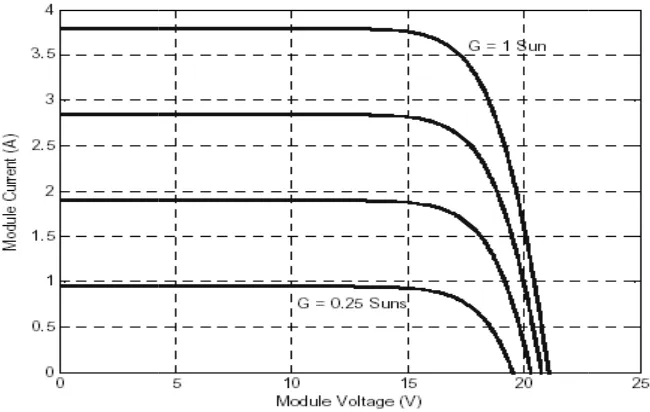
To show the effect of irradiance on the performance of a module the temperature is kept fixed at 25 °C and the values of irradiance are cha nged to different values. The variation of the current-voltage characteristics with irradiance are shown in Figure 7. It is quite clear that irradiance has a major effect on the short circuit current and indeed the relationship between irradiance and the short circuit current is a linear one.
Figure 5. Curves for a photovoltaic module at different temperatures
Figure 6. Variation of power output with temperature for a photovoltaic module
252
Figure 7. V
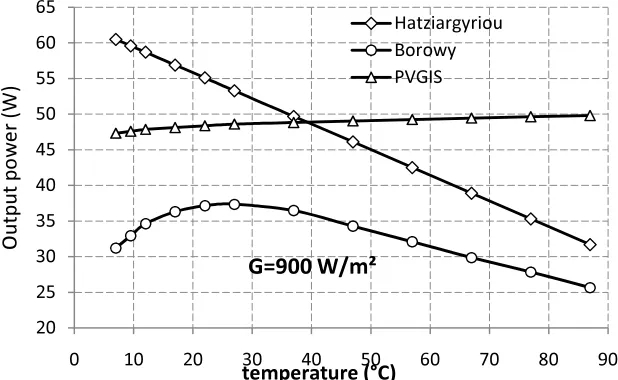
3.3. Variation of Output Po The study is made for models tested are PVGIS, Bo Globally, it turns out that th decreasing substantially with electrical properties of the se approach reveals that there is values of temperature (5°C - model of Borowy. In other h irradiance.
Figure 8. Variatio
Variation of current and voltage with irradiance.
Power with Temperature
for values of solar radiation varying from 300 W/m² Borowy and Hatziargyriou. The result is depicted i the power output depend linearly on the opera ith TM as the thermally excited electrons begin semi-conductor. In contrast to others tested m
is no significant variation of output power with temp 25°C) we denote a non linear variation of power r hand, it is quite clear that the power output i
tion of Power output with temperature ( G = 300 W
ISSN: 1693-6930
² to 900 W/m². The d in figure 8, 9, 10. rating temperature, in to dominate the models the PVGIS mperature. For low er wit h TM with the t increase with the
Figure 9. Variation of Power output with temperature ( G = 500 W/m²)
Figure 10. Variation of Power output with temperature ( G = 900 W/m²)
3.4. Comparison of Power Output from Solar Panel in Real Meteorological Conditions The power output from the solar panel using different models described above is computed in real meteorological conditions (see figure 7). Experimental and compute data are depicted in figure 11. The accuracy of different models in real conditions is study by using the relative error from formula (33).
333=|ࢋࢇ࢙࢛࢘ࢋࢊࢊࢋ|
ࢋࢇ࢙࢛࢘ࢋࢊ
(33)
In figure 11 and 12, we denote that for low values of solar radiation (< 600 W/m²) and temperature observed from 6AM to 9AM and from 4 PM to 6 PM, the single diode model and Hatziargiriou model are the more accurate. In reverse, for high values of solar radiation (600≤G≤950 W/m²) observed from 10AM to 3 PM, the PVGIS and Borowy model are more accurate. In general, at the morning and at the evening the mathematical models are not in good accordance with the experience. Even at the midday despite the high value of solar radiation, there is significant reduction in the experimental and the computed power output from the photovoltaic system due to high value of cell temperature under tropical climate which affect
ISSN: 1693-6930
From the error curve shown in figure 12 and in table 2 we can conclude that the single diode model and Hatziargyriou model are appropriate for PV module performance in tropical sahelian region. The PVGIS model and Borowy approach are inaccurate due to the fact they do not well account for temperature variation. The single diode despite it better accuracy is difficult to use and solve in the mathematical form describe above. It can be easily use through the PC software package PVSIST [29] for the study and the sizing of complete PV under Sudanese sahelian climate.
Figure 11. Computed and experimental value of power output from solar panel for the month of May in Garoua (9°20' N; 13°23' E; altitude 241 m)
Table 2. Mean error by different model Mean error generated (%)
Model 6 AM to 9 AM 10 AM to 4 PM 4 PM to 6 PM Daily
Single diode model 8,9% 6,5% 15,3% 10,2%
PVGIS model 36,9% 12,5% 72,2% 40,5%
Borowy & al. Model 26,5% 13,4% 33,6% 24,5%
Hatziargiriou model 13,9% 12,7% 9,1% 11,9%
4. Conclusion
A comparison of four models based on the output power from photovoltaic module was done under real tropical meteorological conditions to determine their accuracy. The single diode model, the PVGIS model, the Borowy and Salameh model, and the Hatziargiriou model were implemented using a numerical program to simulate the effect of temperature and irradiance on the performance of the tested module. A comparison was done between the power obtained from experimental set-up and from simulated models. The analysis of the curves shows that the single diode model has the better accuracy whereas the PVGIS approach seems to be not appropriate for the tropical region. This work is the first attempt to make some validation on predictive models for PV module performance under Sudanese sahelian climate and will later be extended to other models and PV technologies.
References
[1] Philipson L. Distributed and Dispersed Generation: Addressing the Spectrum of Consumer Needs.
Power Engineering Society Summer Meeting. 2000; 3: 1663-1665.
[2] Sunil M, Mungalpady A. Case Study of a Hybrid (Wind and Solar) Power Plant. Telkomnika. 2011;
9(1).
[3] Munhamed Nizam. Kohonen Neural Network Clustering for Voltage Controle in Power Systems.
Telkomnika. 2010; 8(2).
[4] Green A, Emery K. Short Communication Solar Cell Efficiency Tables (version 31), Progress in
Photovoltaics. Research and Applications. 2008; 16: 435-440.
[5] Khan M, Iqbal M. Dynamic Modeling and Simulation of a Small Wind–Fuel Cell Hybrid Energy
System. Renewable Energy. 2005; 30: 421–439.
[6] Markvart T, Castaner L. Practical Handbook of Photovoltaics. Fundamentals and Applications: Elsevier. 2003.
[7] King D, Kratochvil J, Boyson W, Bower W. Field Experience with a New Performance
Characterization Procedure for Photovoltaic Arrays. Proceedings of the 2nd World Conference and Exhibition on Photovoltaic Solar Energy Conversion. Vienna. 1998.
[8] Kroposki B, Marion W, King D, Boyson W, Kratochvil J. Comparison of Module Performance
Characterization Methods. 28th IEEE PV Specialists Conference. 2000; 1407-1411.
[9] Woyte A, Nijs J, Belmans R. Partial Shadowing of Photovoltaic Arrays with Different System
Configurations. Literature Review and Field Test Results. Solar Energy. 2003;74: 217-233.
[10] Gow J, Manning C. Development of Photovoltaic Array Model for Use in Power-Electronics
Simulation Studies. IEEE Proceedings of the Electrical Power Appliances. 1999; 146(2):193–200.
[11] Xiao W, Dunford W, Capel A. A Novel Modeling Method for Photovoltaic Cells. Power Electronics
Specialists Conference. PESC 04. IEEE 35th Annual. 2004; 3: 1950-1956.
[12] Walker G. Evaluating MPPT Converter Topologies Using a Matlab PV Model. Journal of Electrical
and Electronics Engineering. 2001; 21(1): 49-56.
[13] Sera D, Teodorescu R, Rodriguez P. PV Panel Model Based on Datasheet Values. Industrial
Electronics, 2007. ISIE 2007. IEEE International Symposium. 2007; 2392-2396. [14] Ljung L. System Identification. Prentice Hall. 1987.
[15] www.solarelectricsupply.com/pdf/Solarex/Solarex-MSX64.pdf. [16] Cameroon National Meteorological Service Reports.
[17] Liu S, Dougal R. Dynamic Multiphysics Model for Solar Array. Energy Conversion, IEEE Transaction.
2002; 17: 285-294.
[18] Gow J. Development of a Photovoltaic Array Model For Use In Power- Electronics Simulation Studies
in Electric Power Applications. IEE Proceedings. 1999; 146: 193-200.
[19] Kennerud K. Analysis of Performance Degradation in CDS Solar Cells. Aerospace and Electronic
ISSN: 1693-6930
256
[20] Borowy B, Salameh Z, Pierrat L, Wang Y. Methodology for Optimally Sizing the Combination of a
Battery Bank and PV Array in a Wind/PV Hybrid System. IEEE Transactions on Energy Conversion,
Congrès, 1995 IEEE/PES Summer Meeting. USA: Portland, OR. 1996; 11(2): 367-375.
[21] Phang J, Chan D, Phillips J. Accurate Analytical Method for the Extraction of Solar Cell Model
Parameters. Electronics Letters. 1984; 20: 406-408.
[22] Chan D, Phang J. Analytical Methods for the Extraction of Solar-Cell Single and Double-Diode Model
Parameters From i-v Characteristics. Electron Devices, IEEE Transactions. 1987; 34: 286-293.
[23] Hatziargyriou. Modelling of ΜicroSources for Security Studies. Paris: CIGRE. 2004.
[24] Ross R. Flat-plate Photovoltaic Array Design Optimization. 14th IEEE Photovoltaic Specialists
Conference. 1980: 1126-1132.
[25] Markvart T. Solar Electricity. John Wiley & Sons. Chichester. 1994.
[26] Šúri M, Huld T, Dunlop E. PV-GIS: a Web Based Solar Radiation Database for the Calculation of PV
Potential in Europe. International Journal of Sustainable Energy. 2005; 24: 55-67.
[27] Šúri M, Hofierka J. A New GIS-based Solar Radiation Model and Its Application to Photovoltaic
Assessments. Transactions in GIS. 2004; 8: 175-190.
[28] Kenny R, Friesen G, Chianese D, Bernasconi A, Dunlop A. Energy Rating of PV Modules:
Comparison of Methods and Approach. Proceedings of the 3rd World Conference on Photovoltaic Energy Conversion. Osaka. 2003.
[29] Mermoud A, Lejeune T. Performance Assessment of a Simulation Model for PV Modules of Any
Available Technology. 25th European Photovoltaic Solar Energy Conference (EU PVSEC). Valencia,