DOI: 10.12928/TELKOMNIKA.v12i3.77 541
Departement of Electrical, University Technical Malaysia Melaka ,UTeM, Hang Tuah Jaya,76109 Durian Tunggal, Melaka, Malaysia
b
Jurutera Perunding Zaaba , JPZ, No. 4 Jalan Puncak Setiawangsa 4, Taman Setiawangsa, 54200, Kuala Lumpur Malaysia
Email: [email protected] 1a, [email protected], [email protected], [email protected], [email protected], [email protected],
Abstract
This paper describes the impact of development distribution in order to identify optimum location and size for distribution generation (DG) in power system network. High demand on the load will cause unstable control power distributed through power loss via power transmition. Therefore small-scale electricity generation is required to ensure large power generated can be used for particular location to minimize power losses. In addition, the implementation of distribution generation will help to reduce the capital cost compared to the existing power plant due to space, speed and power requirement. Thus proper DG location will significantly improve the impact of the power flow analysis by considering the source of energy which is easily obtained. This study will be conducted by using Matlab and the proposed algorithm (MPEP) will be applied on IEEE 30 buses radial distribution system network. As a result, the DG can be located at optimal location and size depending on the losses consume in various type of DG technology systems used in the network. On the other hand, the condition and location DG itself will generate optimal power contribution depending on design strategies that have been implemented.
Keywords: multi population evolutionary programming, migration, optimal location and sizing, IEEE distribution system
1. Introduction
Nowdays, distribution network system plays an important role to enhance electrical power sources delivered from generation to end user. The system will distribute electricity via power line by considering the realibility and economic wise based on need or demand required by consumer. Since the distribution requires some of sources to distribute energy, DG source is an alternatively element that can be considered to cater the rapidly energy need directly from consumer. However, the influence of transformer will affect the load requirement and energy transformation capacity based on design strategies that have been used. There are two distribution system categories that have been implemented in Malaysia; utility subsystem and facility subsystem.
As mentioned earlier, DG will inject the energy or electricity through distribution system that might require input source to generate power. Therefore a lot of sources that might be considered to install the DG based on type and location needs. Generally, DG is related to the small power sources which mean as electrical power generation that directly connected to the electric grid of distribution network [1],[2]. The use of DG can be classified into two major factors that focus on the renewed interest in distributed generation i.e. electricity market liberalization and environmental concerns [1].
Table 1. DG types sizing capacity Micro distributed generation: 1 Watt~5 kW
Small distributed generation: 5 kW~5 MW
Medium distributed generation: 5 MW~50 MW
Large distributed generation: 50 MW~300MW
In the last decade year, the increasingly widespread usages on technology and innovations have changed the type of distributed generation to become valuable. Recently others country start to use renewable energy, thus it is required to install generation system that may be applied either at home, business, or other privately- owned property. Thus, Table 1 shows the type of technology that uses for DG installation based on the size rating.
There are several reasons due to the increasing of technology on DG such as highly potentials and advantages, increasing of electrical demands, technical and economical constraints in construction of new power plants and new transmission lines. Therefore the advantages of distributed generation can be categorized into three keys; technical, economical and environmental benefits [3].
Technical: the producing on good efficiency, grid reinforcement, power lossess reduction, reliability, eliminating or deferring the upgrades of power system, improving load factors and voltage profile and thus increased power quality.
Economic: the operating cost reducing on transmission and distribution (T&D), shorter construction times, to save the fossil fuel and decreasing in electricity price.
Environmental: the reductions in emission of greenhouse gases and to overcome the global warming.
Since the usage of DG technology is widely used, it requires the planning of electric system which is suitable to the distribution network. It could be consider as one of the most viable options to ease some of problems faced in power systems, for example high losses, low reliability and poor power quality [4]. Therefore by identifying several factors such as type of technology, good location and capacity of the units are the important part for DG installations.
Study about DG installation, it is essential to determine the size and location of the local generation being placed to reduce the line losses [5]. There are several of studies on the optimum DG placement for minimum power losses such as 2/3 rule [6], optimal power flow approaches [8], analytical approaches [7] and the artificial intelligent methods such as Genetic Algorithm [9], Tabu Search [11] and Particle SwarmOptimization [10]. In addition, other artificial intelligent used is Evolutionary Programming which an algorithm method that was originally introduced by Dr. Lawrence J. Fogel in 1960. Evolutionary Programming (EP) is defined as a mutation-based evolutionary algorithm applied to discrete search space. Thus basic steps to apply EP technique are initialization, mutation, combination and selection [12]
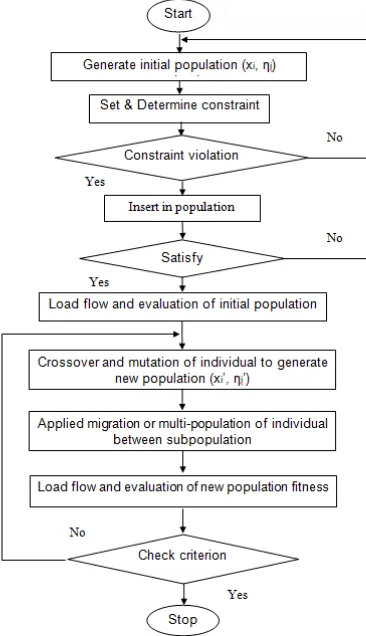
On this study, an optimized multi population evolutionary programming (MPEP) is described to analyze the optimal location and size of distributed generation by regenerating new population on the system or called migration or multi population. In order to conduct the study, an allele migration technique has been proposed to incorporate with MPEP algorithm as mentioned above.
2. Research Method
Proposed methodology in this paper is presented to identify the optimal sitting and size of distributed generation installation by monitoring power losses at minimum power and to identify the best size due to the locations of DG installed. Thus, the objective function and imposed constraints of the location and size method are defined as follow:
i. Objective function
this system to optimize the objective function. For the losses minimization case and load flow analysis, the objective function f is given by:
∑ (1)
(2)
Where:
Pi is the real power losses of n bus distribution system. Ii is the current magnitude
Ri is the resistance
ii. Imposed constraints
The generator voltage will be the load/bus voltage plus some values related to the impedance of line and power flows along the line. It proves the larger the impedance and power flow, the larger the voltage rise. The increased active power flows on the distribution network have a large impact on the voltage level because the resistive elements of lines on distribution networks are higher than others line. This causes to X/R ratio of approximately 1 rather than a more typical value of 5 on transmission networks [13]. Generally, the stability assumption for all node voltages is maintained between 0.95 and 1.05 pu. The voltage must be kept within standard limits on each bus; it can be expressed as:
Vi, min ≤ Vi ≥ Vi, max (3)
As DG is have a specific limitation by depending on the type of energy resources at any given location, the active power for DG is necessary to be set up by its lower and upper limits as:
Pdg, min ≤ Pdg ≥ Pdg, max (4)
2.1 Evolutionary Programming (Ep)
Evolutionary Programming (EP) is one of the artificial intelligence computational engines for doing optimization process in the power system which can be represented by using mathematical equation. This algorithm technique consists of several programming codes development processes which are initialization, fitness calculation, mutation, combination, selection and finally convergence test to produce results.
i. Initialization
Evolutionary programming is one of the compensation techniques where the algorithm used in the particular load has a potential to cause the system to optimize. Hence, the initialization process is required to generate 20 populations by randomizing the various numbers input variables where some of them are variables for location while others are DG size. Therefore this process is the main objective for this project. In addition, through the requirement of RPP, the injected Var value will be randomized based on the market applications. Therefore, the r andom number generation will be used based on the MATLAB syntax below:
Xlocation = round(rand(x,y) * A+B)) (5)
Xsizing = rand(x,y) * A+B (6)
ii. Fitness Calculation
Fitness calculation is the process where the equation/function/subroutine is to be optimized. It can be a single mathematical equation or a long subroutine. The objective is to maximize the minimum losses by injecting the reactive power into the system.
busdata (bus_no1,11)=xQ_injected (bil_01) (8)
iii. Mutation
Mutation is the process to breed the offspring from the generated random number based on the Gaussian Mutation equation as below:
, , 0, (9)
iv. Combination
This process is a combination between the parent and offspring in series by rows. The number of rows will be doubled.
v. Selection
After the offspring was generated by the mutation process, it will combine with the parents to proceed with the next step named as selection. Since this project is to maximize the minimum losses, therefore the main objective of selection process is to select the best survival represented as minimum power loss which has a potential to be adopted in new generation definition process.
vi. Convergence Test
The convergence test is to determine the stopping criterion by defining the minimum fitness and maximum fitness ≤ 0.0001. MATLAB syntax of convergence test can be expressed as shown below:
maxfitness – minfitness = ≤ 0.0001 (10)
The process will be continuously repeated until it achieves target tolerance as required.
2.2 Ellele Migration On Evolutionary Programming
Technique of EP is preferable to solve any power system matters. If EP is modified by adding some others technique, it will become more powerful and efficient. As to optimize the system, multi population or migration is the technique which can make an improvement on the systems. This mechanism named as Alleles migration technique is to select the best location and size by giving the maximum value of minimum voltage. Generally, Allele’s migration is a method to generate a new population by modifying a mutation value [14]. The migration models can be express in the equation below:
P1(t + 1) = ((1 − m)*P1(t) ) + (m*P2(t)) (11)
m=rand(1,1)*1 (12)
Where:
m is random number of the fraction of population. P1 is the variable of initial load.
P2 is the variable of mutation value.
3. Results and Analysis
The purposed of this method is to show the effectiveness of the Multi population traditional EP algorithm on IEEE 30 bus radial distribution system. All the results has been determined by using several type of DGs system such as wind turbine, photovoltaic PV, micro hydro and others DG technology to generate the tested system. The analysis will be divided into two conditons which are with and without DG contributions.
3.1. Analysis without DG implementation
The base case power flow is carried out for the IEEE 30 bus system without including DGs. It is inferred the active power loss is 14.27 MW while reactive power loss is 4.74 MVar. The voltage magnitudes at all the buses are shown in Figure 2. Based on the results, it clearly states the minimum voltage values can be easily identified through the chart which located from bus no 22 to 27. In order to determine the loss set on the system, the injected reactive power on the bus no 10 is required to identify the pre-optimize value for the real and reactive power. The set up value for real and reactive power for the pre optimization is 7 MVar. Therefore, the power loss for the system is 3.1065 MW.
Table 2. Base value without DG installation
P load (MW) 14.27
Q load (MVar) 4.74
Voltage magnitude (Vm) 0.9417 < Vm < 1
Power Losses, MW 3.1065
Figure 2. Voltage profile without DG for IEEE 30 bus Distribution systems.
3.2. Analysis with DG
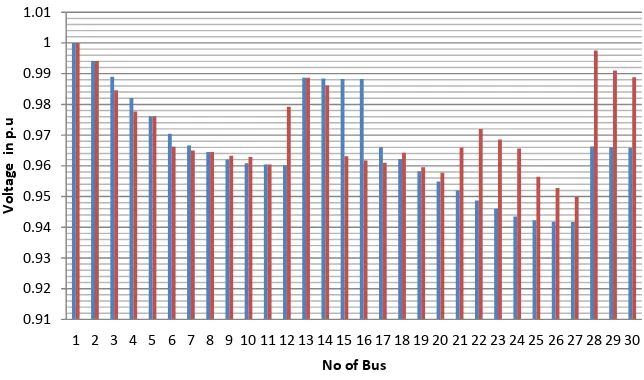
The principal of the DG installation can be simplified as a PQ bus modeled in the network. Generally, load flow study explains the DG systems act as sources by injecting reactive power to the system depending on the type and size of DG installation. Commonly, injecting in PQ buses will impact the losses and voltage profile through all the system. As mentioned earlier, the voltage profile can be improved by inducing reative power called as Var sources in particular location for reducing the losses occurred in the network system. Therefore, it can be clearly proved that the increasing of voltage profile on each bus will slightly reduce the losses by installing DG as stated in Figure 3 below.
Figure 3. Voltage profile before and after compensented
Based on the results, the comparison have been made between both cases whereby with and without DG installation in the network system. The blue colour represents uncompensented voltage profile while red colour represents compensented voltage profile by injecting reactive power in the certain area at the test network system. Synchronous voltage compensator (SVC) has been used to inject the reactive and real power in load bus as required.
with 2 DG
Pload (MW) 14.27
Qload (MVar) 13.513
Power losses (MW) 2.9507
min(Vm) 0.9501
Optimal Location 29 16
DG Optimal Sizing (MW) 2.7879 7.1979
Q injected
Bus 2 -15.6787
Bus 11 2.4854
In addition, capacitor has been injected into two generator nodes which are bus 2 and 13 located on the load bus. Thus, it obviously shows the voltage is slightly improved. The maximum voltage is 1 pu while minimum voltage is 0.95 pu. The low voltage levels started from bus 21 to 30 have been improved by installing the DG.
Table 3. Real power losses and voltage profile with 1 type of DG installation
with 1 DG
Pload (MW) 14.27
Qload (MVar) 8.6937
Power losses (MW) 2.8071
min(Vm) 0.9502
Optimal Location 23
DG Optimal Sizing (MW) 4.55511
Q injected
Bus 2 -42.9363
Bus 11 -7.1166
In order to identify the optimal size and location of DGs thus there are two different locations have been considered for these studies in order to install of DGs technology. Therefore through Table 3 and Table 4, the losses have been indicated based on constraint of real losses respect to the set up losses while voltage profile is improved due to Var injection into the load bus system.
Based on Table 3, it shows the location for installing 1 type DG technologies through the system is bus node 23. The type of DG used is wind turbine with the standard range of size from 250W to 3MW. Since the size that produced on the system is 4.55511 MWthat close to 5MW thus it is suitable to be applied on the system.
Table 4. Real power losses and voltage profile with 1 type of DG installation
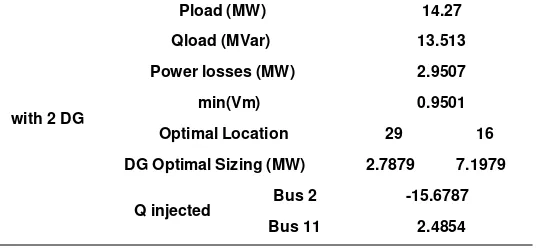
Table 4 indicates the use of two types of DGs which are micro hydro and photovoltaic PV. The optimal location and size for PV system is bus node 16 with 7.1979 MW close to 8MW. Then, others type of DG used are micro hydro where the standard size of wind turbine is from 200 W to 3 MW. The optimal location and size for this DG technology is bus node 29 with 2.7879 MW which is suitable for this system. In order to maximize the minimum losses while improvise the voltage profile, the power losses produced is 2.9507 MW and 0.9501 pu which less than base cases conditions.
4. Conclusion
voltage profile due to DG installation. Based on the pre optimization result in Figure 3, without considering DG in the system will cause unstable voltage conditions; 0.9417 < Vm< 1 p.u. Thus, reactive power has been used to inject Var source through the network system to enhance power loses as well as voltage profile. Inducing Var will require SVC and capasitor. In addition, change PQ buses will affect the voltage and losses in the system required. Furthermore, multi population of traditional (EP) can be used as a tool to identify the optimal location and size based on the system applied. As a contribution, this study can be applied to the various type of application especially toward green technology studies.
Acknowledgements
This research was supported by grant from Universiti Teknikal Malaysia Melaka and also technically support from Researchers.
References
[1] G. Pepermansa, J. Driesenb, D. Haeseldonckxc, R. Belmansc, W. D’haeseleerc. Distributed generation: definition, benefits and issues.Energy Policy. 2005; 33: 787–798.
[2] Thomas Ackermann, Go¨ran Andersson, Lennart So¨der. Distributed generation: a definition.
Electric Power Systems Research. 2001; 57195–204.
[3] Abookazemi K, Hassan MY, Majid MS. A review on optimal placement methods of distribution generation sources. In Power and Energy (PECon), 2010 IEEE International Conference on. 2010: 712-716.
[4] Zhu, Jizhong. Optimization of power system operation. Wiley-IEEE Press. 2009; 49.
[5] Ramalakshmi, S. S. Optimal siting and sizing of distributed generation using fuzzy-EP. In Recent Advancements in Electrical, Electronics and Control Engineering (ICONRAEeCE), 2011 International Conference on. 2011: 470-477.
[6] HL Willis. Analytical methods and rules of thumb for modelling DG- distribution interaction, presented at Power Engineering Society Summer Meeting. 2000; 3: 1643–1644.
[7] N. Acharya, P. Mahat, N. Mithulananthan. An analytical approach for DG allocation in primary distribution network. Electrical Power and Energy Systems. 2006; 28: 669–678.
[8] GP. Harrison, AR. Wallace. Optimal power flow evaluation of distribution network capacity for the connection of distributed generation. IEEE Proc. Gener. Trans. Distrib. 2005; 152: 115–122. [9] RK. Singh, SK. Goswami. Optimum siting and sizing of distributed generations in radial and
networked systems. Electric Power Components and Systems, 2009; 37: 127–145.
[10] A. Hajizadeh, E. Hajizadeh. PSO-based planning of distribution systems with distributed generations. World Academy of Science, Engineering and Technology. 2008; 45: 598–603, 2008. [11] MEH. Golshan, SA. Arefifar. Distributed generation, reactive sources and network-configuration
planning for power and energy-loss reduction. IEE Proc.-Gener. Transm. Distrib. 2006: 127–136. [12] Bäck, Thomas. Evolutionary algorithms in theory and practice: evolution strategies, evolutionary
programming, genetic algorithms. Oxford University Press on Demand. 1996.
[13] Tan, WS., MY. Hassan, MS. Majid. Multi population genetic algorithm for allocation and sizing of distributed generation. In Power Engineering and Optimization Conference (PEOCO), 2012 IEEE International. 2012: 108-113.
[14] Chen, Chuansheng, et al. Population migration and the variation of dopamine D4 receptor (DRD4) allele frequencies around the globe. Evolution and Human Behavior 20.5. 1999: 309-324.
[15] Hatziargyriou, Nikos, Nick Jenkins, Goran Strbac, JA Pecas Lopes, J. Ruela, A. Engler.