Floribunda 3(4): 85-112. Oktober 2007
DAFTAR ISI
Progeny Analysis of the Tasikmalayan Mangosteens (
Garcinia mangostana)
with E-RAPD
Markers
セセMセセセセMセZセN。セMセMセセセセMセセセセセMセMセ・MセZセセセセセェセセMセMセZNiセゥャャQQセセセMセMセセセセMセセ。Mセゥ@
セ@
Genetic Diversity of
Pandanus
and
Freycinetia
from Java Based on ISSR Marker
Sri Endarti Rahayu, Alex Hartana, Tatiek Chikmawati & Kuswata Kartawinata
... 95-103
Anatomi Daun dan Taksonomi
Syzygium zippelianum
Miq.,
S.javanicum
Miq. danS.
racemosum
(Bl.) DC
Siti Sunarti ... : ... 104--108
Two Wild Edible
Russula (Agaricales: Russulaceae)
from East Kalimantan
Atik Retnowati... .. . . 109-112
I88N 0215 - 4706
ャッイQ「オョセッ@
Floribunda merupakan organ resmi Pengga1ang
Taksonomi Tumbuhan Indonesia, diterbitkan dua ka1i setahun dan menerbitkan maka1ah da1am bahasa Indonesia dan lnggris mengenai pe1bagai gatra sistematika keanekaragaman flora Ma1esia pada umumnya dan Indonesia pada khususnya yang berasa1 dari hasi1 pene1itian, pengamatan 1apangan, penga1aman pribadi, te1aahan bergagasan, dan tinjauan kritis.
Sidang Penyunting
Ketua Penyunting
Tutie Djarwaningsih (BO)
Penyunting
Tri Mu1yaningsih (UNRAM) Atik Retnowati (BO)
Novita Kartika Indah (UNESA) Titien N. Praptosuwiryo (KRI) Nunik Sri Ariyanti (IPB)
Penyunting Pelaksana
Himmah Rustiami (BO)
Tata Letak
Muhamad Rus1an (BO)
Petunjuk kepada pengarang
Jenis tulisan
Maka1ah 1engkap memuat hasi1 penelitian floristik, revisi, atau monografi unsur-unsur flora Malesia.
Komunikasi pendek mencakup laporan kemajuan kegiatan penelitian, pengembangan dan rekayasa keanekaragaman flora Malesia yang perlu segera diko-munikasikan.
Tulisan lain meliputi obituari tokoh keanekaragaman flora, tinjauan kritis bergagasan, telaahan serta pembahasan persoalan aktual seputar kegiatan penelitian, pengembangan dan rekayasa tetumbuhan Indonesia, serta timbangan buku akan dimuat berdasarkan undangan.
Rujukan pembakuan
Pemakaian Bahasa Indonesia sepenuhnya meng-ikuti Pedoman Umum Ejaan yang Disempurnakan, Pedoman Umum Pembentukan Istilah, Kamus Besar
Bahasa Indonesia, serta kamus-kamus istilah yang
dikeluarkan Pusat Bahasa. Bahasa Inggris yang dipakai adalah the Queen English dengan berpedoman pada The
Oxford Dictionary of the English Language.
Ketentuan-ketentuan yang dimuat dalam Pegangan Gaya
Penulisan, Penyuntingan, dan Penerbitan Karya Ilmiah
Indonesia, serta Scientific Style and Format: CBE
Manuals for Authors, Editors, and Publishers, dan
buku-buku pegangan pembakuan lain akan sangat diperhatikan. Kepatuhan penuh pada International Code of Botanical
Nomenclature bersifat mutlak.
Gaya penulisan
Penulisan naskah yang akan diajukan supaya disesuaikan dengan gaya penulisan yang terdapat dalam nomor terakhir terbitan Floribunda.
Abstrak informatif supaya diberikan dalam bahasa Indonesia dan Inggris yang masing-masing tidak melebihi 200 kata. Sediakan sekitar 7 kata kunci untuk keperluan pengindeksan dan pemindaian.
Bilamana diperlukan ucapan terima kasih dan bentuk persantunan lain dapat dicantumkan sesudah tubuh teks tetapi sebelum daftar pustaka.
Pengacuan pada pustaka hendaklah dilakukan dengan sistem nama-tahun. Daftar pustaka supaya disusun berdasarkan alfabet nama pengarang dengan memakai sistem Harvard.
Gambar dan tabe1 merupakan pendukung teks sehingga perlu disusun secara logis dalam bentuk yang mudah dimengerti. Data supaya disajikan dalam bentuk teks atau tabel atau sebagai gambar, tetapi tidak dalam bentuk ketiganya sekaligus. Siapkan gambar yang lebarnya dua kolom cetak.
Penyumbangan naskah
N askah dikirimkan dalam bentuk ketikan a tau cetakan komputer pada kertas HVS berukuran A4 bersama-sama dengan disket komputer yang diprogram untuk serasi dengan IBM, a tau melalui e-mail.
N askah yang ingin diterbitkan dalam Floribunda akan dipertimbangkan pemuatannya hanya j ika pengirimannya disertai pernyataan tertulis dari 2 ( dua) orang mitra bestari yang dipilih sendiri oleh penulisnya (akan lebih diutamakan bila mitra bestari dipilihkan dari luar lingkungan kerja penulis), yang menyatakan bahwa secara ilmiah keorisinalan dan makna sumbangan naskah tersebut memang layak diterbitkan.
Pengolahan naskah
Sidang penyunting bersama sekelompok mitra bestari akan mengaji ulang kesesuaian isi dan kese1arasan format setiap naskah dengan Floribunda. Perubahan yang di1akukan akan dikomunikasikan kepada penulis da1am bentuk contoh cetak akhir sebe1um diterbitkan.
Cetaklepas
Penulis menerima 5 cetak lepas dari tulisannya secara cuma-cuma.
Kantor penyunting
Sidang Penyunting Floribunda
Herbarium Bogoriense, Cibinong Science Center Jalan Raya Bogor KM 46 Cibinong 16911 Telepon : (021) 8765066-67
Fax : (021) 8765059
[image:2.599.56.289.95.219.2]PROGENY ANALYSIS OF THE T ASIKMALAYAN MANGOSTEENS
(GARCINIA MANGOSTANA) WITH E-RAPD MARKERS
Soaloon Sinaga
Department of Agronomy and Horticulture, Bogor Agricultural University (Permanent address: Kopertis Wilayah III, Jakarta. E-mail: [email protected])
Sobir, Roedhy Poerwanto, Hajrial Aswidinnoor
Department of Agronomy and Horticulture, Bogor Agricultural University
Dedy Duryadi
Department of Biology, Faculty of Mathematics and Natural Sciences, Bogor Agriculture University
Soaloon Sinaga, Sobir, Roedhy Poerwanto, Hajrial Aswidinnoor & Dedy Duryadi. 2007. Analisis Progeni Manggis (Garcinia mangostana) Tasikmalaya dengan Penanda E-RAPD. Floribunda 3(4): 8594. -Apomiksis adalah reproduksi aseksual melalui biji dan merupakan strategi tanaman untuk menghasilkan biji. Pada tanaman apomiktik embrio berkembang secara otonom dan menghasilkan progeni yang identik secara genetik dengan tanaman induk. Tujuan penelitian ini adalah untuk mengungkap keanekaragaman tanaman apomiksis dan untuk mengetahui kejadian apomiksis dalam populasi manggis serta memperoleh gambaran pola-pola pewarisan genetik induk dan keturunannya. Variabilitas genetik dalam populasi adalah sebagai berikut: Salawu (5-14%), Puspahiang (9-25%), Tanjungjaya (10-25%), dan Sukaraja (22.5-29.6%), dan variabilitas di antara populasi 30-47%. Namun, 100% nilai kesamaan genetik diberikan oleh tanaman Salawu8, antara Salawu8 induk dengan Salawu8 progeni-1, dan Puspahiang progeni-2 dan progeni-3. Sementara itu, aksesi lainnya memiliki kemiripan 71.4-98%. E-RAPD berhasil diterapkan pada analisis apomiksis dalam populasi progeni di populasi manggis yang berbeda.
Kata kunci: Apomiksis, manggis, variabilitas genetik, analisis progeni, E-RAPD.
Soaloon Sinaga, Sobir, Roedhy Poerwanto, HajrialAswidinnoor & Dedy Duryadi. 2007. Progeny Analysis of the Tasikmalayan Mangosteens (Garcinia mangostana) with E-RAPD Markers. Floribunda 3(4): 85-94. -Apomixis is an asexual mode of plant reproduction through seeds without fertilitation. A common feature of all apomicts is the autonomous development of embryos and the generation of progenies that are the exact genetic replicas of the mother plant. The aims of apomixis study are to unlock the diversity of the apomictic plants and to know the incidence of the apomixis in the mangos teens and the description of the inheritance genetic patterns of the progenitors to their progeny. The genetic variabilities within the population are Salawu ( 5-14% ), Puspahiang (9-25% ), Tanjungjaya ( 10-25% ), and Sukaraja (22.5-29 .6% ), and among the population 30-4 7% variability. However, 100% of genetic similarity values gave by Salawu8 progenitor with Salawu8 progeny-1, and Puspahiang progeny-2 and progeny-3. Meanwhile, the other accessions have 71.4-98% similirity. E-RAPD were successfully applied to the analysis of apomixis in the different progeny population of mangos teens.
Keywords: Apomixis, mangosteen, genetic variability, progeny analysis, E-RAPD.
Apomixis, asexual reproduction by seeds, is a strategy in plants to produce seeds which is genetically identical with the maternal progeny. By apomixis process, it is possible to select high quality of plants and produce seeds by large scale cloning, genotypic fixation, and to conserve heterosis characters, vigor, and high yields (Koltunow 2008). Apomixis has a potential to revolute agriculture, if the genetic base can be determined well. Up to now, apomixis genetic control is still unclear because of the complexity of Mendelian Genetics, such as epistasis gene interaction, expressed component sporophytically and gametophytically, expression modifiers, polyploidy, aneuploidy, segregation distortion, the presence of
recombination stress etc. which were accumulated during apomixis evolution.
86
modem molecular genetic can be used as one of the ways to identify genes and physiological mechanisms or biochemistry which control certain cell regulation changes which cause the apomixis (Darrigues et al. 2008).
Within the different conditions, apomictic plants of the genus Taraxacum has genetic variation within the levels of ploidy and aneuploidy (Richards 1996). It also occurs in some species of Poaceae
(Acuna et al. 2005). The newest molecular study on the mangosteen, apomixis has also showed the genetic variations (Ramage et al. 2004, Yapwattanaphun et al. 2004, Sinaga et al. 2006, Sobir & Poerwanto 2007, Sari et al. 2008 in press). On the other hand, the genetic variability information between the progenitors and the progeny in the apomictic mangosteens is still unknown.
The information of the genetic variability between the progenitors and the progeny suggests the phenomena of character heritability from the progenitors to the progeny. By this information, we can understand whether segregation occurred in the progeny or not, or whether the genetic patterns of the progenitors is similar to those in the progeny. The failure of the separation of spindels in chromosomes, somatic recombination caused by transposone activities and the presence of mutation was regarded as the cause of genetic variation (Richards 1996). Analysis of apomixis heredity of the progenitors to the progeny can be done by molecular markers. The use of molecular technique in the apomictic genetic study is expected to increase the understanding of the sporophytic and gametophytic apomixis plants.
The aim of this research is to know the genetic variability and genetic pattern consistency of the progenitors and progeny in the mangos teens from four locations in Tasikmalaya using E-RAPD markers. The genetic variability studied will explain whether the variability is caused by the interprogenitors and progeny or accession within location or between locations. The genetic consistency between progenitors and progeny is detected by seeing and comparing the DNA band patterns.
MATERIALS AND METHODS
Samples of mangosteens were collected from four locations in Tasikmalaya Regency. E-RAPD analysis was conducted in the Molecular Laboratory of Life Science Study Center and Plant Biology, The Research Center for Biological Resources and Biotechnology IPB Bogor and the
Floribunda 3( 4?2007
Laboratory of Study Center for Tropical Fruit IPB Bogor. This research was conducted from June 2006 to August 2007. Twelve accessions ofmangosteens including one maternal progenitor with three progenies representing mangosteen populations growing in four districts in Tasikmalaya, namely: Puspahiang, Salawu, Tanjung Jaya, and Sukaraja. Sampling was collected with purposive random sampling method i.e. trunk with ± 100 em diameter and 50 years age, with 10 plants each per location.
E-RAPD technique following William et al. (1990), with some modifications by Tanaka & Taniguchi (2002). Six random primers "Enhanced.,
used were El GACGCCACACT-3'), E2 (5'-GACGCCACACG-3'), E3 (5'-GACGCCACACA -3'), E4 (5'-GACGCCACACC-3'), E1E2 andE1E4 (combination). The DNA band amplified was electrophoreted together with standard DNA 1 KB DNA ladder (promega) on agarose gel 1.2% in buffer solution TBE IX. Electrophoresis was run for 150 minutes on 60 volt at room temperature. The bands amplified were documented with gel and recorded in the computer.
Data Analysis E-RAPD Technique
The bands of E-RAPD were translated as binary data (1 if presence and 0 if absence). These data were used to construct matrix of genetic similarity based on the formula Nei & Li (1979) with UPGMA (Unweighted Pair-Group Method Aritmetic) method by using NTSys (Numerical Taxonomy and Multivariate System) versi 2.02 (Rolf 1998).
The presence of bands was translated as the binary data. Each band represents one character and scored based on the presence and absence of bands. The polymorphic bands are bands which do not belong to the other mangos teen individual on the same size. The binary data resulted were used to arrange genetic similarity matrix based on formula ofNei & Li (1979). Cluster analysis was done based on those genetic similarity followed by production of the dendrogram using UPGMA (Unweighted Pair-Group Method Aritmetic) with the program NTSys (Numerical Taxonomy ang Multivariate System) version 2.02.
RESULT AND DISCUSSION
Result
E-RAPD Data Analysis
primers varies between 1 セ@ 11 bands with average 9 bands DNA per sample. Primers El and E2 had resulted in the least (7 bands), while the most bands (11 bands) were resulted by primers E1E4. The size of bands amplified by primer E-RAPD ranges from 200-1100 pb. All primers result in high polymorphism ( 100% ). The different numbers and size of bands defining levels of genetic variability of mangos teen accession and their close relatives.
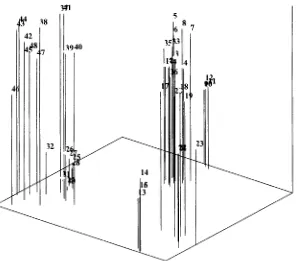
Figure 1 suggest variation patterns of DNA bands between progenitors and progeny namely the loss of progenitor DNA band in certain progenies and additional new DNA bands without loss of progenitor DNA. The range of band size produced by E-RAPD analysis was relatively shorter, less, and more dense band compared with those produced by normal RAPD primers. The number of bands produced by each primer depends on the site distribution which were homologous with the primer sequence in the genome.
Similarity and cluster analyses
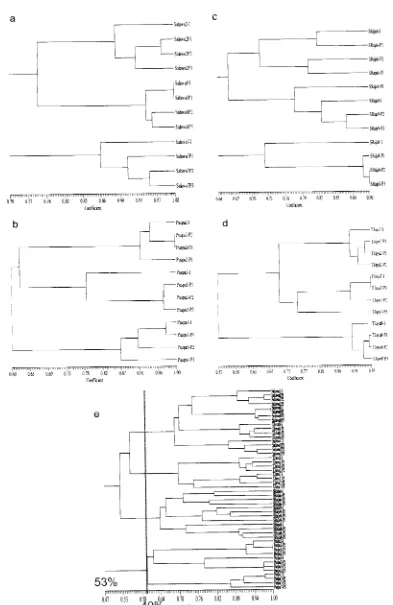
Genetic relationship between Salawu3 progenitor with 3 progenies (P 1, Salawu2-P2, and Salawu2-P3) can be determined from the genetic similarity matrices based on presence and absence of DNA bands using six random primers. The highest genetic similarity score between progeny Salawu2-Pl and Salawu2-P2 is 97.7%, while the lowest one between Salawu2-I and progeny Salawu2-P3 is 86%. Based on cluster analysis (Figure 2) Salawu2 progenitor accession and their three progenies were united on the genetic similarity 89% or 11% diversity between progeny and progenitor accession Salawu2. The cluster between progeny Salawu2 united at the similarity level of7%. Cophenetic correlation score between accession Salawu2 was 0.857 or with the goodness of fit (Table 2). It means that there was compatibility between matrices produced by the dendrogram.
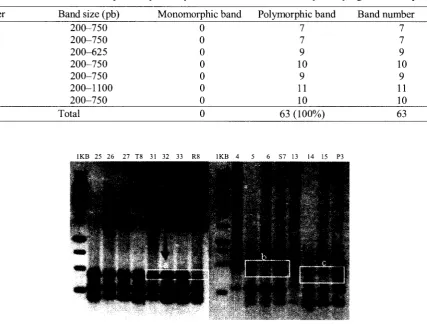
Table 1. The number of bands amplified by seven primers withE-RAPD technique for progenitors and progeny.
Primer Band size (pb) Monomorphic band Polymorphic band Band number
E1 RPPセWUP@ 0 7 7
E2 RPPセWUP@ 0 7 7
E3 RPPセVRU@ 0 9 9
E4 RPPセWUP@ 0 10 10
E1E2 RPPセWUP@ 0 9 9
E1E4 RPPセQQPP@ 0 11 11
E2E4 RPPセWUP@ 0 10 10
Total 0 63 (100%) 63
[image:5.599.68.552.394.511.2] [image:5.599.169.453.529.708.2]IKB 25 26 27 T8 31 32 33 R8 IKB 4 6 S7 13 14 15 P3
88
Floribunda 3( 4) 2007Similarity score between accession Salawu7 On the other hand, the accession Salawu8, progenitor and progeny was 86% or there was the progenitor accession formed cluster with similarity diversity in between progenitor and progeny level1 00% with progeny Salawu8-P 1, while the other accession of 14%. The accession with the highest two progenies united in the level of96% similarity. similarity was Salawu7-P2 with Salawu7-P3 (95%) Generally, accession Salawu8 formed a cluster at or there were diversity between progeny of 5%. the similarity 95% or there were diversity between Clustering patterns shown by accession Salawu2 and accession of 5%. Cophenetic correlation score Salawu7 were the same, where the diversity score between accession Salawu8 was 0.927 or with very between progenitors and progeny was more than suitable goodness of fit. Three Salawu trees diversity score among progeny. Cophenetic (Salawu2, Salawu7, Salawu8) of progenitor and correlation score between accession Salawu7 was progeny formed a cluster at a similarity of 70% or 0.812 or with goodness of fit. there were diversity within Salawu population of
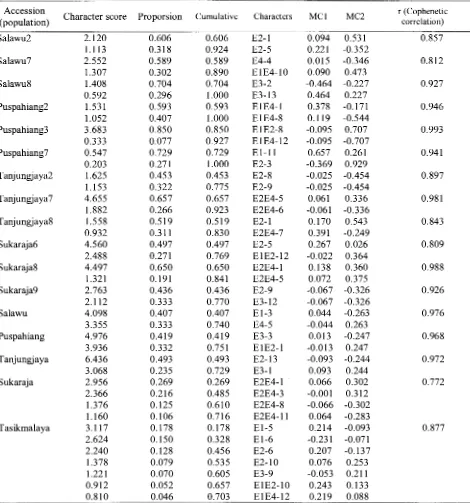
Table 2. Character score and 2 of the first main component score based on E-RAPD markers.
Accession
Character score Proporsion Cumulative Characters MCl MC2 r (Cophenetic
(population) correlation)
Salawu2 2.120 0.606 0.606 E2-1 0.094 0.531 0.857
1.113 0.318 0.924 E2-5 0.221 -0.352
Salawu7 2.552 0.589 0.589 E4-4 0.015 -0.346 0.812
1.307 0.302 0.890 E1E4-10 0.090 0.473
Salawu8 1.408 0.704 0.704 E3-2 -0.464 -0.227 0.927
0.592 0.296 1.000 E3-13 0.464 0.227
Puspahiang2 1.531 0.593 0.593 E1E4-1 0.378 -0.171 0.946 1.052 0.407 1.000 E1E4-8 0.119 -0.544
Puspahiang3 3.683 0.850 0.850 E1E2-8 -0.095 0.707 0.993 0.333 0.077 0.927 E1E4-12 -0.095 -0.707
Puspahiang7 0.547 0.729 0.729 E1-11 0.657 0.261 0.941 0.203 0.271 1.000 E2-3 -0.369 0.929
Tanjungjaya2 1.625 0.453 0.453 E2-8 -0.025 -0.454 0.897 1.153 0.322 0.775 E2-9 -0.025 -0.454
Tanjungjaya7 4.655 0.657 0.657 E2E4-5 0.061 0.336 0.981 1.882 0.266 0.923 E2E4-6 -0.061 -0.336
Tanjungjaya8 1.558 0.519 0.519 E2-1 0.170 0.543 0.843 0.932 0.311 0.830 E2E4-7 0.391 -0.249
Sukaraja6 4.560 0.497 0.497 E2-5 0.267 0.026 0.809
2.488 0.271 0.769 E1E2-12 -0.022 0.364
Sukaraja8 4.497 0.650 0.650 E2E4-1 0.138 0.360 0.988
1.321 0.191 0.841 E2E4-5 0.072 0.375
Sukaraja9 2.763 0.436 0.436 E2-9 -0.067 -0.326 0.926
2.112 0.333 0.770 E3-12 -0.067 -0.326
Salawu 4.098 0.407 0.407 El-3 0.044 -0.263 0.976
3.355 0.333 0.740 E4-5 -0.044 0.263
Puspahiang 4.976 0.419 0.419 E3-3 0.013 -0.247 0.968
3.936 0.332 0.751 E1E2-1 -0.013 0.247
Tanjungjaya 6.436 0.493 0.493 E2-13 -0.093 -0.244 0.972 3.068 0.235 0.729 E3-1 0.093 0.244
Sukaraja 2.956 0.269 0.269 E2E4-1 0.066 0.302 0.772
2.366 0.216 0.485 E2E4-3 -0.001 0.312 1.376 0.125 0.610 E2E4-8 -0.066 -0.302 1.160 0.106 0.716 E2E4-11 0.064 -0.283
Tasikmalaya 3.117 0.178 0.178 E1-5 0.214 -0.093 0.877 2.624 0.150 0.328 E1-6 -0.231 -0.071
[image:6.599.72.542.282.785.2]30%. Cophenetic correlation between Salawu was 0.976 or with suitable goodness of fit.
Accession Puspahiang2 connected at the similarity level of 91% or there were 9% diversity among Puspahiang2. The highest similarity score was presence between Puspa2-P2 and Puspa2-P3 (100%), and the lowest score was in Puspa2-P1 (91% ), while the progenitor was located in between those three progenies with similarity score 93.5%. Cophenetic correlation score between accession Puspahiang2 was 0.946 or with the suitable goodness of fit. Accession Puspahiang3 formed a cluster at similarity score of 78% or 22% diversity between progenitor and progeny. This diversity score was the highest compared to those three accessions of the other Puspahiang. While the diversity score between progeny was 98%. Cophenetic correlation score between accession Puspahiang3 was 0.993 or with very suitable goodness of fit. Accession Puspahiang7 connected at similarity level 86%, with similarity score was shown by Puspahiang7-Progenitor and Puspahiang7-progeny1 of 97.5%. The range of diversity in Puspahiang7 was 2.5-16% diversity. Phenetic correlation score between accession Puspahiang2 was 0.941 or with very suitable goodness of fit. Similarity score of three accession ofPuspahiang population was 60% or with diversity within population ofPuspahiang either in progenitor or progeny 40%. Phenetic correlation score between accession of Puspahiang populations was 0. 968 or with very suitable goodness of fit.
Accession Tanjungjaya2 formed a cluster at similarity score 90%, at this point the progenitor accession was separated from those three progenies.
It means that there were variations between progenitor and progeny of 10%. The highest similarity score was present in Tanjungjaya2-P 1 and Tanjungjaya2-P2 93.8%. Cophenetic correlation score between accession Tanjungjaya2 was 0.897 or with suitable goodness of fit. Accession Tanjungjaya7 formed a cluster at a similarity score of 75%. This score was the point at which Tanjungjaya7-P3 was separated between progenitor and the other progeny. The highest similarity score was given by Tanjungjaya7-I and Tanjungjaya7-Pl 95.2%. Cophenetic correlation score between accession Tanjungjaya2 of 0.981 or with suitable goodness of fit. In Tanjungjaya8, a cluster was formed at a similarity score of 90% which was the similarity score between progenitor and three progenies, or with diversity between progenitor and progenies of 10%. The highest similarity score was given by Tanjungjaya8-Pl and Tanjungjaya8-P2, while
similarity score among progenies was 93.3%, or with diversity within progenies 6.66%. Cophenetic correlation score between accession Tanjungjaya8 was 0.843 or with suitable goodness of fit. Three accessions ofTanjungjaya population formed a cluster at a similarity level of 53% or with diversity within populations of 47%. Cophenetic correlation score between accession of Tanjungjaya population was 0.972 or with highly goodness of fit.
Accession Sukaraja6 formed a cluster at similarity level of71.4% or with diversity 29.6% within accession Sukaraja6. The highest similarity score was present at Sukaraja6-I and Sukaraja6-P1, while Sukaraja6-P2 and Sukaraja6-P3 had similarity score 80%. Cophenetic correlation score among accession Sukaraja6-P3 was 0.809 or with suitable goodness of fit. Accession Sukaraja8 formed a cluster at similarity score 73% which was the point of separation between progenitor and three progenies.
It means that there were diversity among progenies and progenitor of27%. The highest similarity score was given by Sukaraja8-P2 and Sukaraja8-P3 90.4%, while the similarity score between Sukaraja8-p 1 and the other Sukaraja8-progenies was 90.1 %.
Cophenetic correlation score between accession Sukaraja8 ofO. 928 or with highly goodness of fit. Accession Sukaraja9 formed a cluster at similarity level of 77.5% or with diversity between accession 22.5% with the highest similarity score was given by Sukaraja9-P2 and Sukaraja9-P3 86.6%, while the progenitor accession was located in between three progenies with similarity score of 82.9%. Cophenetic correlation score among the accession of Sukaraja9 was 0.926 or with very suitable goodness of fit. Three accessions ofSukaraja formed a cluster at a similarity level 64% or with diversity within Sukaraja population of 36%. Cophenetic correlation score among the accession ofSukaraja was 0. 772 or with less suitable goodness of fit.
90
a
セMMMMMs。ッキオャMQ@
SaDwu2Pl
L---SaowulPJ
r l
sanv.u8.[L - - - -1 Sao11u8PI
I ,_-Saowu8P2
L_Salmu8?3
j l l l l i l i i l [ l i l l 1 j i l l l l l l l j i l I ilj i i l l j l i l l i l j II I '!Ill l l l l l j i i , i i Ill 0.10 073 0.76 0.80 0.83 0.86 0.90 0.93 097 1011
b
CoeffiCient
r - - - -Puspa2-l
LMMMMMMMMMMpオウーセMQ@
Puspa3-P2 L__Puspal-PJ
[ i l l IIIII' II II[ l i l t [II II 1[1 I II j i l l II i j i i i i ij i l l I I ' I II j 0.60 0.65 0.69 073 0.78 082 0.81 0.91 0.96 1.00
CoetTICl'!nt
e
0.47 0.53 0.70 0.76
CoeffKiellt c
Floribunda 3( 4) 2007
.---SRajl6-1
セセ@ MMMMMMMウr。セオMイQ@
セsr。セYMQ@
セsr。セYMpR@
sr。セセpャ@
. - - - S R a j a S - 1 SRaja8-P1 SRap8-P2 lsRap8-PJ
[II II[ 1 1[1 j i l l [ ii'[ II i j jj, II[ II I
OM 067 O.iO 0.73 0.76 079 082 085 0.88 0.90
d
Coeffri::nt
セ[[Z@
T1aya2-P3TJa)'a:-P2
l
1
-c:::
Tlaya7-P3I rlThy.S-P1
Li
LTJayaU: Lnaya8-P3m1 m•m• ュQセセ@ m•m1 セ@ mo1m, ュセャ@ ュュュQュュイイョイイーュゥゥセG@ m1m• セセQ@ m•m• 1m-1
053 058 0.63 067 072 0.77 081 086 091 095 CoeffJClent
[image:8.599.112.505.97.702.2]0.82 0.88 0.94
Figure 2. Dendrogram analysis of progenitor and progeny ofTasikmalayan mangosteens with E-RAPD markers.
population was 40% (Figure 2e ), where all of the other accessions of each population gathered in a cluster of population and separated from the other populations. However, there was an accessiOn,
was originated from Salawu, so that the similarity score was closer in Salawu than the original population. The populations with the closest genetic relationship were Salawu and Tanjungjaya with similarity genetic score of 55.5%, while Sukaraja population was located between Salawu and Tanjungjaya population with similarity score of 53%. Cophenetic correlation among 48 Tasikmalayan accessions was 0.877 or with suitable goodness of fit.
Discussion
The majority of the primers employed in mapping of component 1 vs 2 was primer E2 with 11 bands, followed by E2E4 (8 bands), E3 (6 bands), ElE4 (5 bands), ElE2 (4 bands) and E4 2 (bands) (Table 2). The extraction of eigenvalue 70% or more which play a role in accession mapping in the main component of each accession only given by 2 characters, except Sukaraja population ( 4 characters) and Tasikmalaya 48 accession (7 characters) (Table 2).
w
it38 42
8 3940
7
4
14
6
3
Based on E-RAPD markers, analysis of the main component has mapped all progenies clustered together with their progenitor, and the mangosteen accession had also clustered based on the area of origin except Tanjungjaya8 accession which belonged to Salawu8.
Apomixis Analysis of Mangosteens
Based on criteria that progeny of the obligate apomixis plants have identical genetic patterns which identical with the progenitors, therefore a model can be made to determine whether the mangosteens apomictic or not. If one of the loci of E-RAPD of the progenitor and progeny have different allele, it will not be apomictic. Ifboth progenitor and progeny are the same the apomictic character cannot be defined. The apomictic character of mangosteens cannot be defined because the similarity of genetic patterns of progenitor and progeny which may be caused by self fertilization or that the mangosteen is truly apomictic plant.
5
t
8 7Sセ@
63\1
3 48
lb
1
[image:9.599.170.467.413.674.2]92
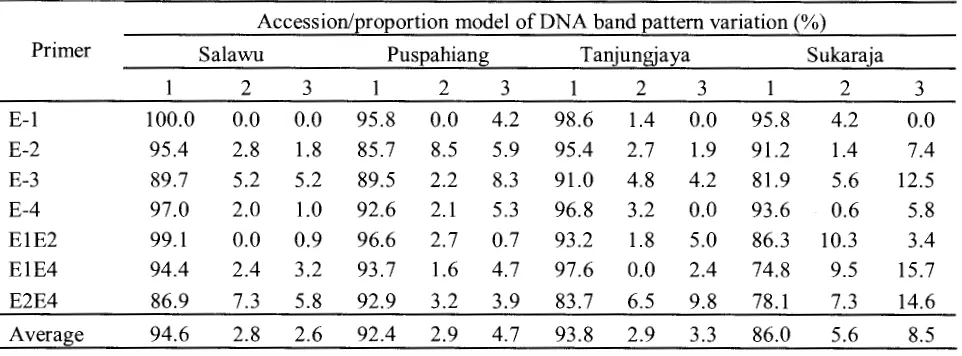
Floribunda 3( 4) 2007Table 3. A Model of the DNA band pattern variation among 12 progenitor trees with 3 progenies and.-their proportion with E-RAPD markers.
Accession/proportion model of DNA band pattern variation(%)
Primer Sa1awu Puspahiang Tanjungjaya Sukaraja
2 3 1 2 3 1 2 3 2 3
E-1 100.0 0.0 0.0 95.8 0.0 4.2 98.6 1.4 0.0 95.8 4.2 0.0 E-2 95.4 2.8 1.8 85.7 8.5 5.9 95.4 2.7 1.9 91.2 1.4 7.4 E-3 89.7 5.2 5.2 89.5 2.2 8.3 91.0 4.8 4.2 81.9 5.6 12.5 E-4 97.0 2.0 1.0 92.6 2.1 5.3 96.8 3.2 0.0 93.6 0.6 5.8 E1E2 99.1 0.0 0.9 96.6 2.7 0.7 93.2 1.8 5.0 86.3 10.3 3.4 E1E4 94.4 2.4 3.2 93.7 1.6 4.7 97.6 0.0 2.4 74.8 9.5 15.7 E2E4 86.9 7.3 5.8 92.9 3.2 3.9 83.7 6.5 9.8 78.1 7.3 14.6
Average 94.6 2.8 2.6 92.4 2.9 4.7 93.8 2.9 3.3 86.0 5.6 8.5
Note: 1 =equals progenitors, 2 =additional new bands, 3 =lost bands
There were three patterns of band variation in the progeny analysis ofTasikmalayan mangosteens based on E-RAPD markers: (1). Bands of progeny equals progenitors; (2). New band emergence; and (3). Loss of bands in progeny. The genetic consistency resulted in the progeny analysis was relatively high with average of 91.69% (Table 3), shown by the presence of similar bands between progenitor and progeny. The occurrence of band deletion had given the highest proportion on the genetic variability between progenitor and progeny of Tasikmalayan mangosteens with average of 4. 77%. While the addition of new bands with the average of 3.54%. Genetic variability proportion showed by band differences raising on each population 5.36-14.05%. The Sukaraja population showed the highest variability ( 14.05% ), followed by Puspahiang (7 .6% ), Tanjungjaya ( 6.25%) and Salawu (5.36%). Genetic variability proportion found in this research was lower than those of the mangosteen progeny analysis in West Sumatera (41.3%) (Mansyah et al. 2004). This might be caused by the use ofE-RAPD primers with relatively longer bases, so the result suggest more specific than the common RAPD primers.
Based on patterns variation, the band patterns of progeny was not identical as those in progenitor, which should occur in the obligate apomictic plants. Based on the model above, the analyzed mangosteens were not the obligate apomictic plants. It was assumed that DNA band pattern variation occurred due to the process of fertilization in flowers, although more evidence still needed. Persson-Hovmalm et al. (2004) reported that Aronia tetraploid population (as apomictic plants)
with the use ofRAPD markers, the profile between female progenitor and their descendants were identical. On the other hand, Ford & Richards (1995), reported that there were genetic variability between progenitor and progeny in three obligate apomictic plants Taraxacum. King & Schaal ( 1990) reported that in Taraxacum officinale there were genotypic variations among progeny. The rate of new genotype emergence in T. officinale was higher than the expected random mutation. Richards (1997) stated that the obligate agamosperma may result in genetic variability by somatic recombination or by autosegregation. The genetic variability was needed by apomictic plants as the basis for adaptation and evolution process (King & Schaal 1990).
Variability of obligate apomictic according to Richards ( 1996 and 1997), Sobir & Poerwanto (2007) could be caused by: 1) accumulation ofDNA mutation change; 2) disjunction failure due to polyploidy, haploidy, oligosomy, and polisomy among the descendants; 3) chromosome translocation causing somatic recombination due to activity of transposon, and 4) chromosome mutation in the maternal genome which control apomixis. In mangosteens, genetic variation could be caused by some phenomena such as natural mutation due to domestication since thousands years ago (Ramage et al. 2004 ), the ploidy failure or progenitor crossing many times (Sobir & Poerwanto 2007).
embryo somatic cells (nuselus or integument) (Spillane et al. 2001). Those mechanism may have caused genetic variation between progenitor and progeny on mangosteens. According to Koltunow et al. ( 1995) and (Darrigues et al. 2008), generally, the apomictic plants were controlled by one dominant gene locus playing a role in explaining apomictic paths. Genetic diversity in Salawu population (5-14%), Puspahiang (9-25%), Tanjungjaya (10-25%), and the highest was Sukaraja (22.5-29.6%), while among population ranged from 31.2--47%. The progeny was not identically similar to the progenitor. The average genetic consistency in four locations of mangosteen was 91.69%, consistency score 100% reached in Salawu8 progeny-1, and Puspahiang progeny-2 and progeny-3. while the other accession had similarity from 71.4-98%. The mangosteen regarded as plants descended from the diplospory gametophytic apomictic pathway. The best primer playing roles in clustering were E2 with 11 bands, followed by E2E4 (8 bands), E3 (6 bands), E1E4 (5 bands), E1E2 (4 bands) and E4 2 (bands). E-RAPD can be used for apomictic analysis between progenitor and progeny of different mangosteens.
ACKNOWLEDGEMENT
This study was funded by special grant from Indonesian Ministry of Science and Technology through National Strategic Research Initiative (RUSNAS) for tropical fruit development to Centre for Tropical Fruit Studies of Bogor Agricultural University. We would like to thank to Dr. Fitmawati, Drs. Pudji Widodo, M.Sc., Sulassih, Hery Jumhair, and Pras Setyo for their kindly help.
REFERENCES
Acufia CA, Martinez EJ & Quarin CL. 2005. Sexual diploid and apomictic tetraploid races in Thrasya petrosa ( Gramineae ). Australian Journal of Botany 53: 479--484.
Darrigues A, Daub J, McCord K, Rasmussen C & Rouse J. 2008. Genetic Analysis of Apomixis. Apomixis-Genetic Analysis. [ terhubung berkala]. http://www. public.iastate.edu/
セュ「ィ。エエ。」O「ィ。エエ。」ィ。イケケ。O@ genetics. pdf. [
9-2-2008 ].
Ford H & Richard AJ. 1995. Isoenzyme variation within and between Taraxacum agamospecies in a single locality. Heredity 55:289-291.
King LM & Schaal BA. 1990. Evolution Genotypic variation within asexual lineages of
Taraxacum officina/e. Proc. Nat!. Acad. Sci. 87: 998-1002.
Koltunow AM, Bicknell RA & Chaudhury AM. 1995. Apomixis: Molecular Strategies for the Generation of Genetically Identical Seeds without Fertilization. Plant Physio/.108:
1345-1352.
Koltunow AM. 2008 Apomixis: state of the art and potential applications.[terhubung berkala]. http:/ I /www.CSIRO.au. [7-2-2008].
Mansyah E, Syah MJA, Usman F & Purnama T. 2004. Genetics variability between parental tree (Garcinia mangostana L.) and their progenies. Jurnal Hortikultura 14: 229-23 7 (in Indonesian, with English abstract). Naumova TN. 1993. Apomixis in Angiosperms:
Nucellar and Integumentary Embryony. CRC Press, Boca Raton, FL.
Nei M & Li WH. 1979. Mathematical model for studying genetic variation in terms of restriction endonucleases. Proc. Nat/. Acad. Sci. USA 76 (10): 5269-5273.
Persson-Hovmalm HA, Jeppsson N & Bartish IV. 2004. RAPD analysis of diploid and tetraploid populations of Aronia points to different reproductive strategies within the genus. Hereditas 141: 301-312.
Ramage CM, Sando L, Peace CP, Carroll BJ & Dew RA. 2004. Genetic diversity revealed in the apomictic fruit species Garcinia mangostana L. (mangosteen). Euphytica 136 (1): 1-10.
Richards AJ. 1996. Genetic variability in obligate apomicts of the genus Taraxacum. Folia Geobotanica. In: AJ Richards, J Kirschner, J Stepanek & K Marhold (Eds. ).Proceedings Apomixis and Taxonomy of the Symposium held in Pruhonice, Czech Republic 1995. Volume 31, Number 3/December, 1996 p 405--414.
_ _ _ _ . 1997. Plant Breeding Systems. 2"d Ed. Department of Agricultural and Environmental Science University of Newcastle Upon Tyne. Chapman and Hill. London. 529 p.
RolfFJ. 1998. NTSys-pc. Numerical Taxonomy and Multivariate Analysis Syatem. Version 2.02. Exerter Software. New York.
Sari R, Lukman R, Sinaga S & Amelia R. 2008. Evaluating genetic relationships in Indonesian Mangosteen (Garcinia mangostana) using AFLP profiling. Biotropia in press.
94
tanaman Manggis (Garcinia mangostana)
dan kerabat dekatnya dengan penanda isoenzim dan RAPD. Floribunda 3(1): 1-9. Sobir & Poerwanto R. 2007. Mangos teen Genetics and Improvement. International Journal of Plant Breeding. International Journal of Plant Breeding 1 (2): 105-111.
Spillane C, Steimer A & Grossniklaus U. 2001. Apomixis in agriculture: the quest for clonal seeds. Sex Plant Reprod. 14: 179-187. Tanaka J & Taniguchi F. 2002. Emphasized-RAPD
( e-RAPD): a Simple and Eftlcient Technique to make RAPD Band Clearer. Breeding Science 52: 22-229.
Floribunda 3( 4) 2007
Yapwattanaphun C, Subhadrapitahu S, Honsho C &
Yonemori K. 2004. Phylogenetic relationship of mangos teen ( Garcinia mangostana) and several wild relative. Journal of the American Society for Horticultural Science 129(3): 368-373.
William JGK, KubelikAR, Livak KJ, Ravalski JA, & Tingey SV. 1990. DNA polimorphisms amplified by arbitrary primer are useful as genetic markers. Nucleic Acid Research
Prof. Dr.
||セィュ」イゥ@\bnctlu (
IPB
BugJ)r)
Prof'. Dr. Sudarsono
1IPB Bugnl')
Dr. Rugay;d1
(
LI PI
B()gnr!Dr. Pudj
i
\\'idodo
ili\:SOLD Purv.,
uk(T1u)Dr.
fゥエュセュ。エゥ@(Uni\. Riau
p」ォセュィ。イオI@atas kcsuc.ilannya h:rtimbk scl<d .... u
ュゥエイセャ@bcstari
untuk
tcrbitan
Florihu nda
セ@(
-.1 )Tcrhit: ( )ktdhcr
:21)07
·r··lt'oo··,] tcTl·ll..:.->·ttJ··· セ@l
,r)c-,cm
1·wr.2009
(. I セエMu@ d . . (. . U . セ@ l
_.-Pcm.:l!alanu ·Ld..:.sonomi
.._ .__ ..__ tオュ「オャャセュャョ、ッョ」ウゥ。@inl!in
' - -lnl'l\.'kamk<m rasa
tcrima
kasilmva
<-'pad a
Progr:tm
Hihah S1mposium
セ。ウゥッョ。ャ@Or!:!anisasi Profc:-..i
l)irckturat
p」ョ」ャゥエゥセオャ@dan
p」ョァ。「、ゥセュ@Kcpada
ゥ|「ウケ。イセ、NNZN。エ@D!K
ri
untuk ikut
ュ」ョセNャ\Aョ。ゥ@pcncrhitan