THE ANALYSIS OF THE EFFECT ON PHYSICAL ENVIRONMENT FACTOR
FOR NOISE AND LUMINOUS TO ACCURACY SCORE
ON READING AND COLORS MATCHING
Wahyukaton
Industrial Engineering Department, Pasundan University, Bandung, Indonesia E-mail : [email protected]
ABSTRACT
Experiment design is long process consists of complex process step and correlated so that it has to be done with critical and systematic process. Analysis technique used in this paper is analysis of variance, is the way to test variance from population.
The main variables in this paper are noise intensity and luminous intensity, while other variables such as temperature, humidity, and times are assumed constant. The respondents are 15, taken from students which are in good health and no color blind and was done in the climate chamber in the laboratory, to read some readings and to match different 20 colors, and all has been scored.
The results are, there is a significance different that luminous intensity affected the reading score and color matching, there is no significant different that noise intensity affected the reading score and color matching, and there is no interaction between luminous intensity and noise intensity for the reading score and color matching.
Key words: noise intensity, luminous intensity, analysis of variance.
1. INTRODUCTION
1.1. Research Background
The most aspect in productivity decreasing is a human resource. Human as a controller and decision maker will feel fatigue while doing their jobs, especially when human has to face machines or tools which could not give comfort ability, physically or mentally, to human being.
The bad work environment will demand more effort and time, such as wrong installation of electronic components that affected by Luminous resolution and noise intensity
1.2 Research Identification
1. Is there any affection caused by reading accuracy and color matching for different luminous intensity
2. Is there any affection caused by reading accuracy and color matching for different noise intensity?
3. Is there any interaction between Luminous intensity and noise intensity on reading accuracy and colors matching?
1.3 Research Objectives
1. To determine the effect of luminous intensity for reading accuracy and color matching
2. To determine the effect of noise intensity for reading accuracy and color matching
3. To determine the interaction between luminous intensity and noise intensity for reading accuracy and colors matching.
2. THEORETICAL BACKGROUND
2.1 Cognitive Ergonomics
performance. It is a subset of the larger field of human factors and ergonomics.
Successful, ergonomic intervention in the area of cognitive tasks requires a thorough understanding not only of the demands of the work situation, but also of user strategies in performing cognitive tasks and of limitations in human cognition. Tools tools; the latter is very important as modern artifacts (e.g., control panels, software, expert systems, experiment design) become increasingly sophisticated. Emphasis lies on how to design human-machine interfaces and cognitive artifacts so that human performance is sustained in work environments where information may be unreliable, events may be difficult to predict, multiple simultaneous goals may be in conflict, and performance may be time constrained
2.2 Luminous Intensity
In photometry, luminous intensity is a measure of the wavelength-weighted power emitted by a light source in a particular direction per unit solid angle, based on the luminosity function, a standardized model of the sensitivity of the human eye. The SI unit of luminous intensity is the candela (cd), an SI base unit.
Photometry deals with the measurement of visible light as perceived by human eyes. The human eye can only see light in the visible spectrum and has different sensitivities to light of different wavelengths within the spectrum. When adapted for bright conditions (photopic vision), the eye is most sensitive to greenish-yellow light at 555 nm. Light with the same radiant intensity at other wavelengths has a lower luminous intensity. The curve which measures the response of the human eye to light is a defined standard, known as the luminosity function. This curve, denoted V(λ) , is based on an average of widely differing experimental data from scientists using different measurement techniques.
For instance, the measured responses of the eye to violet light varied by a factor of ten.
Luminous intensity should not be confused with another photometric unit, luminous flux, which is the total perceived power emitted in all directions. Luminous intensity is the perceived power per unit solid angle. Luminous intensity is also not the same as the radiant intensity, the corresponding objective physical quantity used in the measurement science of radiometry.
2.3 Noise Intensity
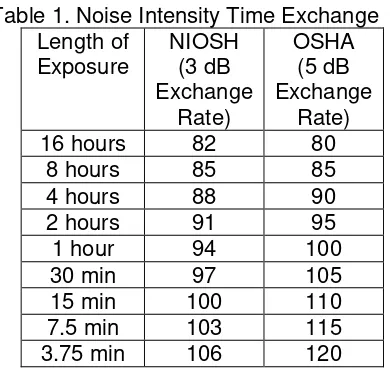
The risk of noise to hearing is based upon two factors: noise intensity level (loudness) and the duration of exposure. Noise induced hearing loss has been found to occur with repeated 8 hour exposures of 85 dBA, but shorter exposures to greater levels can be equally as dangerous.
The chart below identifies equivalent noise exposures. Based upon the equal energy law, a doubling of sound energy will result in a 3 dB increase in measured sound level. This 3 dB exchange rate is the recommended method for evaluating the risk of noise exposure. OSHA action levels (which trigger required inclusion in a hearing conservation program) are based upon a 5 dB exchange rate.
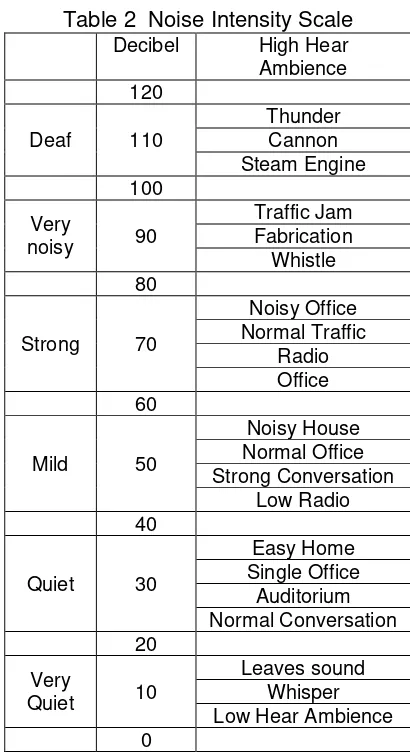
Table 2 Noise Intensity Scale
2.4 Analysis of Variance
In statistics, analysis of variance (ANOVA) is a collection of statistical models, and their associated procedures, in which the observed variance in a particular variable is partitioned into components attributable to different sources of variation.
In its simplest form, ANOVA provides a statistical test of whether or not the means of several groups are all equal, and two, three, or more means.
ANOVA is used in the analysis of comparative experiments, those in which only the difference in outcomes is of interest. The statistical significance of the experiment is determined by a ratio of two variances. This ratio is independent of
several possible alterations to the experimental observations: Adding a constant to all observations does not alter significance. Multiplying all observations by a constant does not alter significance. So ANOVA statistical significance results are independent of constant bias and scaling errors as well as the units used in expressing observations. In the era of mechanical calculation it was common to subtract a constant from all observations (when equivalent to dropping leading digits) to simplify data entry. This is an example of data coding.
3. RESEARCH METHODS
3.1 Research Variables
Variables used in this paper are:
1. Noise
This noise is unwanted sound and can effect health, conformity, and deafable. There are 3 intensity scale:
a. Quiet, intensity scale is average at 60-75 dB like can be found in normal conversation or single office.
b. Mid, intensity scale is average at 90-105 dB like can be found in noisy house, strong conversation, and normal office.
c. Noisy, intensity scale is average at 115-130 dB like can be found in traffic jam, factory, and whistle blows.
2. Luminous
a. Dim, object is unclearly be seen with luminous intensity was 10 lux.
b. Bright, object is clearly be seen with luminous intensity was 42 lux.
c. Very Bright, object is unclearly be seen due to light bursting with luminous intensity was 110 lux.
3.2 Temperature, Humidity, Time
3.3 Respondents and Tools
There were 15 respondents in good health and no blind color between age of 20-25 years. Tools were used :
a. Readings and Questionnaire, were design to a reading on work environment, which was to be scored by the questionnaire.
b. Pictures of Colors and Matching Colors, to measure the effect that may cause by luminous intensity and noise intensity
c. Sound level d. Light meter e. Stop watch
3.4 Treatments
Treatments for respondents are following the table.
Table 3. Tabel of Treatments
3.5 Experiments
There are 2 experiments to be done by respondents for 10 minutes for every experiment, which are,
1. First Experiment, the respondents were given readings and then fill up the questionnaires. Every treatments have different readings and questionnaires. 2. Second Experiment, the respondents
were given a set of colorful picture and then they have to matching the colors into the given table of colors.
Those experiments result then will be scored in a particular table.
4. RESULT AND DISCUSSION
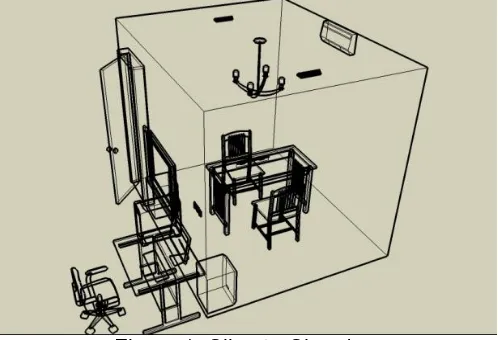
4.1 Climate Chamber
Figure 1. Climate Chamber 4.2 Experiments Result
Table 4. Respondents Score
Note:
1. Very Uncomfortable : 0 – 15 2. Uncomfortable : 16 – 30
3. Fair : 31 – 45
4. Comfortable : 46 – 60 5. Very Comfortable : 61 – 75
Luminous Intensity Dim Bright Very Bright
Noise Intensity
Quiet T1 T2 T3
Mid T4 T5 T6
Noisy T7 T8 T9
1 2 3 4 5 6 7 8 9 10 11 12 13 14 15
1 3 2 4 3 5 2 3 3 4 3 4 3 3 4 3 49
2 2 2 3 2 5 3 2 4 3 2 4 2 2 3 1 40
3 2 1 1 1 3 1 2 2 2 1 3 1 1 1 1 23
4 4 4 5 3 5 4 4 4 4 3 5 4 3 5 4 61
5 4 3 3 3 3 3 3 4 3 3 4 2 3 4 3 48
6 4 3 2 3 1 1 2 1 2 3 4 1 3 2 2 34
7 5 4 4 4 5 5 3 3 5 5 5 4 4 5 3 64
8 5 4 3 2 4 3 2 3 3 4 4 2 3 3 2 47
9 4 3 2 1 3 1 1 1 2 4 4 2 2 1 1 32
4.3 ANOVA
Total score from 9 treatments then put into table and make the ANOVA.
Table 5. Treatment’s Score
Hypothesis:
1. H0 : 1 = 2 = 3 = … =
i =0No significant difference to luminous intensity on reading and matching colors
2. H0 : 1 = 2 = 3 = … j = 0
No significant difference to noise intensity on reading and matching colors
3. H0 : ()11 = ()12 = …= ()ij = 0 No interaction to luminous intensity and noise intensity on reading and matching colors
Significant level is .05 for all tests, f.05(2,126)
= 3.07 and
f.05(4,126) = 2.44Table 6. ANOVA
From ANOVA table, the result is,
1. Reject H0, there is a significant difference to luminous intensity on reading and matching colors
2. Accept H0, No significant difference to noise intensity on reading and matching colors
3. Accept H0, No interaction to luminous intensity and noise intensity on reading and matching colors
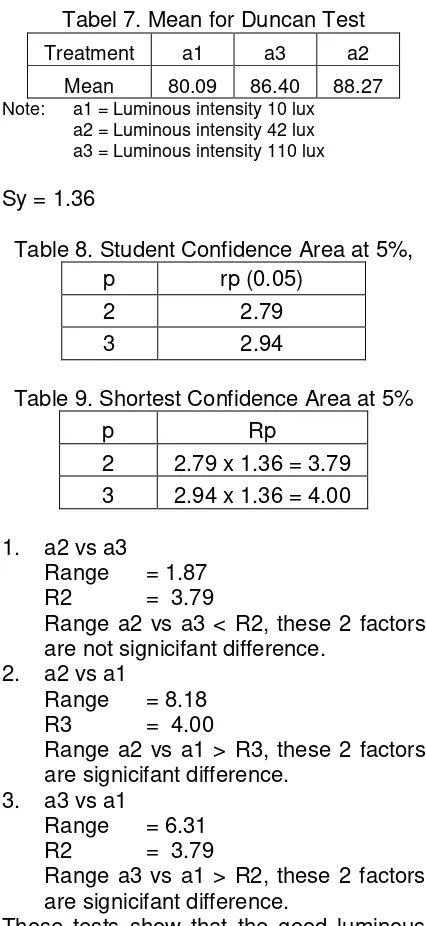
Further test was applied to the result of no 1 with Duncan test to show the difference in luminous intensity, as follows :
Ho : 1 = 2 = 3= … = i =0, No significant difference within Significant level is .05 for all tests
Tabel 7. Mean for Duncan Test
Treatment a1 a3 a2
Mean 80.09 86.40 88.27
Note: a1 = Luminous intensity 10 lux
a2 = Luminous intensity 42 lux a3 = Luminous intensity 110 lux
Sy = 1.36
Table 8. Student Confidence Area at 5%,
p rp (0.05)
2 2.79
3 2.94
Table 9. Shortest Confidence Area at 5%
p Rp are not signicifant difference.
2. a2 vs a1 are condition two and three.
5. CONCLUSION
1. There is a significance difference to luminous intensity on reading and matching colors,
2. There is no significant difference to noise intensity on reading and matching colors
3. There is no interaction to luminous intensity and noise intensity on reading and matching colors
Intensity 1652.86 2 826.43 9.998 Noise
Intensity 203.61 2 101.81 1.232 Interaction 462.70 4 115.67 1.399 Error 10414.93 126 82.66
6. REFERENCES
1. Furqon. (2008). Statistika Terapan untuk Penelitian. Cetakan keenam. Alfabeta. Bandung.
2. Pulat, B Mustafa. (1992). Fundamentals Of Industrial Ergonomics. Prentice Hall Inc. New Jersey.
3. Riduwan dan Akdon. (2007). Rumus dan Data dalam Aplikasi Statistika. Alfabeta. Bandung.
4. Santoso, Gempur. (2004). Ergonomi Manusia, Peralatan dan Lingkungan. Cetakan Pertama. Prestasi Pustaka Publisher. Jakarta.
5. Sidney Siegel. (1994). Statistik Non Parametrik untuk Ilmu-ilmu Sosial. PT. Gramedia Pustaka Utama. Jakarta. 6. Sudjana. (1996). Metoda Statistika.
Edisi Keenam. Tarsito. Bandung. 7. Sugiyono. (2003). Statistika Untuk
Penelitian. Cetakan Kelima. Alfabeta. Bandung.
8. Sugiyono. (2007). Statistika Untuk Penelitian, Cetakan Kesepuluh, Alfabeta, Bandung.
9. Sutalaksana, Iftikar Z., Anggawisastra, Ruhana & Tjakraatmadja, John H. (1979). Teknik Tata Cara Kerja. Jurusan Teknik Industri. Institut Teknologi Bandung, Bandung.
10. Walpole, Ronald E. & Meyers, Raymond H. (1995). Ilmu Peluang dan Statistika Untuk Insinyur dan Ilmuwan. ITB. Bandung
11. Wignjosoebroto Sritomo, (2003), Ergonomi Studi Gerak dan Waktu, Edisi Pertama, Guna Widya, Surabaya.
12. http://www.geocities.com/klinikikm/kes ehatan-kerja/faktor-fisik.htm
13. www.library.usu.ac.id
AUTHOR BIOGRAPHIES
Wahyukaton, is a lecturer at Industrial Engineering Department, Pasundan University. He reached his bachelor degree on Industrial Engineering at Pasundan University in 1995, and Master Degree on Industrial Engineering at Bandung Institute of Technology in 2001. His research area is related to Statistics, Quality Control, and Ergonomic. His email address is


