Exploiting Features from Triangle Geometry for Digit
Recognition
Mohd Sanusi Azmi
Faculty of Information Communication and Technology Universiti Teknikal Malaysia Melaka
Melaka, Malaysia [email protected]
Mohammad Faidzul Nasrudin
Faculty of Information Science and TechnologyUniversiti Kebangsaan Malaysia Bangi, Malaysia [email protected]
Khairuddin Omar
Faculty of Information Science and Technology Universiti Kebangsaan Malaysia
Bangi, Malaysia [email protected]
Che Wan Shamsul Bahri Che Wan Ahmad
Faculty of Information Science and TechnologyKolej Universiti Islam Antarabangsa Selangor Selangor, Malaysia
Khadijah Wan Mohd Ghazali
Faculty of Information Communication and Technology Universiti Teknikal Malaysia Melaka
Melaka, Malaysia [email protected]
Abstract—Triangle is a basic geometry. There are six types of
triangle, but scalene triangle was chosen to be used in this research which is based on coordinates of corners generated by our proposed algorithm. In this paper, nine features are proposed. Six of the features were derived from coordinates and sides of triangle whereas three others are angle of corners. After features are identified, the image is zoned into 25 zones. The zoning processes are based on Cartesian plan, Vertical and Horizontal zones. From the zoning process, nine features are expanded to become 225 features. The features proposed are used on HODA, MNIST, IFHCDB and BANGLA datasets. Experiments are conducted using supervised learning which are Support Vector Machine (SVM) and Multi-layer Perceptron (MLP). Results from the experiments are evaluated with different Cost (c) for the SVM and Learning Rate (LR) for the MLP. Then, the result is compared to the state of the art researches in this area.
Index Terms—Triangle features, feature extraction, zoning,
dataset.
I.INTRODUCTION
In pattern recognition, the most popular dataset is MNIST. This dataset is publicly available in
http://yann.lecun.com/exdb/mnist/index.html. MNIST has 60,000 training images and 10,000 testing images in 10 classes. In 2007, a Farsi/Arab dataset named HODA with 60,000:20,000 images for training and testing were introduced in [1]. Besides HODA, other Farsi/Arabic dataset that contains digit named Isolated Farsi/Arabic Handwritten Character Database (IFHCDB) was created at the Electrical Engineering Department of Amirkabir University Of Technology in 2006 [2]. It contains 300 dpi grey scale images of characters and numbers. The number of samples in each class of this database is non-uniform corresponding to their real life distributions [3]. Besides the Roman and Arab based dataset, the Bangla dataset are also used in this research. The Bangla dataset named ISI Handwritten Character Database (Bangla) was introduced in [4] with 19,392:4,000 images for training and testing.
the unsupervised machine learning, we use Euclidean Distance Method with rank measure. The rank measure used is Mean Average Precision (MAP). This unsupervised machine learning used was chosen based on the research in Jawi alphabets done in [7].
II.PRE-PROCESSING
In this stage, images from datasets are prepared for processing with our proposed feature extraction method. The images in the chosen datasets were in two different formats, binary and gray scale. Hence, pre-processing is done so that all images are in uniform format. The attributes of images in datasets are shown in TABLE I below.
TABLEI. DATASETS DESCRIPTION
HODA IFHCDB MNIST Bangla
Uniform X √ (8.47Kb) √ (2.38Kb) X
Scale Binary Gray Scale Binary Gray Scale
Format BMP BMP BMP BMP
Dimension vary 77x95 28x28 vary
Resolution 200 300 200 300dpi
Ratio Train: Test
60000 : 20000
12292 : 5268
60000 : 10000
19392 : 4000
After pre-processing, all images in the datasets are in binary form, labeled with 0 and 1. The binary process is made by using Otsu’s method based on research by L Schomacer et. al [8]. Using the method, threshold value is derived by differentiating the value between foreground and background of the image. Applying the threshold value on the image results in either black or white pixel. The black pixels then are labeled as “0” and white pixels as “1”. The process of binarization of images in the dataset and labeling of pixels is shown in Fig. 1.
Fig. 1. Preprocessing process of datasets
III.PROPOSED METHOD
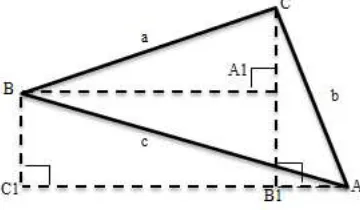
After the labeling processes is done, the next step is to introduce the proposed features. Error! Reference source not found. below shows an example of a triangle. The sides are represented as “a”, “b” and “c”. The corners of triangle are represented as “A”, “B” and “C”.
Fig. 2. Example of a triangle
Fig. 2 can be described as a scalene triangle. There are 16 features contributed by this type of triangle [9]. However, features that will be used in this research are inherited from the basic triangle, as described in TABLEII.
TABLEII.FEATURES PROPOSED FROM TRIANGLE GEOMETRY
No. Feature
Name Description 1 c/a Ratio c to a 2 a/b Ratio a to b 3 b/c Ratio b to c
4 A Angle of A
5 B Angle of B 6 C Angle of C 7 Gradient of CA 8 Gradient of BC 9 Gradient of CA
The features can be calculated by calculating the sides of triangle as shown in Fig. 3 below. In Fig. 3, three triangles were formed to get side “a”, “b” and “c”. After the simulated triangles are formed, Theorem Pythagoras is used in calculating its sides.
Below are the formula to get sides of triangle.
2 2 2
b
c
a
+
=
(1)
∴
2 2
(
1
(
)
1
(
))
))
(
)
(
1
(
A
y
C
y
A
x
B
x
a
=
−
+
+
(2)2 2
))
(
1
)
(
(
))
(
)
(
1
(
B
y
B
y
A
x
B
x
b
=
−
+
+
(3)2 2
))
(
1
)
(
(
))
(
)
(
1
(
C
y
C
y
A
x
C
x
a
=
−
+
+
(4)After the sides of triangle are calculated, the next step is to calculate the angle of “A”, “B” and “C” by using the formula below.
ab
a
c
b
A
2
arccos
2 2 2−
+
=
(5)ac
b
c
a
B
2
arccos
2 2 2−
+
=
(6)ab
c
b
a
C
2
arccos
2 2 2−
+
=
(7)Next, gradient of the corners are calculated using coordinates of corners as in Fig. 3.
)
(
)
(
)
(
)
(
x
C
x
B
y
C
y
B
GraBC
−
−
=
(8))
(
)
(
)
(
)
(
x
A
x
B
y
A
y
B
GraBA
−
−
=
(9))
(
)
(
)
(
)
(
x
A
x
B
y
A
y
B
GraCA
−
−
=
(10)After the features are modeled using the mathematical formula, the main issue now is how to define the coordinates of A, B and C in Fig. 3. Coordinate of C needs to be solved first before coordinate of A and B. Coordinate of C is solved using the formula below.
(11)
(12)
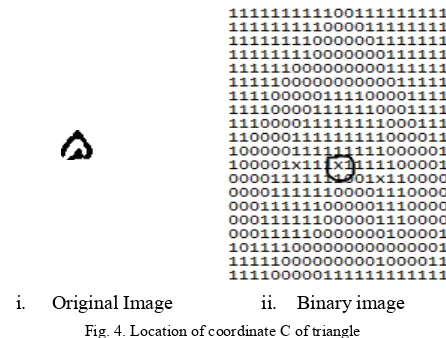
Coordinate C is the centroid of the image based on black pixels. The regions may be connected or not connected. The centroid of image that represents coordinate C is illustrated in Fig. 4 below. The “x” inside the drawn circle in Fig. 4is the coordinate of C.
i. Original Image ii. Binary image
Fig. 4. Location of coordinate C of triangle
Once coordinate of C is solved, the next step is finding the coordinates of A and B in Fig. 5. A is located on the left of C and B is on the right. Coordinate of C is used to divide the image in Fig. 4 into two regions as shown in Fig. 5.
Fig. 5. Location of coordinate A and B of triangle
The coordinates of A and B is calculated based on the divided regions. The coordinates are centroids of the divided regions.
Once the coordinates of the triangle corners are solved, the features in TABLEII can be calculated. In this phase, we have divided the image in Fig. 4 into 25 zones as shown in Fig. 6 below. The centroid of each zone is divided with Cartesian zone plane, vertically and horizontally.
The 25 zones as shown in Fig. 6 will contribute 225 features, which are 9 features of each zone multiplied by 25 zones. The features from the 25 zones are experimented using supervised learning and unsupervised learning. The supervised learning used in this test are Support Vector Machine (SVM) and Multilayer Perceptron (MLP).
IV.EXPERIMENTAL RESULTS
Experiments were conducted using Supervised and Unsupervised Machine Learning. SVM and MLP techniques were used for the Supervised Machine Learning. The SVM uses three difference cost and gamma (C and G) values that were obtained from grid search whereas for the MLP, the learning rates (LR) were chosen based on heuristic searches. The LRs are 0.2 and 0.3. For all the eleven case tests under supervised learning including the original distribution of images, the data for training and testing were randomly selected. These random experiments are done for the HODA, MNIST, IFHCDB and BANGLA datasets. TABLEIII and TABLE IV present the result of experiments conducted by using SVM. The gamma used is 0.0078125 and the costs are as stated in the tables. TABLEV shows results for experiments that used MLP.
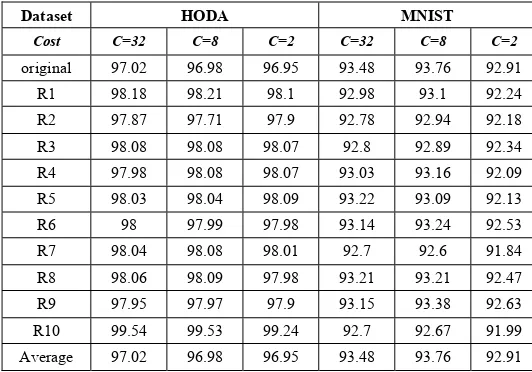
TABLEIII.RESULT OF CLASSIFICATION USING SVM FOR HODA AND
MNISTDATASETS
Dataset HODA MNIST
Cost C=32 C=8 C=2 C=32 C=8 C=2 original 97.02 96.98 96.95 93.48 93.76 92.91 R1 98.18 98.21 98.1 92.98 93.1 92.24 R2 97.87 97.71 97.9 92.78 92.94 92.18 R3 98.08 98.08 98.07 92.8 92.89 92.34 R4 97.98 98.08 98.07 93.03 93.16 92.09 R5 98.03 98.04 98.09 93.22 93.09 92.13 R6 98 97.99 97.98 93.14 93.24 92.53 R7 98.04 98.08 98.01 92.7 92.6 91.84 R8 98.06 98.09 97.98 93.21 93.21 92.47 R9 97.95 97.97 97.9 93.15 93.38 92.63 R10 99.54 99.53 99.24 92.7 92.67 91.99 Average 97.02 96.98 96.95 93.48 93.76 92.91
TABLEIV.RESULT OF CLASSIFICATION USING SVM FOR IFHCDB AND
BANGLA DATASETS
Dataset IFHCDB BANGLA
Cost C=32 C=8 C=2 C=32 C=8 C=2
original 93.49 93.49 93.41 90.05 90.13 89.93 R1 88.8 88.75 88.75 92.35 92.3 92.13 R2 89.8 89.8 89.4 92.93 93.15 92.8 R3 88.4 88.4 88.5 92.83 93 92.6 R4 88.35 88.35 88.05 92.25 92.45 91.88 R5 89.5 89.45 89.35 92.88 92.93 92.35 R6 90.4 90.4 90.2 92.28 92.73 92.33 R7 89.2 89.15 89.05 93 92.95 92.83
R8 88 88 87.6 93.23 93.03 92.75 R9 89.3 89.25 89.05 93.15 93.23 93.15 R10 97.1 97.1 96.35 93.35 93.28 92.95 Average 89.89 89.87 89.63 92.57 92.65 92.33
The average of the results shown in TABLEIII and TABLEIV
indicate that the cost value, C=32 gives the best result compared to C=8 and C=2. The result from original distribution also indicates that C=32 gives the highest result for all datasets. On the other hand, the HODA dataset results in the highest accuracy compared to the others.
TABLEV.RESULT FOR CLASSIFICATION USING MLP
HODA MNIST IFHCDB BANGLA
LR 2 3 2 3 2 3 2 3 original 96.02 96.21 91.93 91.35 94.15 93.89 88.48 87.48
R1 96.42 97.46 91.33 91.4 91.45 91 90 89.23 R2 96.82 97.15 91.03 90.86 90.75 90.35 90.9 90.43 R3 97.26 97.33 91.03 91.12 91.1 90.6 90.48 89.43 R4 96.96 97.24 90.96 91.25 91.1 90.6 90.45 87.43 R5 96.59 97.41 91.01 91.39 90.85 90.5 89.7 90.18 R6 97.22 97.38 90.97 91.17 91.9 91.95 90.2 90.05 R7 95.63 97.19 90.87 90.55 91.65 91.3 90.88 90.38 R8 96.8 97.14 91.16 90.9 90.5 90.85 90.6 89.35 R9 96.44 97.2 90.73 91.17 91.3 91.4 90.18 88.88 R10 97.85 99.04 90.91 90.82 96.85 96.45 90.03 89.95 Average 96.73 97.34 91 91.09 91.75 91.5 90.17 89.34
In TABLEV, for the HODA dataset, using LR=3 gives better result compared to LR=2. However for MNIST, IFHCDB and BANGLA datasets, using LR=3 gives higher result compared to LR=2.
TABLE VI below compares our proposed method using HODA dataset with the state of the arts works in this area. The proposed method successfully outperforms other features although using the same classifiers.
TABLEVI.RESULT OF PROPOSED METHOD COMPARED WITH STATE OF THE ARTS
Classifiers/
Features SVM (%) MLP(%)
Other (name: result) Small Feature Set [10] 97 - -
Characteristic LOCI
[11] - 91.45 RBF experts: 95.3 Characteristic LOCI
[12] - 96.48 MOME: 96.48
Proposed 98.07 96.73 -
V.CONCLUSION
highest accuracy i.e. 98.066%. Besides, comparison has been made with three other works and our proposed method successfully outperforms them. In conclusion, the proposed features are ready to be deployed as an application and can be improved to increase its accuracy.
ACKNOWLEDGMENT
The authors would like to thank the Government of Malaysia for sponsoring the research, Universiti Teknikal Malaysia Melaka for granting the study leave and incentives, and the Pattern Recognition Group, Faculty of Information Science and Technology, Universiti Kebangsaan Malaysia for providing excellent research faculties and facilities.
REFERENCES
[1] H. Khosravi and E. Kabir, “Introducing a very large dataset of handwritten Farsi digits and a study on their varieties,” Pattern Recognition Letters, vol. 28, no. 10, pp. 1133–1141, Jul. 2007.
[2] S. Mozaffari, K. Faez, F. Faradji, M. Ziaratban, and S. M. Golzan, “A Comprehensive Isolated Farsi / Arabic Character Database for Handwritten OCR Research,”
Electrical Engineering, 2006.
[3] M. Hamidi and A. Borji, “Invariance analysis of modified C2 features: case study—handwritten digit recognition,” Machine Vision and Applications, vol. 21, no. 6, pp. 969–979, Aug. 2009.
[4] U. Bhattacharya and B. B. Chaudhuri, “Handwritten numeral databases of Indian scripts and multistage recognition of mixed numerals.,” IEEE transactions on pattern analysis and machine intelligence, vol. 31, no. 3, pp. 444–57, Mar. 2009.
[5] M. S. Azmi, K. Omar, M. F. Nasrudin, A. K. Muda, and A. Abdullah, “Arabic calligraphy classification using triangle model for Digital Jawi Paleography analysis,” in
2011 11th International Conference on Hybrid Intelligent Systems (HIS), 2011, pp. 704–708.
[6] M. S. Azmi, K. Omar, M. Faidzul, N. Khadijah, and W. Mohd, “Arabic Calligraphy Identification for Digital Jawi Paleography using Triangle Blocks,” in 2011 International Conference on Electrical Engineering and Informatics, 2011, no. July, pp. 1714–1718.
[7] M. F. Nasrudin, “Pengecaman Tulisan Tangan Jawi Luar Talian Menggunakan Jelmaan Surih,” Universiti
Kebangsaan Malaysia, 2010.
[8] L. Schomaker, K. Franke, and M. Bulacu, “Using codebooks of fragmented connected-component contours in forensic and historic writer identification,” Pattern Recognition Letters, vol. 28, no. 6, pp. 719–727, Apr. 2007.
[9] E. W. Weisstein, “Triangle -- from Wolfram MathWorld.” Wolfram Research, Inc.
[10] G. Mirsharif, M. Badami, B. Salehi, Z. Azimifar, and A. D. Collection, “Recognition of Farsi Handwritten Digits Using a Small Feature Set,” International Journal of
Computer and Electrical Engineering, vol. 4, no. 4, pp. 588–591, 2012.
[11] R. Ebrahimpour, A. Esmkhani, and S. Faridi, “Farsi handwritten digit recognition based on mixture of RBF experts,” IEICE Electronics Express, vol. 7, no. 14, pp. 1014–1019, 2010.
[12] M. M. Javidi, R. Ebrahimpour, and F. Sharifizadeh, “Persian handwritten digits recognition: A divide and conquer approach based on mixture of MLP experts,”