DESIGN AND DEVELOPMENT OF ZIGBEE BASED
WIRELESS REMOTE CONTROLLING AND DATA
ACQUISITION DEVICE THROUGH INTERNET
ABDUL SAMAD BIN SHIBGHATULLAH1, SAKHR M. SULTAN1, HADEUR
R.ABUDULSHEED1, SUZI IRYANTI FADILAH2, MOHD HELMY ABD WAHAB2,3
1Faculty of Information and Communication Technology, Universiti Teknikal Malaysia, Melaka
2School of Computer Sciences, Universiti Sains Malaysia, Penang
3Faculty of Electrical and Electronic Engineering, Universiti Tun Hussein Onn Malaysia, Johor
E-mail:
[email protected], [email protected], [email protected],[email protected], [email protected]
ABSTRACT
IrDa and Bluetooth have been used widely in many wireless monitoring and controlling devices. Although, these devices have been replaced the traditional wired systems and contribute in solving the high cost of such systems, there are drawbacks been emerged. The major disadvantages are the range limitation of Bluetooth module and the line of sight problem of IrDa device. A ZigBee is low cost and low power consumption wireless technology. It has a higher connectivity range than Bluetooth and doesn’t have line of sight problem. In this paper, an application model using ZigBee wireless remote controlling and data acquisition device as well as the use of internet connection to enable the device to be used worldwide is presented. Such system has several benefits such as portable, long wireless range, low power consumption, low cost and can be used worldwide using internet. The test results show its potential to be implemented in small offices and smart homes.
Keywords: Internet, Remote Controlling And Monitoring, Zigbee, Wireless.
1. INTRODUCTION
Recent years have witnessed tremendous need to develop a sensor monitoring and control system with wireless capabilities to improve Energy Management Systems (EMS). Besides, EMS were originally designed for the automated control and monitoring of those electromechanical facilities in a building which yield significant energy consumption such as heating, ventilation and lighting installations [1]. On the other hand, large variety of applications where monitoring and control of physical environmental conditions is required in areas where wires cannot be placed. These applications are healthcare, food industries, agricultural greenhouse, building automation and etc. In healthcare industries. Years before, many traditional wired systems come out in markets to overcome these issues. However, these systems contributed in solving such issues, there were several drawbacks in such systems been arisen. For instance; people need to install wiring system before using them. Besides, these systems are quite expensive due to the wiring system and may not affordable for most of medicine companies.
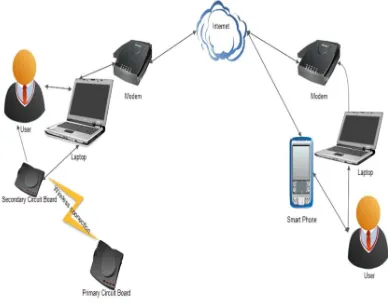
Figure 1: Block Diagram Of The Remote Desktop And Mobile To The Designed System.
2. SYSTEM DISCRIPTION
it is able to manually control these appliances by means of wireless communication. There are two methods used to display these values. In the first method, Liquid Crystal Display (LCD) is used to display the temperature and humidity values. While in the second method, a computer screen is used to show these values through a Graphical User interface (GUI). A GUI is a simple and user friendly interface designed to allow a user to monitor the temperature and humidity values and to control the electrical appliances such as light bulb by simply clicking the ON/OFF button. Besides, if the recorded temperature exceeds a predefined value, the control system will start functioning automatically by switching on a fan to maintain the desired environmental condition. Moreover, users able to monitor these environmental conditions and control these electrical appliances anywhere in the world by simply doing remote desktop and mobile connection as shown in figure 1. Therefore, this system is using a Zigbee Technology to carry out the wireless communication. It is low cost and low power consumption technology; it's based on IEEE 802.15.4 standards. Besides, it operates on 2.4 GHz ISM band, which is nearly available in all over the world. The range of the system in which the wireless connectivity can still survive is (10-100) meters.
3. SYSTEM DESIGN
During the designed hardware boards are powered up, the master microcontroller will initialize UART serial communication port and ADC channel to obtain input signals from sensors. Thereby, it will start to sense the output voltage from humidity and LM35 precision centigrade temperature sensors. It will convert the input analog signals which come from sensors into digital signal waveforms. Analog to digital conversion process (ADC) will be enabled based on comparison of the input analog voltage with the reference voltage 4.96V. For instance, if an 8-bits conversion is used, 2.5V can be converted to an 8-bits digital data which is 10000000 (128). After getting the digital data, the master microcontroller will send out the digital data to Xbee RF module. Besides, this module is responsible to transmit and receive the digital data from the slave microcontroller wirelessly. Therefore, the secondary microcontroller is connected to another Xbee RF module. This module will enable the microcontroller to continuously transmit and receive the digital data from the master microcontroller. After receiving the digital data, it
will be further processed and converted to ASCII characters. These characters will be sent out to LCD module. Furthermore, the LCD module will display the temperature and humidity values. The prototype of the whole system will keep continuously updating the room temperature and humidity values. On the other hand, when the temperature value exceeds a preset value that is, 26 Degrees Celsius, logic 1 will be sent out to the master microcontroller, this will turn on a fan that is connected to it. However, a user can monitor the values of the temperature and humidity on computer through a simple graphical user interface; user can manually switch on and off the electrical appliances such as light bulbs, by simply clicking the button that appears on the designed GUI.
Figure 2: The primary circuit board.
4. MAIN PROGRAM FLOW
The wireless sensor monitoring and control system was constructed and was able to measure the output signals from the sensors, and send them wirelessly. As well as, it was able to control them, by assigning them to different tasks. The main program flow is divided into two parts listed below:
1. The master microcontroller program flow as shown in figure .
These two main parts of the program flow will be discussed in details in the following sections.
Figure 3: The Secondary Circuit Board.
4.1 Master Microcontroller Program Flow
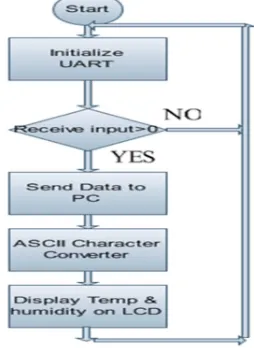
The program flow will describe the program execution mechanism of the primary microcontroller. Figure 4 illustrates the flow chart of the program execution of the primary microcontroller.
Figure 4: Flowchart Of The Primary Circuit Board.
The flowchart explains the fundamental operations of the primary microcontroller: When the master microcontroller is powered up, it will initialize UART serial communication
port and ADC channel to obtain inputs from sensors. It will obtain data from temperature and humidity sensors.
ADC process will start after obtaining the analog signals from sensors. The mathematical equation to obtain temperature in degree Celsius and humidity in percentage are:
T
V 35 96 288 5 1024 (1)
"#$#%% Voltage value from SNHMD 44 7 8896 1024 5 2
The master microcontroller will send the digital data to the Xbee wireless module to be transmitted wirelessly to the secondary microcontroller. If the temperature value is greater than 26 degrees Celsius, the fan will start operating automatically. It will keep monitoring its UART serial communication port. If data is presented, the master microcontroller will know that this data is a control signal comes from the computer to turn on the light bulb and vice versa.
4.2 Slave Microcontroller Program Flow
The program flow will describe the program execution mechanism of the slave microcontroller. Figure 5 illustrates the flowchart of the program execution of the slave microcontroller.
Figure 5: Flowchart Of The Secondary Circuit Board.
and will keep waiting for input signal. If input signal is presented, it will directly transmit the received data to the computer using RS232 serial port. The slave will start converting the received data to ASCII characters. Temperature and humidity values will be displayed on LCD character display. This process will keep repeating continuously.
5. RESULTS AND DISCUSSIONS
In this section, the hardware implementation results will be explained as well as results of the software implementation. Discussion on the obtained resulted will be handled in details.
After powering up the circuit boards, humidity and temperature in a room will be measured by the primary circuit board. Furthermore, the primary circuit will transfer the measured values by means of wireless communication using Xbee RF module to the secondary circuit. Besides, the secondary circuit board will receive the transmitted data wirelessly by using another Xbee RF module, and display it on LCD character display. Moreover, if the measured data exceed a predefined value, the primary circuit will turn on a fan and humidifier to control the temperature and humidity parameters, respectively.
Figure 6: Readings Of Temperature And Humidity Values.
Figure 6 illustrates the current temperature and humidity values displayed on LCD character display; these values are based on real time measurements. Furthermore, the displayed values had exceeded the predefined values which are 26 degrees Celsius and 50% RH, this will result in operating the fan automatically, that are attached to the primary circuit board.
Although, a wireless monitoring system for the temperature and humidity values has been achieved, a control system built to manage the temperature and humidity parameters. Therefore, if the temperature and humidity values exceed predefined values, that are 26 degrees Celsius
and 50% RH, a fan and humidifier that are attached to the primary circuit board will start operating automatically.
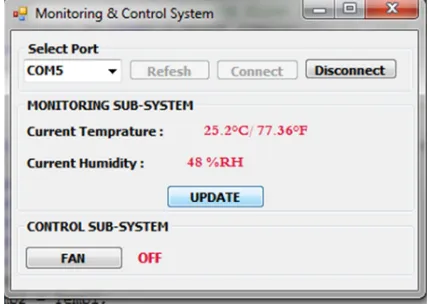
The designed GUI allows user to communicate between computer and the designed circuit boards through serial communications. Although, the user can monitor the temperature and humidity values through GUI, the user can also control the electrical appliances through computers such light bulbs. The designed GUI is divided into two parts. These are Monitoring and .Control subsystem. A monitoring subsystem is a part from the designed GUI. It is used to allow users to monitor the temperature and humidity values.
Figure 7: Current Reading Of Temperature And Humidity Values.
Figure 7 shows the monitoring subsystem that contains the current temperature and humidity values, the measured values are on a real time basis; this is because the primary microcontroller is sending these values continuously. The UPDATE button is made to get the updated values.
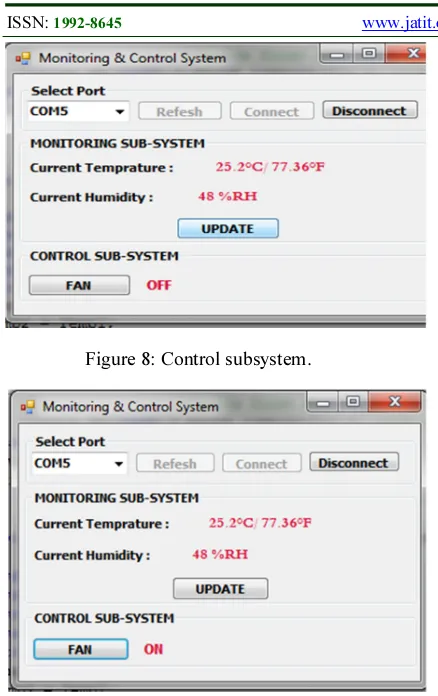
Figure 8: Control subsystem.
Figure 9: Controlling of electrical appliances.
The designed circuit boards are accessible anywhere in the world using the remote desktop and mobile connection. Although, users can access the designed system to monitor the temperature and humidity values using computers, smart phones and iPads through internet, they can also control the electrical appliances by simply clicking the ON/OFF button, while they are away from the place where the designed circuit boards are placed.
6. CONCLUSION
A wireless sensor monitoring and control system through internet has been successfully designed and developed. The basic operation of the system is to monitor the physical environmental conditions such as temperature and humidity parameters wirelessly. Furthermore, the system is able to control environmental conditions automatically by controlling the electrical devices such as fan and humidifier. LCD display is used to display the values of the temperature and humidity. Along with wireless technique that has been added
to the system, user can place this system in areas where wires cannot be placed. The range of this system in order to operate wirelessly is 10 meters indoor and 100 meters outdoor. From the test results, it can be concluded that all the objectives of this project has been fulfilled. Apart from the basic functions of this system, three enhancements were successfully added to the systems which are: designing a simple Graphical User Interface (GUI), remote monitoring and control through internet by using computers and smart phones as well. However, users can monitor the temperature and humidity values through the designed GUI; they can manually control the electrical appliances by simply clicking the ON/OFF button that appears on it. Besides, users able to monitor these environmental conditions and control these electrical appliances anywhere in the world by simply doing remote computer and mobile connections. There are many advantages can be obtained from the designed system. Firstly, the system can be used to monitor as well as to control the environmental conditions by means of wireless communications. Secondly, the designed system can be used to save power usage by controlling the electrical appliances manually and automatically. Lastly, the system can be accessed anywhere using internet; this gives freedom to users who wants to use this system anywhere in the world.
REFERENCES
[1] Alex_su, (2011, September), Importance of Temperature Monitoring,[online]. All about articles.
[2] Agrawal, B., & Tiwari, G. N. (2010). Life cycle cost assessment of building integrated photovoltaic thermal (BIPVT) systems
[3] Zogou, O., & Stapountzis, H. (2012). Flow and heat transfer inside a PV/T collector for building application
[4] Chen, H., & Wei, P. (2011). Numerical Study on a Novel Photovoltaic/Thermal Heat Pump System.
[5] Chow, T. T. (2010). A review on photovoltaic/thermal hybrid solar technology.
[7] Chow, T. T., Pei, G., Fong, K. F., Lin, Z., Chan, a. L. S., & Ji, J. (2009). Energy and exergy analysis of photovoltaic–thermal collector with and without glass cover. [8] Dev, R., & Tiwari, G. N. (2010).
Characteristic equation of a hybrid (PV-T) active solar still. photovoltaic/thermal (PV/T) hybrid collector technology.
[11] Dupeyrat, P., Ménézo, C., Rommel, M., & Henning, H.-M. (2011). Efficient single glazed flat plate photovoltaic–thermal hybrid collector for domestic hot water system.
[12] Ong, C. L., Escher, W., Paredes, S., Khalil, a. S. G., & Michel, B. (2012). A novel concept of energy reuse from high concentration photovoltaic thermal (HCPVT) system for desalination. [13[ Energy, S. (2009). Hybrid Photovoltaic
Thermal ( PV / T ) Air and Water Based Solar Collectors Suitable for Building Integrated Applications Adnan Ibrahim , Goh Li Jin , Roonak Daghigh , Mohd Huzmin Mohamed Salleh , Mohd Yusof Othman , Mohd Hafidz Ruslan , Sohif Mat and Kam,
[14] Fang, G., Hu, H., & Liu, X. (2010). Experimental investigation on the photovoltaic–thermal solar heat pump air-conditioning system on water-heating mode. Experimental Thermal and Fluid Science
[15] Gang, P., Huide, F., Huijuan, Z., & Jie, J. (2012). Performance study and parametric analysis of a novel heat pipe PV/T [16] Gang, P., Huide, F., Jie, J., Tin-tai, C., &
Tao, Z. (2012). Annual analysis of heat pipe PV/T systems for domestic hot water and electricity production.
[17] Gang, P., Huide, F., Tao, Z., & Jie, J. (2011). A numerical and experimental study on a heat pipe PV/T system. [18] Sarhaddi, F., Farahat, S., Ajam, H., &
Behzadmehr, a. (2010). Exergetic performance assessment of a solar photovoltaic thermal (PV/T) air collector.
[19] Sayegh, M. A., Khayata, N., & Nahhas, T. (2011). Design and Experimental Study for Using PV/T Collectors in the Faculty of Mechanical Engineering University of Aleppo. hybrid photovoltaic thermal double pass facade for space heating.
[22] Kostic, L. T., Pavlovic, T. M., & Pavlovic, Z. T. (2010). Influence of reflectance from flat aluminum concentrators on energy efficiency of PV/Thermal collector investigation and optimization of the
Trough Concentrating
Photovoltaic/Thermal system.
[25] Li, M., Ji, X., Li, G., Wei, S., Li, Y., & Shi, F. (2011). Performance study of solar cell arrays based on a Trough systems with covered sheet-and-tube PVT collectors