1 INFLATION HEDGING PORTFOLIO CONSTRUCTION WITH INFLATION BETA
APPROACH BASED ON LQ45 EQUITIES FROM 2007-2013
Tegar Satya Putra Sukmawati Sukamulja
International Business Management Program, Economics Faculty Universitas Atma Jaya Yogyakarta
Jalan Babarsari 43-44, Yogyakarta
ABSTRACT
Markowitch Modern Portfolio theory is undeniably the most famous portfolio approach to diversify risks that investors face in investing their money. This portfolio construction approach may be effective to diversify investment’s risks. However, Markowitch Modern Portfolio Theory only diversifies unsystematic risks. In other hand systematic risks tend to be ignored. One of the systematic risks that investors face is inflation. Inflation reduces investment return, which resulted in investors’ loss. The immense effect of inflation to the investment shows that new approach in constructing portfolio is essentially needed. Based on that fact, this research was conducted with several objectives, they are: (1) To analyze inflation hedging ability of Indonesia equity instruments using inflation beta approach, (2) To examine effect of inflation beta approach on risk and return of portfolios, (3) To investigate effect of inflation beta approach on portfolios’ performance. (4) To explore future representativeness of inflation beta approach with the construction of ex- ante portfolio.
Keywords: Inflation Hedging, Inflation Beta, Portfolio
INTRODUCTION
Implementation of Markowitch Modern Portfolio Theory may be quite dependable to reduce our investments’ risks. But, one thing that Markowitch modern portfolio theory lacks is that Markowitch Modern portfolio theory only considers about how to diversify unsystematic risk (Hewitt EnnisKnupp, 2012). Markowitch Modern Portfolio theory tends to ignore systematic risk.
One of the systematic risks that threaten the well-being of investments is inflation (Bekaert & Wang, 2010). Based on Ang, Brière, & Signori (2012), inflation erodes money’s value and increase the cost of investment that resulted in the decrease of the investment return. Furthermore, majority of financial assets are more vulnerable to the inflation compared to the real asset (Ruff & Vince, 2011). Several researchers such as Sing & Low (2000), Gunasekarage, Power, & Zhou (2008) found that in general financial assets are more vulnerable against inflation.
2
hedging portfolio found that Modern Portfolio approach could have a big crash if inflation booming (unexpected inflation) happened. Based on that, it can be concluded that Markowitch Modern Portfolio Theory is not enough to ensure the well-being of our investments anymore. Markowitch Modern Portfolio does not provide proper protection against inflation and new approach in constructing financial portfolio needs to be explored. Furthermore, previous research about inflation hedging was only concerned about individual asset and market as a whole but tends to ignore portfolio as a possible inflation hedge.
Beside the need of further research, there are two specific reasons that make this research interesting enough to be conducted in Indonesia. First, since Indonesia achieved its independence, inflation has become one of the major problems in Indonesia. This is worsen by the fact that implementation inflation targeting in Indonesia still far from success (Ismail, 2006). Second, based on the risk and return perspectives, Indonesia Capital Market is considered as one of the promising capital market in Asia. This is proven by fact that in 2011, Indonesia Capital Market was the second best capital market in Asia-Pacific. Indonesia Capital Market achieved positive return when other big capital market such as Hanseng and Nikkei had negative return (Suprapto & Sukirno, 2011). Thus, there is a possibility that Indonesia equities (stocks) may be can become good inflation hedge.
LITERATURE REVIEW AND THEORITICAL FRAMEWORK Inflation Hedging
Inflation hedging is an investment in an asset that positively correlated with inflation (Bekaert & Wang, 2010). An asset with positive co-variation will typically rise in value when inflation rate rises. This will give investors protection again inflation risk when the inflation suddenly rises. The most common asset to hedge inflation is gold. Several other real assets such as land and oil are also considered as inflation hedge (Manuel, 2013).
Inflation Hedging Portfolio
Inflation hedging portfolio or also called as inflation proof portfolio is a portfolio which is constructed in order to hedge or decrease inflation exposure in the portfolio itself. In order to construct an inflation-hedging portfolio, firstly, examination of inflation hedging ability across assets needs to be conducted. One of the techniques to measure inflation hedging ability is inflation beta of an asset.
3 Inflation Beta
“Inflation beta is a value that shows how strongly a security’s nominal return covaries with inflation.” (Ang, Brière, & Signori, 2012). Inflation beta is the inflation coefficient that is derived from regression between inflation rate as independent variable and asset’s return as dependent variable. Bekaert and Wang (2010) cited by Ang, Briere and Signori (2012) said that if value of inflation beta is equal to one, the assets hedges inflation perfectly. “A perfect inflation hedge does not mean that the correlation between asset’s return and inflation rate is also one because of idiosyncratic risk. But by knowing inflation beta value, investors could compute hedging ratio and help them to create well diversified portfolio and eliminate idiosyncratic risk.” (Bekaert & Wang, 2010). Inflation beta can be expressed as below:
R
it= α+β
t+ε
t(1)
Where
R
it is the monthly nominal return of stock i, β t is the monthly rate ofinflation, and εt is the residual of the regression that measures the part of the nominal return
that is not explained by inflation.
METHODOLOGY
This research used secondary data, which were obtained from various sources such as Yahoo Finance, Bank Indonesia and Indonesia Central Bureau of Statistics and also Indonesian Capital Market Directory. Purposive sampling was used as the sampling method. Some criteria were placed to do sample filtering. The criteria set in this research were:
1. Listed in LQ45 index at least 4 times in rows between 2007 until 2013.
2. Listed in Indonesia Capital Market Directory as Public Company since at least January 2007 until December 2013.
3. Complete monthly price (adjusted closing price) information in 2007-2013 period.
The first criteria was created based on assumption that when a company listed continuously for 2 years in LQ45, the company itself can be considered as quite strong company from financial point a view. Based on the sampling result, 25 equities fulfilled all of the criteria and were used as sample of this research. The analysis was consisted of two parts. The first part was analysis of inflation hedging portfolio construction based on ex post point a view. The second part was analysis of portfolio construction in ex ante point a view. The ex ante point a view was used in order to see the future result of inflation hedging portfolio which was constructed based on historical data.
Individuals Equities’ Inflation Beta Measurement
4 Ex Post Portfolio Construction
The twenty-five equities were sorted in descending manner based on their inflation beta. Construction of the sample portfolios, was based only the rank of inflation beta values. Five portfolios were created based on the inflation beta. The five equities with high inflation beta were used to construct Q1 portfolio and the last portfolio, which was Q5, consisted of five equities with lowest inflation beta. Average portfolio was also created based on the average performance of Q1 until Q5 portfolio. Average portfolio (Q1-Q5) was created in order to compare between each quintile portfolio with the overall performance of the sample. All portfolios were equally weighted. Equal weight was used in order to see the effect of the use inflation beta to construct portfolio better by giving an even playing field to each equities. Furthermore, there is no appropriate weighting method to measure the importance of inflation beta in portfolio construction.
The ex post quintile porfolios risk and return were measured with following approaches. Return of the five portfolios were measured with equation in below (Jones, 2002, p. 179):
r
p= W
1r
1+W
2r
2+…………+W
nr
n(2)
W is the weight of the assets in portfolio and r is the individual asset (stock) return. In other hand portfolio risk was measured by standard deviation and variance. Equation of variance and also standard deviation shown in below (Jones, 2002, p. 179):
:
σ
2=
(3)
Where σ2
is variance, rpt is return of portfolio in certain period and is the expected return of the portfolio. Expected return in this case is the average of return of the portfolio in the research period.
σ=
(4)
Where
σ
is the standard deviation, rpt is return of portfolio in certain period and is the expected return of the portfolio.Coefficient of variation of the five portfolios was also measured. Coefficient of variation in other hand is a measure of tradeoff between risk and return in portfolio. Below is the equation of coefficient of variation (Jones, 2002, p. 179):
Coefficient of Variation
=
(5)
Portfolio Success Rate Measurement
5
Success Rate
=
(6)
Where number of portfolio success is represent how many times the portfolio success in hedging inflation and n is the total number of the observation from the observation period.
Measurement of Portfolio Inflation Beta
The five portfolios’ inflation beta were measured. This was done to check the inflation hedging ability of each portfolio. Moreover, this measurement was also conducted to check whether constructing portfolio with inflation beta approach resulted in portfolio with high inflation beta or not. The equation to measure the portfolio inflation beta has been elaborated in equation 1.
Measurement of Portfolio Systematic Risk
In order to prove the effectiveness of inflation beta approach in reducing inflation risk, measurement of systematic risk of the each portfolio was conducted. The measurement of portfolio systematic risk was calculated by using single index model. Single index model measures market beta of each portfolio by using regression of the market return as an independent variable to the asset return as the dependent variable. Market beta (βM) is a measure of asset or portfolio sensitivity to the common factors in the market (Blake). Below is the single index model equation (Blake):
+
+ (7)
Where is the component of asset i’s return that is unique (firm-specific) to asset i; βi, a measure of the sensitivity of asset i’s return to the return on the market portfolio; RM is the random (uncertain) total return on the market portfolio;ei is epsilon; the random component of asset i’s return that is unique (firm-specific) to asset i.
Portfolio Performance Measurement
Measurement of overall performance of the portfolio was also conducted. The measurement of the portfolio performance was measured by the Sharpe ratio or also called as RVAR. This ratio measures portfolio performance based on the excess return of the portfolio to the per unit total risk in the portfolio (Jones, 2002, p. 571). LQ45 Sharpe ratio was also calculated as a benchmark in order to do bogey. Bogey is comparison of the performance of a portfolio with the benchmark portfolio or a market portfolio (Bodie & Kane, 1992, p. 585). Sharpe Ratio equation can be defined as (Jones, 2002, p. 571):
Sharpe Ratio= (TR
p-Rf)/SD
p(8)
Where TRp is the average total return for portfolio during some period of time; Rf is the risk free rate: SDp is the standard deviation of portfolio return the period and (TRp-Rf) is the excess return (risk premium) of the portfolio.
Ex Ante Portfolio Construction (Out of Sample Portfolio)
6
time range and the assumptions which were used in constructing the portfolio. Below are the assumptions, which were used in the ex, ante portfolio construction:
1. The five portfolios were created in the early January 2010 (as the time t) and were held until end of December 2013 (t48).
2. Inflation beta was calculated as the same way as the ex post portfolio, but only based on 2007 until 2009 (t-36-t-1) adjusted closing price data. Sample portfolios were constructed based on the 2007 until 2009 inflation beta.
There were five sample portfolios, where Q1 was portfolio that consisted of equities that had highest inflation beta compared to the other portfolio until the last portfolio Q5. Author also created average portfolio from Q1-Q5. The overall procedures in calculating portfolios’ risk and return, portfolio inflation beta, sharpe ratio were same with ex post analysis.
FINDING AND DISCUSSION Inflation Beta of Individual Equities
In order to give a bird view of inflation beta in LQ45 in general, inflation beta of the LQ45 index is discussed first. Table 1 below shows the regression result of LQ45 with inflation rate from January 2007 until December 2013.
Table 1. Inflation Beta of LQ45
Coefficients Standard Error t Stat P-value Intercept 0.026572691 0.010904741 2.436802 0.01701 Inflation Beta -3.107860389 1.40449319 -2.2128 0.029726
Based on the regression result between inflation rate (independent variable) and the LQ45 return (dependent variable), the inflation beta of LQ45 was -3.1078 and the value was significant in 5% confidence level. This result indicated that LQ45 equities have poor inflation hedging ability in general. The values of the equities eroded as the inflation increases. The poor inflation beta result of the equities index in this research similar to previous studies. Studies by Ruff & Vince (2011) and Ang, Brière, & Signori (2012) also found that S&P 500 equities has poor inflation hedging ability.
Regression result of the 25 equities respective return with inflation (which is not showed in this article) also showed that majority of equities in the sample were poor inflation hedges. 24 of 25 equities had negative inflation beta. Only one equity, which is Timah Tbk. (TINS), had positive inflation beta although statistically insignificant. Moreover, only small portion (10 equities) of the equities in the sample was statistically significant ranging from 1% level of confidence until 10% level of confidence. This finding supports several previous studies in this topic, Hoesli, Lizier, & MacGregor (2008), Bond & Rubens (2010) and Ang, Brière, & Signori (2012) also found that majority of equities had negative inflation beta, only small set of equities covaried positively with inflation. Furthermore Ang, Brière, & Signori (2012), also found that the inflation beta in majority of S&P500 from 1989-2010 were statistically insignificant.
7
beta compared to the others. Research by Ang, Brière, & Signori (2012) also found similar result, they found that basic materials equities in average had high positive inflation beta.
Ex-Post Portoflio Risk and Return Measurement
Table 2. Risk and Return of Ex Post Portfolio EX POST PORTFOLIO
Q1 Q2 Q3 Q4 Q5 Q1-Q5 LQ45
Annual average
return 19.755% 18.819% 20.087% 27.492% 12.378% 19.694% 12.803% Standard Deviation 22.881% 43.640% 60.655% 48.420% 88.662% 58.797% 43.340% Variance 5.235% 19.045% 36.790% 23.445% 78.609% 34.571% 18.783% Coefficient of
Variation 1.1582 2.3189 3.0196 1.7612 7.1629 2.9855 3.385177 Where: Q1 is portfolio which consisted of 5 equities that have rank from 1st to 5th
Q2 is portfolio which consisted of 5 equities that have rank from 6th to 10th Q3 is portfolio which consisted of 5 equities that have rank from 11th to 15th Q4 is portfolio which consisted of 5 equities that have rank from 16th to 20th Q5 is portfolio which consisted of 5 equities that have rank from 21th to 25th
*The rank was based on inflation beta of the equity, higher rank equity means that the equity has higher inflation beta compared to the equity which has lower rank.
Based on the result presented in table 2, in comparison with LQ45 return, return of all portfolios including the average portfolio (Q1-Q5) were higher than the LQ45 return. The average return of the portfolios were varied, but there was an indication that portfolios of equities with low inflation beta provide higher return than portfolios which were consisted with equities with high inflation beta. This was showed by Q2,Q3 and Q4 portfolios’ average return.
The result of the portfolio in this research supports previous research finding by Duarte (2010). He found that portfolios which were consisted with high inflation beta equities generally provided higher return compared to the portfolios which were consisted with low inflation beta equities.In other hand, surprisingly Q5’s return did not conform with the other portfolio return. Return of Q5 was the lowest return compared to the other portfolios’ return. The difference of the result may come from the other cross sectional factor in equities beside inflation beta. Note that in this research portfolio construction is only based on the inflation beta, other factors such as growth rate and correlation between each equities were not considered.
8
total risk of the portfolios. By observing the pattern, one conclusion can be made that inflation beta approach in portfolio construction minimizes risk in the portfolio.
Based on the result of the coeffient of variation, portfolio with the lowest coefficient of variation was Q1. Portfolio with the highest coefficient of variation was Q5. Q5 had 7.1629 value in coefficient of variation, which was higher than LQ45 coefficient of variation. Furthermore, Q5 coefficient of variation was also higher than the average portfolio’s (Q1-Q5) coefficient of variation. This suggested that Q5 portfolio had the biggest risk return tradeoff compared to the other portfolio. By excluding the Q4 result, one can concludes that inflation beta approach in portfolio construction boost the portfolio performance in term of the risk- return tradeoff.
In comparison with the average portfolio (Q1-Q5), there were three portfolio which had lower coefficient of variation than the average portfolio. They were Q1, Q2 and Q4. Note that two of the portfolios were the portfolios which were consisted of equities with higher inflation beta. In other hand, the Q5 coefficient of variation was much higher than the average portfolio. Q5 also the only one portfolio which had higher coefficient variation compared to the LQ45. This condition also suggest that inflation beta approach in portfolio construction in in some extend minimizes risk- return tradeoff of a portfolio .
Ex Post Portfolio Success Rate
The result of the success rate of the overall portfolio were quite varied. But, there was also slight indication of positive relationship between inflation beta of equities and success rate of the portfolio. Result of the portfolio success rate can be seen in table 3 below:
Table 3: Ex Post Portfolio Success Rate Portfolio
Success Rate
Q1 61.45%
Q2 57.83%
Q3 63.86%
Q4 60.24%
Q5 54.22%
Q1-Q5 63.86%
LQ45 60.24%
9 Ex Post Portfolio Inflation Beta
According to the result of the regression analysis of inflation and portfolio return which is shown in table 4 below, all of the portfolio had negative inflation beta. This may happened because the overall equities that were used to build the portfolio were negative in general. Like what has been explained previously, only one equity across the overall sample that had positive inflation beta although statistically insignicant. This also suggested that one needs to include other type of asset or security in the portfolio construction to hedge inflation better. Q1-Q5 -4.2375 0.0183 significant at 5% level
The Q1 portfolio,which was consisted of five equities with highest inflation in the sample, also had the highest portfolio inflation beta. The portfolio inflation beta kept getting lower until reach its lowest point in Q5 inflation beta. An attention need to be payed in the magnitude of the portfolio inflation beta. All of the portfolio inflation beta had negative inflation beta, even the highest inflation beta is also negative. This is a further proof that equities in general are poor inflation hedges and portfolio which is consisted of only equities will also has poor inflation hedging ability. Moreover, inflation betas which were statistically significant were the inflation beta with inflation beta with magnitude lower than -3 value. Previous research by Ang, Brière, & Signori (2012) also found similar result. They had found that only one of the portfolio in their sample had positive inflation beta but statistically insignificant. The other four portfolios also had negative inflation beta ranging from -0.34 until -2.22. But, they only had found one portfolio which the inflation beta was statistically significant.
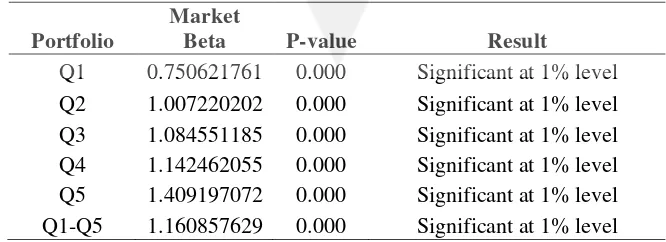
Measurement of Ex- Post Portfolio Systematic Risk
Single Index Model was used as a measurement of the portfolios’ systematic risk. The result of the regression signified a strong relation between inflation beta of a portfolio with its systematic risk. Table 5 below summarized result of the measurement:
Table 5: Ex Post Portfolio Market Beta
Portfolio
Market
Beta P-value Result
10
As shown in table 5, all of the market betas were significant at 1% level. The portfolio with lowest market beta was Q1 and the highest inflation beta was Q5. Note that Q1 which had the highest inflation beta had the lowest systematic risk and Q5 which had lowest inflation beta had the highest systematic risk. In general, it can be said that as the portfolio inflation beta became lower, the market beta (systematic risk) of the portfolio became higher.
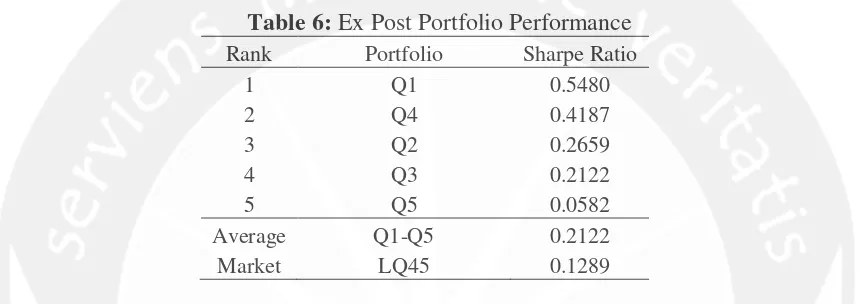
Ex Post Portfolio Performance Measurement
Sharpe ratio was used as the tool to analyze the portfolio performance in this research. Sharpe ratio was used because Sharpe Ratio is the most common ratio which is frequently used by fund manager to asses portfolio performance. Below is the result of the portfolio performance measurement of the sample portfolios and overall market
Table 6: Ex Post Portfolio Performance Rank Portfolio Sharpe Ratio
1 Q1 0.5480
2 Q4 0.4187
3 Q2 0.2659
4 Q3 0.2122
5 Q5 0.0582
Average Q1-Q5 0.2122
Market LQ45 0.1289
As shown in table 6, the portfolio with the highest sharpe ratio was Q1 with 0.5480 and the lowest was Q5 with 0.0582. Furthermore, The only portfolio which underperformed the market was Q5. This strengthens the indication of positive relation between inflation beta and portfolio performance. This result is a sign of positive relation between portfolio inflation beta and sharpe ratio. Furthermore, by excluding Q4 result, other portfolios also exhibited strong positive relation between portfolio inflation beta and portfolio performance. The portfolio performance became better as the inflation beta of the portfolio became higher. This result strongly suggests that portfolio with high inflation beta performs better than portfolio with low inflation beta.
Ex Ante Portfolio Construction
Ex ante portfolios were created in order to test inflation beta ability in hedging future inflation. This is important due to analysis based on the historical performance does not ensure that same result will be happened in the future. By doing this ex ante portfolio construction, the representativeness of inflation beta in future inflation hedging can be known. The result of the ex ante analysis showed that portfolio which constructed by using past historical data does not guarantee same things will be happened in the future.
11
Fama & Schwert (1977) and Ang, Brière, & Signori (2012). In spite of the similiarity in the negative value of the inflation beta, some of the equities had a significant change in their inflation beta. For example, , ISAT had negative inflation beta (-0.109) in the ex post result but had positive inflation beta (0.536) in the ex ante result. UNVR had -0.06 in the ex post regression result but changed to -1.321 in the ex ante result. These changes had one major cause. The major cause is high time variability in the inflation beta (Ang, Brière, & Signori, 2012). This high time variability in inflation beta made inflation beta of an equity changes rapidly thorough time. Ang, Brière, & Signori (2012) stated that this high time variablity also makes equity with high inflation beta does not guarantee protection to future inflation.
Ex-Ante Portoflio Risk and Return Measurement
The ex- ante portfolio risk and return was measured by same approach which was used to measure risk and return of the ex post portfolio. Below is the result of the risk and return
Based on their respective average annual returns, three portfolios (Q1,Q3 and Q4) outperformed the average portfolios and also LQ45’s return. Two portfolios (Q2 and Q5) had an underperformance. Portfolio with the highest return was Q3 with 21.77% and the lowest portfolio was Q2 with 2.33%. These two results were quite surprising, as Q3 was only a middle portfolio which consisted of equities with meager inflation beta and Q2 which consisted of equities that had quite high inflation beta performed poorly. This high variability in the result of strongly indicates that inflation beta approach in portfolio construction does not guarantee promising return in the future (Ang, Brière, & Signori, 2012). This was caused by the inability of the inflation beta to predict future prospect of the equity growth rate. Inflation beta is only a measure of covariation between inflation and return which does not take account growth prospect of the equity.
Concerning the risk of the ex ante portfolios, only two portfolios (Q1 and Q4) had risk lower than average portfolio and LQ45. This variation of the result advocates that inflation beta approach does not guarantee reduction of portfolio total risk. This was due to the instability of the inflation beta across the time horizon. This instability makes good inflation hedging ability (high inflation beta) in the past does not guarantee good inflation hedging ability in the future (Ang, Brière, & Signori, 2012). Moreover, based on Bekaert & Wang (2010), equities in general has poor inflation hedging ability for the short and medium period of time. This is because inflation makes interest rates crawl up and in the end impair equity valuations (Hofschire, Carlson, & Bewick, 2013). This poor result also implies that looking for inflation hedging portfolio is a difficult task because myriad factors influence asset and portfolio’s hedging ability (Krämer, 2012).
12
those two portfolio, three other portfolios’ coefficient of variations showed a visible rising pattern. Q1 coefficient of variation was 1.13. Q3 had 1.16 and Q5 had 2.23. This pattern advocates that inflation beta maximizes the portfolio performance which also was found in the ex post portfolio.
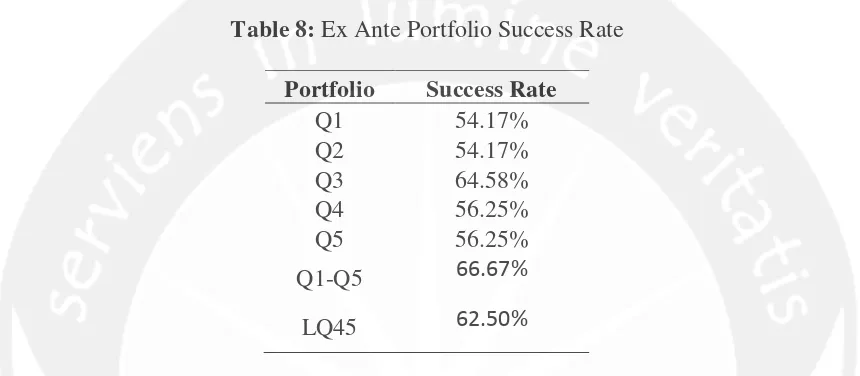
Ex Ante Portfolio Success Rate
The inflation hedging success rate of the ex ante portfolio was also measured.Based on the result, it was found that portfolio which was constructed based on the inflation beta did not affect the future success rate of the portfolio. The success rate for the ex ante portfolios shown in table 8 below:
Table 8: Ex Ante Portfolio Success Rate
Portfolio Success Rate
Q1 54.17%
Q2 54.17%
Q3 64.58%
Q4 56.25%
Q5 56.25%
Q1-Q5 66.67%
LQ45 62.50%
Based on the result which was shown in the table 8, it was quite surprising that Q1 and Q2 which consisted of equities with high inflation beta had the lowest success rate compared to the other portfolios. Q1 and Q2 had 54.17% success rate, which mean that only 54.17 % of Q1 and Q2 return were higher than inflation. Moreover, Q1 and Q2 also had lower success rate compared to the average portfolio and also LQ45. The other portfolios success rate were quite varied in number. Q3 had 64.58%, which was the highest success rate across the sample portfolios. Surprisingly, Q4 and Q5 had 56.25% success rate, which were higher than Q1, and Q2 success rate. There was no sign that high inflation beta leads to the high success rate of inflation hedging, This variation can be seen as a proof that inclusion of inflation beta in the portfolio construction does not guarantee the success of inflation hedging in the future.
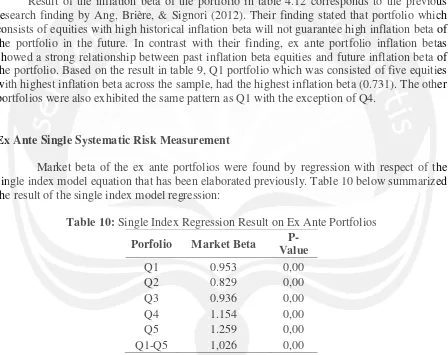
Ex Ante Portfolio Inflation Beta
13
Table 9: Ex Ante Portfolio Success Rate
Portfolio Inflation
Beta P-Value Result
Q1 -0.731 0.65 Not Significant
Q2 -0.983 0.49 Not Significant
Q3 -2.713 0.08 Significant at 10% level
Q4 -1.853 0.27 Not Significant
Q5 -4.680 0.02 Significant at 5% level Q1-Q5 -2.192 0.11 Not Significant
LQ45 -1.887 0.13 Not Significant
Result of the inflation beta of the portfolio in table 4.12 corresponds to the previous research finding by Ang, Brière, & Signori (2012). Their finding stated that portfolio which consists of equities with high historical inflation beta will not guarantee high inflation beta of the portfolio in the future. In contrast with their finding, ex ante portfolio inflation betas showed a strong relationship between past inflation beta equities and future inflation beta of the portfolio. Based on the result in table 9, Q1 portfolio which was consisted of five equities with highest inflation beta across the sample, had the highest inflation beta (0.731). The other portfolios were also exhibited the same pattern as Q1 with the exception of Q4.
Ex Ante Single Systematic Risk Measurement
Market beta of the ex ante portfolios were found by regression with respect of the single index model equation that has been elaborated previously. Table 10 below summarized the result of the single index model regression:
Table 10: Single Index Regression Result on Ex Ante Portfolios Porfolio Market Beta
P-Value
Q1 0.953 0,00
Q2 0.829 0,00
Q3 0.936 0,00
Q4 1.154 0,00
Q5 1.259 0,00
Q1-Q5 1,026 0,00
14 Ex Ante Portfolios Performance Measurement
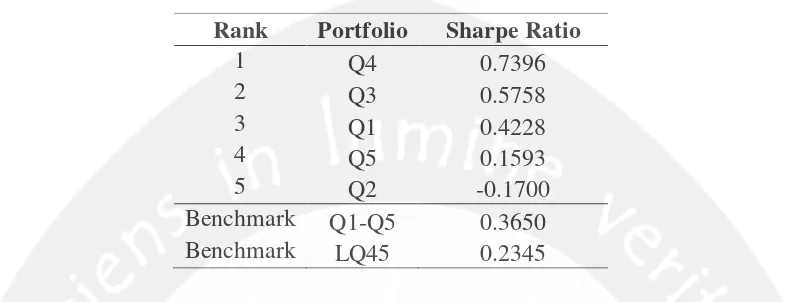
Measurement of the portfolio performance of the ex ante portfolio proved the instability of inflation beta to guarantee good portfolio performance in the future. The result of the portfolio measurement is shown in table 11 below:
Table 11: Ex ante Portfolio Sharpe Ratio
Based on the portfolio performance measurement, the portfolio with the highest return to variability ratio was Q4 (0.7396) and the lowest is Q5 with -0.17. Compared to the average portfolio and also LQ45 performance, 3 portfolios (Q4,Q3 and Q1) outperformed the average portfolio performance and only 2 portfolio (Q5 and Q2) underperformed the average portfolio. In general, the result of portfolio performance showed no sign of maximization of portfolio performance. This is clearly indicates that inflation beta approach in portfolio construction does not maximize portfolio performance in the future.
CONCLUSION
Indonesia equities are poor inflation hedges in general, as their inflation beta were majority negative and only few equities were good inflation hedges. Based on the ex post analysis only one equity across the sample had positive inflation beta and only two equities had positive inflation beta in ex ante analysis. This finding supports several research finding which postulated by several researchers such as Fama & Schwert (1977), Hoesli, Lizier, & MacGregor (2008), Bekaert & Wang (2010), Ruff & Vince (2011) and Ang, Brière, & Signori (2012). In the same time this research finding also contradicts with several previous finding such as Fama & Schwert (1977), Lothian and Mc Charty (2001) and Spierdijk and Zaghum Umary research (2011).
Based on the ex post analysis, inclusion of inflation beta minimized portfolio total risk and also systematic risk. This was shown by the higher standard deviation of the portfolio which was consisted of equities with lower inflation beta. This finding partially supports previous research by Ang, Brière, & Signori (2012). Construction of the portfolio by including inflation beta factor also reduced systematic risk of the portfolio which was shown by lower market beta in the portfolio with high inflation beta. However, according to the ex ante analysis inflation beta did not necessary reduces future portfolio total risk which was shown by dispersed result in the standard deviation of the portfolio. However, the ex ante market beta showed a surprising result. The result suggests high representativeness of past
Rank Portfolio Sharpe Ratio
1 Q4 0.7396
2 Q3 0.5758
3 Q1 0.4228
4 Q5 0.1593
5 Q2 -0.1700
Benchmark Q1-Q5 0.3650
15
inflation beta to hedge future inflation which was not found in the previous research by Ang, Brière, & Signori (2012).
Inclusion of inflation beta factor in ex post portfolio showed a negative relationship between inflation beta and portfolio return. Based on the ex post portfolio result, portfolio which was consisted of equities with lower inflation beta tend to have higher return (Duarte, 2010). This was due to the high risk high return principles because lower inflation beta means higher inflation risk and higher risk results in higher return. Furthermore, portfolio with higher inflation beta also had better performance in general. This was shown by high sharpe ratio value of the high inflation beta portfolio. In contrast with ex post result, ex ante result advocated that inflation beta approach did not ensure promising return and good performance in the future. This was due to the inflation beta is only measurement of inflation hedging which ignored growth prospect of the equity.
Comparison between ex post and ex ante portfolio strongly suggests that portfolio that constructed by using past historical data does not guarantee same result will be happened in the future. The return of ex ante portfolio strongly suggest that inflation beta approach does not guarantee a promising return in the future. Moreover, inflation beta approach also does not assure lower total risk of the portfolio. However, inflation beta approach still proven to be effective to hedge future inflation and reduces systematic risk in the portfolio which was shown by a quite robust result of the inflation beta and market beta of the ex ante portfolio.
Managerial and Policy Implication
16 References
Alliya, A. (2012, August 29). Tambang Grup Bakrie di Ambang Kebangkrutan? Retrieved
May 12, 2014, from Detik Finance Website:
http://finance.detik.com/read/2012/08/29/104829/2001825/6/tambang-grup-bakrie-di-ambang-kebangkrutan
Ang, A., Brière, M., & Signori, O. (2012). Inflation and Individual Equities. Financial Analysts Journal , 36-55.
Bambang. (2011, Januari 3). Inflasi 2010 capai 6.96%. Retrieved April 16, 2014, from Antara News Website: http://www.antaranews.com/berita/240341/inflasi-2010-capai-696-persen
Bekaert, G., & Wang, X. (2010). Inflation risk and the inflation. 752-806.
Bellman, E., & Santana, I. M. (2013, April 3). Bumi Resources Posts Largest-Ever Loss. Retrieved May 12, 2014, from Wall Street Journal Website: http://online.wsj.com/news/articles/SB1000142412788732410090457840048093799 9930
Berk, J., & DeMarzo, P. (2013). Corporate Finance. In J. Berk, & P. DeMarzo, Corporate Finance 3rd Edition.
Blake, C. (n.d.). Electronic Resources: Fordham University. Retrieved April 22, 2014, from Fordham University Website: http://www.library.fordham.edu/
Bodie, Z., & Kane, A. M. (1992). Essential of Investments 6th Edition. McGraw Hill.
Bond, M. T., & Rubens, J. H. (n.d.). Inflation Hedging Through International Portfolio Management. Journal of Applied Business Research , 107-111.
Boudoukh, J., & Richardson, M. (1992). Stocks Are A Good Hedges for Inflation. 1-14.
Bruno, S. C. (n.d.). A Multi Assets Approach to Inflation Hedging for U.S Investors.
Bruno, S., & Chincarini, L. (2011). A Multy Assets Approach to Inflation Hedging for a U.S Investor. Journal of Portfolio Management , 102-115.
Duarte, F. M. (2010). Inflation and The Cross Section of Stock Return.
Economics Online. (n.d.). Inflation. Retrieved February 28, 2014, from Economics Online: http://www.economicsonline.co.uk/Global_economics/Inflation.html
Fama, E. F., & Schwert, G. (1977). Assets Returns and Inflation. Journal of Financial Economics , 115-146.
Ganesan, S., & Chiang, Y. H. (1998). The Inflation-Hedging Characteristics of Real and Financial Assets in Hong Kong. Journal of Real Estate Portfolio Management , 55-67.
17
Hewitt EnnisKnupp. (2012, June). Inflation and Real Return. Retrieved May 2014, 12, from
Hewitt EnnisKnupp Website:
https://ctech.rproxy.hewitt.com/hig/filehandler.ashx?fileid=7018
Hida, R. E. (2012, January 2). BPS: Inflasi 2011 Sebesar 3,79%. Retrieved April 17, 2014,
from Detik Finance Website:
http://finance.detik.com/read/2012/01/02/111624/1804509/4/bps-inflasi-2011-sebesar-379
Hoesli, M., Lizier, C., & MacGregor, B. (2008). The Inflation Hedging Characteristics of US and UK Investments: A Multi-Factor Error Correction Approach. Journal of Real Estate Financial Economics , 183-206.
Hofschire, D., Carlson, K., & Bewick, J. (2013). Why Managing Inflation Risk Still Matters: A Multi Assets Approach. investment insights .
Indonesia Stock Exchange. (n.d.). FAQS. Retrieved 4 16, 2014, from Indonesia Stock Exchange Web Site: http://www.idx.co.id/id-id/beranda/faq.aspx
Info Bank. (2011, October 3). Saham Bank Mega Anjlok . Retrieved May 13, 2014, from Info Bank News: http://www.infobanknews.com/2011/10/saham-bank-mega-anjlok-hingga-2286/
Investopedia. (n.d.). Definition of 'Ex-Ante'. Retrieved 2 24, 2014, from Investopedia: http://www.investopedia.com/terms/e/exante.asp
Investopedia. (n.d.). Definition of 'Ex-Post'. Retrieved 2 24, 2014, from Investopedia: http://www.investopedia.com/terms/e/expost.asp
Investopedia. (n.d.). Stock. Retrieved 4 7, 2014, from Investopedia: http://www.investopedia.com/terms/s/stock.asp
Investor Daily Indonesia. (2012, March 3). Realisasi Inflasi 2011 Hanya 3,79%. Retrieved April 17, 2014, from Investor Daily Indonesia Website: http://www.investor.co.id/home/realisasi-inflasi-2011-hanya-379/27275
Jones, C. P. (2002). Investments. Berkeley: John Wiley& Sons, Inc.
Kinerja Bursa Saham RI Terbaik Kedua di Dunia. (2013, April 1). Retrieved February 28, 2014, from Liputan 6: http://bisnis.liputan6.com/read/549330/kinerja-bursa-saham-ri-terbaik-kedua-di-dunia
Krämer, W. (2012). Equity Investments as a Hedge against Inflation part 2. Investment Research , 1-7.
Lavinda. (2011, December 1). Inflasi Rendah Karena Efek Krisis Global. Retrieved April 16, 2014, from Bisnis.com: http://finansial.bisnis.com/read/20111201/9/55135/inflasi-rendah-karena-efek-krisis-global
18
Parlindungan. (2013, January 3). Inflasi 2012 Rendah, Ini Dia Penyebabnya. Retrieved April 17, 2014, from Riau Bisnis Web site: http://riaubisnis.com/index.php/business-mainmenu-29/bisnis-mainmenu-43/5970-inflasi-2012-renda-ini-dia-penyebabnya
Ruff, J., & Vince, C. (2011). Fighting the Next Battle:Redefining the Inflation-Protected Portfolio. The Journal of Portfolio Management , 85-101.
Sekaran, U. (2003). Research Method for Business A Skill Building Approach. New York: John Wiley & Sons, Inc.
Sing, T.-F., & Low, S.-H. Y. (2000). The inflation-hedging characteristics of real estate and financial assets in Singapore. Journal of Real Estate Portfolio Management , 373-385.
Spierdijk, L., & Umar, Z. (2011). Stocks, Bonds, T-bills and Inflation Hedging. 1-52.
Viva News. (2010, January 4). 2009 Inflasi 2,78%, Terendah dalam Sejarah RI. Retrieved
April 16, 2014, from Viva News Web Site:
http://bisnis.news.viva.co.id/news/read/1182782009_inflasi_2_78___terendah_dalam _sejarah.