Using Multivariate Analysis of Variance algorithm in Keystroke Identification
M. Analoui
1, A. Mirzaei
2,H. Davarpanah
31-Ass. Professor, Computer Eng. Dept., IUST, Tehran, Iran,
analoui@iust.ac.ir
2- Graduate student, Computer Eng. Dept., IUST, Tehran, Iran,
ab_mirzaei@iust.ac.ir
3- Graduate student, Computer Eng. Dept., IUST, Tehran, Iran,
davarpanah@iust.ac.ir
Abstract
This paper presents the use of Multivariate Analysis of Variance method in Keystroke identification. The proposed method produces a new feature set from the original measured futures. There are two major advantages in the new feature set. First: the size of feature set is very small comparing to the original features. Second: the new features will be orthogonal.
We apply a Nearest Neighbor algorithm to identify the users. Although this algorithm is fast and less complex than the other classification algorithm, the results are extremely well.
Multivariate Analysis of Variance (MANOVA) is an algorithm that is usually used for canonical analysis. It looks for a linear combination of an original variable set that has the largest separation between groups. The algorithm produces orthogonal features and therefore the correlation effect in distance measure is reduced.
Keywords
:
Keystroke, Identification,Multivariate Analysis of Variance, Nearest Neighborhood algorithm
1.
Introduction
Securing computer network and management of access to information plays an important role in planning and designing a new system. If we limit the entrance of the users , who have not permission to use it, we can hope to have a safe system. We can categorize useful metrics for user recognition in three groups:
• What user enters into system for introducing his/her –self, such as username, password, PIN code, and so on.
• What user offers into system to access the system, such as Card, Token, and so on.
• What the user is: that is the user’s voice, figure print, eye retina, and so on.
Two first groups have the characteristic to be transferred to others (voluntary or involuntary). The third one, due to the lack of portability, is the strongest metric in spite of its high imple mentation cost. The typing identification systems are categorized in the third group .This system has two main advantages compared with other biometric systems . The keyboard is the default input devise, so the identification process doesn't need new tools .Moreover the user's characteristics can be measured during entire interaction of users with the system.
Discussion with regard user recognition is
divided into user verification and user
identification. In user verification we try to
identify that the entered user it truly the same
person as he/she has claimed, so that output of
the system would be true or false. In user
identification we want to determine which
person enters to the system. Several researches
have been carried out in user verification
context. In these cases, features are extracted
from login name and password. [1-6] used
statistical methods and their final accuracy was
97%. [4] assumed a normal probability
distribution function for features. In, [7] [8]
fuzzy logic is used for user verification. In these
studies typing difficulty was used as one feature
and in it the error rates reached about 7% to 9%.
Also some of Neural Network architectures
have been used and reached to the best results
[9] [10].
by using hybrid method, and was 2% error
type1 (probability of being rejected when
the user is valid) and 6% error type 2 (
probability of being accepted when the user
is invalid) .In [12] the performance of both
artificial neural networks and k- nearest
neighbor as possible classifier for this
purpose were studied and reached to
15.37%,1% error for type1 and 1.03% ,29%
error for type 2 according to KNN and ANN
methods . Reference [13] ,using KNN and
AR coefficients as feature, reached to
accuracy of 63.66%.In the field of user
identification no attempt has been made. In
identification features are derived from the
typed text. The text is either free text or
structured text. The free text is what he/she
type in each program, but structured text is a
special phrase which user must type.
Keydown time, Keyup time, Key hold time (duration), inter-key t ime (latency), typing speed, Key pressing strength, typing difficulty and so on are among the features that can be used in pattern recognition process. The keydown time , the key up time, the key holding time, the inter-key time and the typing speed can be measured using ordinary keyboards and very simple and fast software, but special keyboard is necessary for the measurement of the key pressing strength
Previous studies show that it is very important to search for new features to recognize the different person's keystrokes .In this research, we found new features by linear combination of primary features. Final user identification was performed by NN algorithm on this new feature space.
2. Feature Extraction
Bad feature can limit the performance of the system so feature extraction is a critical phase in classifier design.
We used four features which are listed below: 1.Key down time.
2.Key up time.
3.Key hold time or duration 4.inter key time or latency
Let’s assume the training set is a collection made of fixed string with P-character length, we will have an P dimensional vector for Keydown time, P dimensional vector for Keyup time, P dimensional vector for duration and P –1 dimensional vector for
latency. If there are M persons that typed one fixed string in the training set, we have one observation matrix with M*(4P-1) members that will be used as input data for following algorithm. We can use some of the best features that are results of MANOVA algorithm so reducing dimensions and limiting similar features. After this stage the observation matrix will have M*K members.
Algorithm
This algorithm is based on MANOVA . MANOVA is used for canonical analysis as we look for the linear combination of the original variables that has the largest separation between groups. Having found that combination, we next look for the combination with the second highest separation, and so on. This method produces orthogonal features so in the calculation of distance between features it is not necessary to consider the correlation between them
Let’s
X
N*M be the observation matrix. Ro ws refer to users typing samples and column s represent the mentioned features.I. Normalize the feature to zero mean.
m old m
m
X
X
X
=
−
for m=1…M (1)where
X
m is mth feature (column)II. Compute Total sum of squares matrix T T=
X
Τ*X (2) WhereX
Τ is the transposed of XIII. Compute Within-groups sum of squares W a) Create
W
M*M =0b) If Z be the matrix of instances of class j, normalize its features to zero mean.
Z
m=
Z
mold−
Z
m for m=1…M (3)where
Z
m is mth feature of class jc)
W
=
W
old+
Z
Τ*
Z
(4) d) Repeat b and c for all classesIV. Compute Between-groups sum of squares matrix B
B = T-W (5) V. Calculate the eigenvec and eigenval using (6, 7).
eigenvec is a matrix which defines the coefficients of the linear combinations of the original variables. The eigenval is a vector measuring the ratio of the between-group variance to the within-group variance for the corresponding linear combination.
Each column is a linear combination of the mean-centered original variables, using coefficients from the eigenvec matrix.
eigenvec= eigen vectors of
W
−1B
(7) VI. Sort eigenvec with respect to eigenval indescending order and choose K greater of them. So the eigenvec will be a matrix of M*K dimensional is chosen heuristically through experiments, such that the first K largest eigenvalues are conspicuously greater than the rest of other. Fig.1 is a typical example of an eigenvalue distribution.
VII. Use the eigenvec to project training sample to new domain
K * M old
eigenvec
*
X
X
=
(8)Assumptions
This algorithm makes the following assumptions about the data in X:
• The populations for each group are normally distributed.
• The variance-covariance matrix is the same for each population.
• All observations are mutually independent.
Figure 1.Typical Eigenvalue distribution
3. User Identification
Output of prior section is eigenvec matrix that will be used to project new instances with M feature to new domain with K dimensions .suppose
x
be the feature vector of new user, we haveK * M *
1 *
1K
x
M*
eigenvec
x
=
Now we should determine the class that this instance belongs to. To do this we used nearest neighbor algorithm; In the other hand we classify the new sample as a member of the known class if its position is near the locus of that training sample set else if this distance is greater than a threshold, the user is identified as unknown.
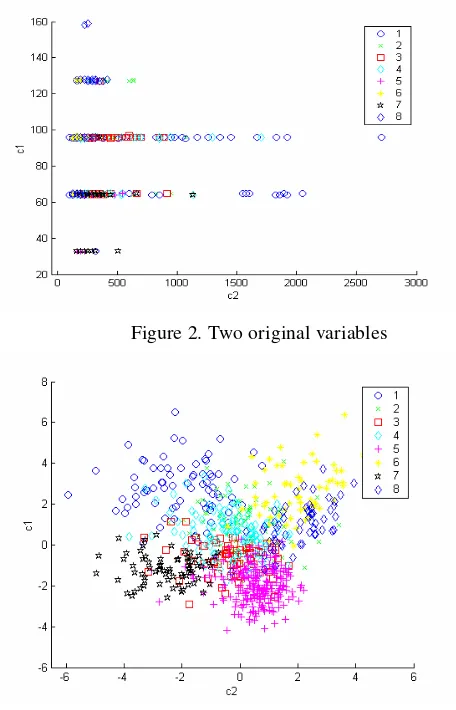
Below figures shows that the first two canonical variables produce more separation between groups than any pair of original variables.
Figure 2. Two original variables
Figure 3. First two canonical variables
4. Experiments and Results
Experiments were done using the keystroke pattern from eight users gathered in ten weeks time. We asked users to type a constant text “This is a Test”. This process has been done at least twice a day with hours of delay between them. Using this method it seems that the mental effects of users in different situation will be included in the gathered typing pattern. Users were able to enter the sentence in each time as many as they want.
The users typed the sentence totally 1509 times. To achieve more accurate classifier, we studied the result of the nearest neighbor classifier under following conditions. We have used 10, 25 and 50 percent of samples as the test set and the rest of data as the training samples.
1-
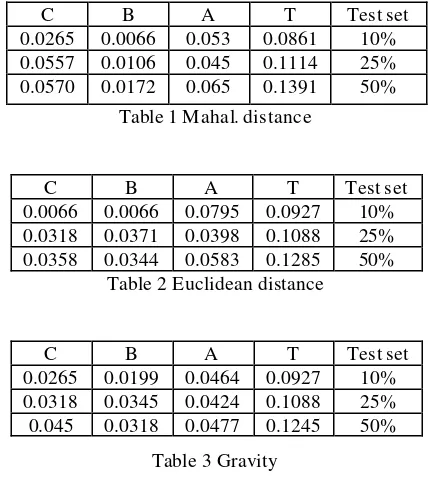
The Mahalanobis distance is calculated in a 1-nearest neighbor scheme. The results of classifier are shown in table 1.2-
The Euclidean distance is calculated in a 1-nearest neighbor scheme. The results are shown in table 2.3-
The Euclidean distance is calculated between each sample and the gravity center of the classes in a 1-nearest neighbor scheme. The results are shown in table 3.Test set T A B C 10% 0.0861 0.053 0.0066 0.0265 25% 0.1114 0.045 0.0106 0.0557 50% 0.1391 0.065 0.0172 0.0570
Table 1 Mahal. distance
Test set T A B C 10% 0.0927 0.0795 0.0066 0.0066 25% 0.1088 0.0398 0.0371 0.0318 50% 0.1285 0.0583 0.0344 0.0358
Table 2 Euclidean distance
Test set T A B C 10% 0.0927 0.0464 0.0199 0.0265 25% 0.1088 0.0424 0.0345 0.0318 50% 0.1245 0.0477 0.0318 0.045
Table 3 Gravity
The nomenclature we used is as follows: T= Total error rate
A= Error rate that a good user identified as other good user.
B= Error rate that a good user identified as bad user C= Error rate that a bad user identified as good user 10 % means TR=1358
Tst=151 25% means TR=1132 Tst=377 50 % means TR=754 Tst=755
The resulting tables show that using different distance metrics has no effect on the total error rate but the distribution of error type is affected. We have observed that the performance of the Mahalanobis distance is enhanced more then the other distances when the size of the training set is concerned.
We used quarter of training samples of each class (which were not used in feature enhancement) to calculate the threshold level by measuring distance between them and the samples of other classes.
5. Conclusion
We have developed and studied an identifier system that is highly accurate and fast. It uses small feature size in which the feature members are orthogonal. Therefore the identifier is faster than the other methods. Moreover using the best selection of the features leads to a highly accurate identifier.
6. References
[1] A.A. Kaji and M. Analoui, “Computer Network-Access Sequrity using Keystroke Dynamics, a covariance-covariance Approach”, proceedings of IST step, 1-3, 2001, Tehran, PP.662-625.
[2] A.A. Kaji and M. Analoui, “Keystroke Authentication Based on Statistical Approach and Chaining Input Device for Network Application”, proceedings of PDPAA’ 20001, June 25-28, 2001, LAS Vegas, Nevada, USA, PP 766-771.
[3] R. Joyce and Gupta, “Identify Authentication Based on Keystroke Latencies”, Communications of the ACM, vol. 33, Feb. 1990.
[4] S. Bleha, C. Slivinsky, B. Hussein,”Computer – Access Sequrity System Using Keystroke Dynamics”, IEEE Trans. On Pattern Analysis and Machine Intelligence, pp.1217, 1990.
[5] S. Bleha, “Computer User Identification Using the Mean and The Median as Features”, IEEE, ISSN#0-7803-4778-1/98, pp.4379, 1998.
[6] John A. Robinson, Vinchy M. Ling, J. A. Michael Chambers. Christine L. Macken zie, “Computer User Identification using login string keystroke dynamics”, IEEE transaction o systems man and cybernetics, part A: systems and human, November 1997
[8] Marrinio Tapiador and Juan A. Siguenza, “Fuzzy Keystroke biometrics on web sequrity”, university Autonoma Madrid, 1999.
[9] M.S. Obaidat and Balqies Sadoun, “Verification of computer users using keystroke dynamics”, IEEE Transactions on systems, man and cybernetics, part B: cybernetics, vol. 27, No. 2, April 1997.
[10] D. T. Lin,”Computer–Access Authentication with Neural Network Based Keystroke Identity verification”, IEEE, ISSN#0-7803-4122-8/97, pp.174, 1997.
[11] Haider, S.; Abbas, A.; Zaidi, A.K.;”A multi-technique approach for user identification through keystroke dynamics”, Systems, Man, and Cybernetics, IEEE 2000, Vol. 2, Page(s): 1336 -1341
[12] Fadhli Wong Mohd Hasan Wong,”Enhanced user authentication through typing biometrics with artificial neural networks and k-nearest neighbor algorithm”, Signals, Systems and Computers, IEEE 2001, Page(s): 911-915, vol.2.