FAKTOR-FAKTOR YANG MEMPENGARUHI ADOPSI
PETANI PADI PADA TEKNOLOGI PENGENDALIAN
HAMA TERPADU
( Kasus Di Kecamatan Chedi Hak, Provinsi Ratchaburi
)
SKRIPSI
Oleh:
Dian Galuh Pratita NIM. 111510601067
P R O G R A M S T U D I A G R I B I S N I S F A K U L T A S P E R T A N I A N
i
FAKTOR-FAKTOR YANG MEMPENGARUHI ADOPSI
PETANI PADI PADA TEKNOLOGI PENGENDALIAN
HAMA TERPADU
( Kasus Di Kecamatan Chedi Hak, Provinsi Ratchaburi
)
SKRIPSI
Diajukan Guna Memenuhi Salah Satu Persyaratan untuk Menyelesaikan Program Sarjana pada Program Studi Agribisnis Fakultas Pertanian
Universitas Jember
Oleh:
Dian Galuh Pratita NIM. 111510601067
P R O G R A M S T U D I A G R I B I S N I S F A K U L T A S P E R T A N I A N
ii
FACTORS AFFECTING RICE FARMER’S ADOPTION
IN INTEGRATED PEST MANAGEMENT TECHNOLOGY:
(A Study Of Chedi Hak Subdistrict, Ratchaburi Province)
By:
DIAN GALUH PRATITA 5620000044
Submitted to:
Assoc. Prof. Dr. Am On Aungsuratana
DEPARTMENT OF AGRICULTURAL EXTENSIONAND COMMUNICATION FACULTY OF AGRICULTURE AT KAMPHAENG SAEN
iii
VALIDATION
iv DEDICATION
In the name of Allah SWT, this research has been dedicate for;
1. Beloved parents; Alm. Irfan Boedi Setiawan and Dr. Asrumi, M.Hum. for their support, kindness, and best wishes.
v MOTTO
“Indeed, Allah will not change the condition of a people until they change what is in themselves.”
(QS Ar-Ra’d : 11)
“Success in life is not about luck, it is about managed thoughts, focused attention and deliberate action”
(Trudy Vesotsky)
vi
DECLARATION OF UNDERGRADUATED CANDIDATE
This declaration is made by: Name : Dian Galuh Pratita SID : 111510601067
I declare that this undergraduate thesis entitled “Factors Affecting Rice Farmer’s Adoption In Integrated Pest Management Technology: A Study Of Chedi Hak Subdistrict, Ratchaburi Province” is a true copy of my thesis, including any final revisions as approved by my thesis committee and that this thesis has not been submitted for a higher degree to any other University or Institution.
Jember, June 2015 Author,
vii
UNDERGRADUATED THESIS
FACTORS AFFECTING RICE FARMER’S ADOPTION
IN INTEGRATED PEST MANAGEMENT TECHNOLOGY: A CASE STUDY OF CHEDI HAK SUBDISTRICT,
RATCHABURI PROVINCE
By:
Dian Galuh Pratita SID. 111510601067
Advisors from Thailand
(Kasetsart University Kamphaeng Saen Campus)
Research Supervisor : Assoc. Prof. Dr. Am-On Aungsuratana Research Co-Advisor : Dr. Rapee Dokmaithes
Research Co-Advisor from Indonesia (Jember University)
Research Co-Advisor 1 : Ir. Anik Suwandari, MP. NIP 196404281990022001
viii
PENGESAHAN
Skripsi berjudul “Factors Affecting Rice Farmer’s Adoption In Integrated Pest Management Technology (A Case Study Of Chedi Hak Subdistrict, Ratchaburi Province)” telah diuji dan disahkan pada:
Hari : Senin
Tanggal : 25 Mei 2015
Tempat : Fakultas Pertanian Universitas Jember
Dosen Penguji 1,
Ir. Anik Suwandari, MP. NIP 196404281990022001
Dosen Penguji 2,
Dr. Ir. Joni Murti Mulyo Aji,M.Rur.M NIP 197006261994031002
Dosen Penguji 3,
Ebban Bagus Kuntadi, SP., M.Sc. NIP 198002202006041002
Dosen Penguji 4,
Dr. Triana Dewi Hapsari, SP., MP. NIP 197104151997022001
Mengetahui, Dekan,
ix SUMMARY
Factors Affecting Rice Farmer’s Adoption in Integrated Pest Management Technology: Study of Chedi Hak Subdistrict, Ratchaburi Province, Dian Galuh Pratita, 111510601067, Agribusiness Study Program, Department Of Agriculture Social Economics,Faculty of Agriculture University of Jember.
Food security and sustainable agriculture is one important point in Thailand agricultural development. Thailand has great amount on pesticide consumption as agricultural input. To achieve the good sustainable agriculture, Thailand adopt the IPM technology as the advanced technology. The study focused on analyzing and identifying factors affecting adoption of technology dissemination (IPM). The main focus in this investigation is to determine factors affecting rice farmers in IPM technology adoption. The main idea of research is to deliver a number of possible policy implications and recommendation for productivity improvement, income generation and higher standard of living of rice cultivators towards self sufficiency and sustainability of rice in Thailand.
x
The findings generated recommendations for rice production policy measures that focused in four dimension including policy orientation by research and development on redesign IPM technology, implementation oriented by promotion IPM in the mass media, academic orientation by providing , and public orientation by concerning in quality and safety of product.
xi RINGKASAN
Factors Affecting Rice Farmer’s Adoption In Integrated Pest Management Technology: A Study Of Chedi Hak Subdistrict, Ratchaburi Province, Dian Galuh Pratita, 111510601067, Program Studi Agribisnis, Jurusan Sosial Ekonomi Pertanian Fakultas Pertanian Universitas Jember.
Ketahanan pangan dan pertanian berkelanjutan meruapakan hal penting dalam perkembangan sektor pertanian di Thailand. Thailand dalam perkembangan sektor pertaniannya, telah mengkonsumsi pestisida dalam jumlah besar. Untuk mencapai kondisi pertanian berkelanjutan yang lebih baik, Thailand mencoba mengadopsi teknologi Pengendalian Hama Terpadu atau IPM (Integrated Pest Management). Penelitian ini berfokus pada analisa dan identifikasi faktor-faktor
yang mempengaruhi adopsi Pengendalian Hama Terpadu. Fokus utama dalam karya ilmiah ini adalah untuk memberikan sejumlah implikasi kebijakan dan saran untuk peningkatan produktivitas, penghasilan, peningkatan kualitas hidup petani padi dalam rangka pencapaian swasembada beras di Thailand.
Data dalam penelitian ini berasal dari satu petani sukses di Kecamatan Chedi Hak, Kabupaten Mueang Ratchaburi, Provinsi Ratchaburi. Sample dipilih menggunakan metode purposive sampling (jugmental sampling) mencakup petani, penyuluh pertanian, dan stakeholder. Survey item yang digunakan dalam penelitian ini adalah wawancara mendalam dalam bentuk SWOT dan matriks. Analisis deskriptif kuantitatif digunakan untuk menjelaskan kondisi ekologi, latar belakang petani, faktor-faktor yang mempengaruhi adopsi PHT, dan KAP dari PHT.
Hasil dari penelitian ini ditemukan bahwa petani tersebut memliki tingkat penerimaan yang tinggi dari model PHT (prevention, monitoring, identification, pest action, and evaluation). Terdapat beberapa faktor yang mempengaruhi adopsi
xii
xiii
ACKNOWLEDGEMENT
All praises to Allah for the strengths and blessing in completing this undergraduate entitled “Factors Affecting Rice Farmer’s Adoption in Integrated Pest Management Technology: A Case Study of Ratchaburi Province, Ratchaburi Province”. This research has been done as one of completing study in Undergraduate Program in Agribusiness Study Program, Faculty of Agriculture, Jember University. I would like to thanks and express my appreciation to;
1. Dr. Ir. Jani Januar, MT., as the Dean on Faculty of Agriculture, Jember University.
2. Dr. Ir. Joni Murti Mulyo Aji, M. Rur. M., as the Head of Agribusiness Study Program, Faculty of Agriculture, Jember University.
3. Ir. Anik Suwandari, MP., and Dr. Ir. Joni Murti Mulyo Aji, M.Rur. M., as The Research Co-Advisor, Ebban Baus Kuntadi, SP., MP., and Dr. Triana Dewi Hapsari, SP., MP., as examine committee for their kindness and suggestion on this undergraduate thesis.
4. Ir. Anik Suwandari, MP., as academic advisor for her kindness and motivation during my study.
5. Beloved parent, for my dad: Alm. Irfan Boedi Setiawan and my mom: Dr. Asrumi, and my younger brother: Firnanda Pulung Wibowo for all of their motivation, support, and encourage with their best wishes.
6. Associate Prof. Am-On Aungsuratana as The Research Supervisor and Dr. Rapee Dokmaithes as The Research Co-Advisor in Agricultural Extension and Communication Department, Faculty of Agriculture, Kasetsart University, for their excellent guidance, caring, patience, and providing me with an excellent atmosphere for doing research in Thailand.
xiv
8. My best friends ; Dinda Dewanti, Maya Dewi Maharani, Loriza Gevi Anggasasi, Akhmad Wasis Brillianto, Andika Lussy Ayu Wulandari, Puji Agustin, Sheilla Anandyta Ramadhanti, Rahmat Budiarto, Amirudin Akhmad Fauzi, Argya Narendra, and Dimas Handi Putranto for supporting me in this research.
9. The extension officer (Pi Mew) and the progressive farmer (Ajharn Walit) as the respondent for their fully support and cooperating during data collections. 10. All students of Agribusiness Study Program’” 11 (Agb”11) for their support
and encouragement
The author realizes that this research is far from perfect. Therefore, it needs some suggestions and recommendation. Hopefully this research can be useful for readers.
xv
TABLE OF CONTENTS
Page
COVER (INDONESIA) ... i
COVER (THAILAND) ... ii
VALIDATION ... iii
DEDICATION ... iiv
MOTTO ... v
DECLARATION OF UNDERGRADUATED CANDIDATE ... vi
PENGESAHAN ... Error! Bookmark not defined. SUMMARY ... iError! Bookmark not defined. RINGKASAN ... xiii TABLE OF CONTENTS ... xv
LIST OF TABLES ... xix
LIST OF FIGURES ... xx
LIST OF APPENDICES ... xxi
CHAPTER 1 INTRODUCTION ... 1
1.1 Statement of the Problems ... 1
1.2 Research Questions ... 3
1.3 Objectives of Study and Expected Results ... 4
1.3.1 Objectives of Study ... 4
1.3.2 Expected Results ... 4
CHAPTER 2. LITERATURE REVIEW ... 5
2.1 Sustainable Agriculture ... 5
xvi
2.1.2 Concept of Sustainable Agriculture ... 6
2.2 Environmental Degradation ... 8
2.2.1 Concept of Environmental Degradation... 8
2.2.2 Environmental Impact of Pesticides Use ... 8
2.3 Integrated Pest Management (IPM) ... 10
2.3.1 Definition of Integrated Pest Management (IPM) . 10 2.3.2 Concept of IPM Technology ... 11
2.3.3 Principles of IPM Technology ... 12
2.3.4 Economic Injury Level (EIL) ... 13
2.3.5 Economic Threshold (ET) ... 14
2.3.6 Technique of Integrated Pest Management (IPM) . 16 2.3.7 IPM in Thailand ... 18
2.3.8 Factor adoption in Integrated Pest Management (IPM) Technology ... 20
2.3.9 Constraints in Adoption IPM Technology ... 21
2.3.1 IPM Strategy ... 23
2.4 Rice Production in Thailand... 23
2.5 Adoption Innovation ... 27
2.5.1 Main Elements in the Diffusion of Innovations ... 27
2.5.2 The innovation-Decision Process ... 28
2.5.3 Attributes and Rate Adoption Theory ... 29
2.5.4 Adopter Categorize Theory ... 30
2.5.5 Farmer’s Socio Economic Characteristics ... 31
2.6 Conceptual Framework ... 33
2.7 Research Hypothesis ... 34
2.8 Structure of Hypothesis ... 35
CHAPTER 3 RESEARCH METHODOLOGY ... 36
3.1 Population and Sampling Technique ... 36
3.2 Data Collection... 36
xvii
3.4 Operation Definition ... 39
CHAPTER 4 RESULT AND DISCUSION ... 44
4.1 The Study Area and Its Vicinity... 44
4.1.1 Location and Boundaries ... 44
4.1.2 Geography ... 45
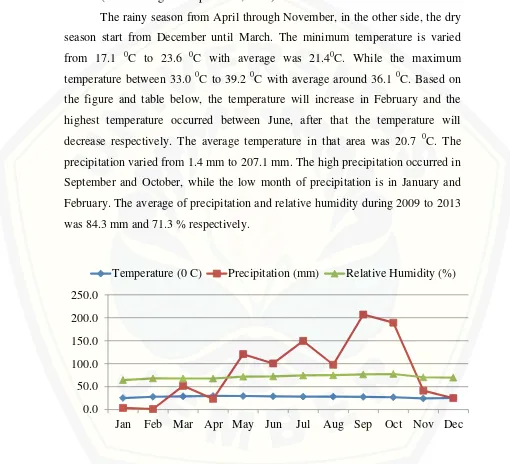
4.1.3 Climate ... 46
4.1.4 Surface Hydrology ... 48
4.1.5 Soil Suitability for Rice ... 48
4.2 Personal Background and Socio Characteristic ... 50
4.3 Rate of Knowledge, Attitude, and Practice ... 52
4.3.1 Knowledge on IPM Technology ... 52
4.3.2 Attitude on IPM Technology ... 53
4.3.3 Practices on IPM Technology ... 53
4.3.4 Comparison between Knowledge and Practices .... 54
4.4 Factors Affecting Adoption of IPM Technology in Chedi Hak Subdistrict ... 56
4.4.1 Personal Background ... 56
4.4.2 Input Used Factors ... 57
4.4.3 Physical Factors ... 57
4.4.4 Biological Factors ... 57
4.4.5 Social Factors ... 58
4.4.6 Economic factors ... 58
4.4.7 Institutional Factors ... 59
4.4.8 Psychological Factors... 59
4.5 Constraint and Recommendation of Adoption in IPM Technology ... 62
4.5.1 Personal constraint ... 62
4.5.2 Biological constraint ... 63
xviii
CHAPTER 5 CONCLUSION AND RECOMMENDATION ... 66
5.1 Conclusion ... 66
5.2 Recommendation... 67
LITERATURE CITED ... 69
xix
LIST OF TABLES
No Title Page
2.1 The fifth biggest rice producer countries in 2012 ... 24
2.2 Thailand export quantity in 2007-2011 ... 24
2.3 Thailand total area, production, and yield of rice in 2008-2012 ... 24
2.4 Central plain total rice production in 2008-2012 ... 25
2.5 Ratchaburi total rice production in 2008-2012 ... 25
4.1 Average Maximum, Minimum, Precipitation, and Relative Humidity in Ratchaburi Province, during 2009-2013 ... 47
4.2 Temperature, Precipitation, and relative humidity in Ratchaburi Province, central Thailand in 2013 ... 47
4.3 Distribution of knowledge towards IPM technology procedures ... 52
4.4 Distribution of respondent attitude on the IPM technology ... 52
4.5 Distribution of practices on IPM technology... 52
4.6 Adoption of IPM technology ... 54
4.7 Comparison between knowledge and practice in IPM technology ... 55
4.8 Factors affecting rice farmers adoption of IPM technology ... 61
4.9 Constraint on adoption IPM technology ... 64
4.10 Recommendation on IPM technology dissemination ... 64
xx
LIST OF FIGURES
No Title Page
2.1 The economic injury concept ... 14
2.2 Linear and threshold damage relationship ... 16
2.3 Model of five stages in the innovation decision process ... 28
2.4 Five categories adopter in adoption technology ... 30
2.5 Conceptual Framework ... 33
2.6 Structure of testing hypotheses ... 35
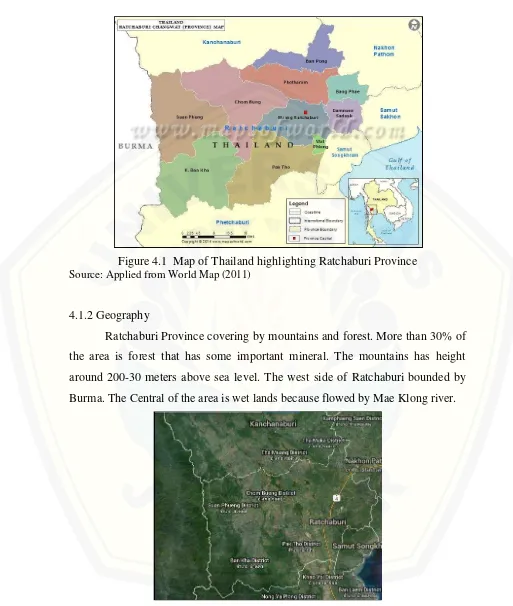
4.1 Map of Thailand highlighting Ratchaburi Province ... 45
4.2 Topographic map of Ratchaburi Province and its vicinity ... 45
4.3 Temperature, Rainfall, and Relative Humidity in Ratchaburi Province, Central Thailand during 2009-2013... 46
4.4 Ratchaburi City Map ... 48
4.5 Soil Suitability of Rice in Ratchaburi Province, 2014 ... 49
4.6 Soil suitability of rice in Mueang Ratchaburi Province or Amphoe Mueang ... 49
xxi
LIST OF APPENDICES
No Title Page
CHAPTER 1. INTRODUCTION
1.1 Statement of the Problems
Food and Agricultural Organization [FAO] (2013c, 2013f) reported that rice is the biggest commodity in terms of production in the world. In 2009, world rice production recorded 456,8 million tons of milled rice and in 2011 increase to 481,2 million tons. These rice production based on 163 million ha area harvest in the world. The average of world yield is currently 4.8 tons per ha. It has increase from 2009 respectively. Asia is the biggest region in rice production, accounting for 435 million tons of milled rice production in 2011. It based on 145.2 million hectares rice harvest area. Rice is an important commodity in the world, because of rice is a major food staple and a mainstay for the rural population and for household food security. Asia have an important roles in world rice condition, because of 90% of world rice production comes from Asia. Rice is considered as a “strategic “ commodity in many countries both developed and developing and has consequently remained subject to a wide range of government controls and interventions.
Thailand is agricultural country, with total population growth up to 0,3 % until 2012. The increasing of total population not related with total employment in agricultural sector. In 2008 total employment in agriculture about 43% of total population, in 2009 it decreased became 39% respectively. Rice is the most important staple crop for Thailand because 65 % of farmer belonging in rice farming. Rice is the important commodity in Thailand, not only as a staple food but also as export commodity (FAO, 2013d).
International Rice Research Institution [IRRI] (2013) reported that there was increasing in Thailand milled rice production from 2000 until 2011. In 2000 Thailand rice milled production was around of 17.229,27 tons and increased 24.2 % in 2009 (21.410,73 tons). In addition, consumption of milled rice has increased to approximately 24.3 % in 2009 from 10.436 tons in 2000 to 12.969 tons. It can be seen that percentage of increasing in production and consumption is equal.
Increasing in rice consumption and rice production become the factor of increasing in pesticides use in Thailand. Mostly pesticides in Thailand is imported product, and increased every year. Paneat (2012) pointed that total imported pesticides in Thailand increased every year. In 2000, quantity of pesticides import less of 40.000 tons, in 2010 quantity of pesticides import was 120.000 ton. It can be seen that Thailand’s pesticides imports was extremely increase.
According to Tapintha (1998), pesticides (including insecticides, herbicides, and fungicides) are used widely in modern agriculture. These chemical compounds are used by farmers worldwide to protect crops from insects and mites, weeds and aquatic plants that clog irrigation systems, plant diseases (caused by fungi, bacteria, and viruses), nematodes, snails and slugs, rodents, and birds that consume enormous quantities of seed and grain. Pesticides have been used globally to minimize financial losses and maintain food supplies. Increasing in agricultural production become the main factor of increasing pesticide use.
pesticides use can be indicator of environmental pollution. Regarding the more awareness of food safety among environment and consumer, IPM become one of the advance technology that can provide this point. Kumari (2012) pointed that integrated pest management (IPM) is a systematic approach to pest management that focuses in minimize pest population below economic threshold level (ETL) or keep pest population at an acceptable level in some tactics. Tactics may include cultural, mechanical, biological, and chemical methods of pest management.
Ratchaburi is located 80 kilometers west of Bangkok. Ratchaburi is one province in central of Thailand. Agriculture become the main important of income source in Ratchaburi, which 41,4% of household incomes from agriculture sector. Total land holding in Ratchaburi is currently 21.592.365 rai or 3.454.778,4 ha, of which 39,6% (8.541.412 rai) is rice area. In 2003 rice production recorded 249.000 tons. Considering the use of pesticides, 75% reported using pesticides, of which 71,1 % used chemical pesticides, 5.3% using organic, and 1,3% using natural enemies (National Statistic Organization [NSO], 2003).
Adoption in IPM technologies cannot do in clearly, there are many factors that can affect the decision making of farmers to adopt or not. Therefore, this study focus on determinate factors that affecting rice farmers to adopt IPM technology in study area (Chedi Hak Sub District, Ratchaburi Province, Thailand). In order to form an appropriate strategy and recommendation for designing a model of IPM technology and to enhance adoption among farmers.
1.2 Research Questions
Based on the objective and problem statement, the research question for the study was developed as follow:
1. What kind of factors affecting farmer’s adoption in IPM technology?
1.3 Objectives of Study and Expected Results 1.3.1 Objectives of Study
1. To identify factors affecting farmer’s adoption in IPM Technology namely; a. to obtain and describe the study areas and its vicinity.
b. to obtain and describe basic personal and socio economic background of rice cultivator.
c. to determine rate of farmers knowledge, attitudes, and practices in IPM technology.
d. to investigate and determine factors affecting rice farmer’s adoption in IPM technology.
2. To assess constraints and recommendation in adoption in IPM technology in study area.
1.3.2 Expected Results
CHAPTER 2. LITERATURE REVIEW
2.1 Sustainable Agriculture 2.1.1 The Concept of Food Security
World Health Organization [WHO] (2010a) defined food security as condition when all people at all times, have access to sufficient, safe, nutritious food to maintain a healthy and active life. Commonly, the concept of food security is defined as including both physical and economic access to food that meets people’s dietary needs as well as their food preferences. Food security is built on three pillars; food availability (sufficient quantities of food available on a consistent basis), food access (having sufficient resources to obtain appropriate foods for a nutritious diet), and food use ( appropriate use based on knowledge of basic nutrition and care, as well as adequate water and sanitation).
In addition, United Nations Development Program (UNDP) (2009), explained dimensions of food security that can be split into four components: availability, access, utilization and stability.
1. Food availability: the availability of sufficient quantities of food of appropriate quality, supplied through domestic production or imports (including food aid).
2. Food access: access by individuals to adequate resources (entitlements) for acquiring appropriate foods for a nutritious diet. Entitlements are defined as the set of all commodity bundles over which a person can establish command given the legal, political, economic and social arrangements of the community in which they live (including traditional rights such as access to common resources). 3. Utilization: utilization of food through adequate diet, clean water, sanitation and health care to reach a state of nutritional well being where all physiological needs are met. This brings out the importance of non-food inputs in food security.
food as a consequence of sudden shocks (e.g. an economic or climatic crisis) or cyclical events (e.g. seasonal food insecurity). The concept of stability can therefore refer to both the availability and access dimensions of food security.
Nellman (2009) explained that there are seven option for improving food security. One of these is support farmers in developing diversified and resilient ecoagriculture systems that provide critical ecosystem services (water supply and regulation, habitat for wild plants and animals, genetic diversity, pollination, pest control, climate regulation), as well as adequate food to meet local and consumer needs. This includes managing extreme rainfall and using inter-cropping to minimize dependency on external inputs like artificial fertilizers, pesticides and blue irrigation water and the development, implementation and support of green technology also for small-scale farmers.
2.1.2 The Concept of Sustainable Agriculture
According to FFTC (1992), sustainable agriculture is ecologically stable, conserving the natural resources base to provide for the needs of future generations. Instead of depending on purchased inputs such as chemical fertilizers and pesticides, the sustainable farm makes maximum use of renewable resources that produced on the farm itself. However sustainable agriculture does not mean a return to traditional farming.
United State Department of Agriculture USDA (1999) defined sustainable agriculture means an integrated system of plant and animal production practices having a sit-specific application that over the long terms will; satisfy human food and fiber needs, enhance environmental quality and the natural resource base upon which the agricultural economy depends, make the most efficient use of non renewable resources and on farm resources and integrate where appropriate, sustain the economic viability of farm operations, and enhance the quality of life for farmers and society as a whole.
SAI (2010) state that sustainable agriculture is the efficient production of safe, high quality agricultural products, in a way that protects and improves the natural environment, the social and economic conditions of farmers, their employees and local communities, and safeguards the health and welfare of all farmed species. Therefore there are three principle of sustainable agriculture: economic, social, and environment.
Kentucky University (2012) mentioned that sustainable agriculture can be broken into three components: economic, environmental, and social. (1) Economic profitability can be define that a farm must be economically viable. Fertilizer and pesticide cost are generally reduced on a sustainably managed farm. (2) Environmental sustainability concerns is the central of sustainable agriculture. Sustainable agriculture is frequently described as: ecologically sound practices that have little to negative effect on natural ecosystem. Sustainable agriculture also seeks to have a positive impact on natural resources and wildlife. Renewable natural resources are protected, recycled, and even replaced in sustainable systems. A key to successful sustainable production is healthy soil. Insect, disease, and weeds are managed, rather than controlled, in sustainable systems. The goal is not necessarily the complete elimination of pest but rather to manage pests and diseases to keep crop damage within acceptable economic levels. Sustainable pest management practices emphasizes prevention through good production and cultural methods. (3) Social sustainability relates to the quality of life for those who work and live on the farm, as well as those in the local community. Fair treatment of workers, positive farm family relationships, personal interactions with consumers and choosing to purchase supplies locally.
2.2 Environmental Degradation
2.2.1 The Concept of Environmental Degradation
According to Panayotou (1993), the terms “ environment” refers to both the quantity and quality of natural resources, renewable and nonrenewable. It is also includes the around of environment ,which consists of the landscape, water, air, and the atmosphere and constitutes and essential element of the quality of life. The environment is a critical determsinant of the quantity, quality, and sustainability of human activities and life in general. In addition, environmental degradation is the reduction of the environment in quantity and its deterioration in quality. Environmental pollution is classic case of a public externalities. It originates from variety of source including wastes from agricultural activities such as runoff of excess pesticides and fertilizer.
FAO (2007) indicate that agriculture is often responsible for environmental degradation, such as non-sustainable food production, poor fuel use, natural resource depletion and habitat exploitation. At the same time farmers should be considered as key players in stopping degradation of vital ecosystems. It needs the political will to reverse the degradation of ecosystems through the change of agricultural policies, institutions and practices. Agriculture has to be at the centre stage if we want to preserve an ecological balance on which current and future generations.
Nelleman (2009) state that environmental degradation due to unsustainable human practices and activities endanger the entire production platform of the planet. Land degradation and conversion of crop land for non food production including bio-fuels, cotton and others are major threats that could reduce the available cropland by 8-20% by 2050. Species infestations of pathogens, weeds and insects, combined with water scarcity from overuse and te melting of the Himalayas glaciers.
2.2.2 Environmental Impact of Pesticides Use
many kinds of pesticides. Pesticides also directly travel to soil during spraying, normally in the upper layer, pesticides concentration levels in soil are more higher than in water. Pesticides residues also on agricultural product. It can be transferred directly to human.
In addition, Ping (2004), reported that The Kingdom of Thailand, has faced one of increasingly serious environmental degradation. The problem is intensive farming (pesticide, herbicide, fertilizer, and irrigation). Intensive farming in Northern Thailand is a reality, and this system has been seen as a problem to the environment mainly because of its amount of chemicals used. Farmers use more and more pesticide, herbicide, and fertilizer which through irrigation system into soil, rivers and even groundwater. Intensive rice farming make a heavy pollution with nitrates. Dangerous pesticides applied in farms find their way into rivers and groundwater, and into foods sold in Thai markets.
Greenpeace (2008) reported that around 91% freshwater in Thailand is used for irrigation for the almost 5 million hectares of irrigated agriculture. Due to the high use of agrochemicals in Thailand in the last years, there is a high potential for pollution of water sources through irrigation runoff, return flows, and infiltration. From 1999 to 2001 a survey of three major rivers along paddy fields area includes : Thachin river in Supanburi and Nakhonpathom, the Chao Phraya river in Pathumtani and Nontaburi, and the Bangpakong river in Chachengsao.
WHO (2010b) defined pesticide in any substance or mixture of substance or microorganism including viruses, intended for repelling destroying or controlling any pest, including vectors of human or animal disease, nuisance pests, unwanted species of plants or animal causing harm during production, processing, storage, transport or marketing of food, agricultural commodities.
pesticide use will be curbed by the growing demand for organic crops, produced without chemical inputs. The future is likely to see increasing use of appropriate and proper pesticides, resistant crop varieties and ecological methods of pest control (IPM).
2.3 Integrated Pest Management (IPM)
2.3.1 Definition of Integrated Pest Management (IPM)
According to Dagupsta (2004), IPM is intended to reduce ecological and health damage from chemical pesticides by using natural parasites and predators to control pest populations. Since chemical pesticides are expensive for poor farmers, IPM offers the prospect of lower production costs and higher profitability. However, adoption of IPM may reduce profitability if it also lowers than productivity, or induces more intensive use of other production factors. On the other hand, IPM may actually promote more productive farming by encouraging more skillful use of available resources.
Palis (2006) state that IPM aims to reduce pesticide use while at the same time sustaining food production, protecting the environment, and ensuring the good health of farmers, their families, and consumers. IPM is an agricultural technology that has been promoted since the 1970s but did not gain widespread adoption until 1990s, when it was disseminated through the farmer field school (FFS).
According to Borkhani (2010) and Rahman (2012), IPM is an effective and environmentally friendly approach in pest management system. It combines of practices including biological, chemical, cultural, and other practices. IPM can manage pest population to avoid economic damage and minimize adverse side effect. IPM enables farmers to reduce their reliance on pesticides while maintain or increasing yields, crop quality and profitability.
minimize risks to human health and the environment. IPM emphasizes the growth of a healthy crop with the least possible disruption to agro-ecosystems and encourages natural pest control mechanisms.
2.3.2 The Concept of IPM Technology
Environmental Protection Agency [EPA] (2012) point out that IPM is not a single pest control method but, rather, a series of pest management evaluations, decisions, and controls. In practicing IPM, growers who are aware of the potential for pest infestation follow a four-tiered approach. The four approaches include:
1. Action Thresholds: before taking any pest control action, IPM first sets an action threshold, a point at which pest populations or environmental conditions indicate that pest control action must be taken. Sighting a single pest does not always mean control is needed. The level at which pests will become an economic threat is critical to guide future pest control decisions.
2. Monitoring and Identifying Pests: Not all insects, weeds, and other living organisms require control. Many organisms are innocuous, and some are even beneficial. IPM programs work to monitor for pests and identify them accurately, so that appropriate control decisions can be made in conjunction with action thresholds. This monitoring and identification removes the possibility that pesticides will be used when they are not really needed or that the wrong kind of pesticide will be used.
3. Prevention: As a first line of pest control, IPM programs work to manage the crop, lawn, or indoor space to prevent pests from becoming a threat. In an agricultural crop, this may mean using cultural methods, such as rotating between different crops, selecting pest resistant varieties, and planting pest free rootstock. These control methods can be very effective and cost efficient and present little or no risk to people or the environment.
mechanical control, such as trapping or weeding. If further monitoring, identifications, and action thresholds indicate that less risky controls are not working, then additional pest control methods would be employed, such as targeted spraying of pesticides. Broadcast spraying of non-specific pesticides is a last resort.
In addition, Nevada University (2013) point out that there are some principles of integrated pest management;
1. Identify pest: the cause of the problem and associated plant or animal species must be correctly identified.
2. Establish monitoring guidelines for each species: routine monitoring of both pests and natural enemies also known as beneficial organism, is an important part of IPM.
3. Establish an action threshold for the pest: Fundamental principle of IPM is that a certain number of individual pests can and should be tolerated. Farmers start by determining whether the pest will cause unacceptable damage to the value of their crop. The economic threshold is defined as the pest population level that produces damage equal to the cost of preventing damage by controlling the pest. The threshold is the pest density or population level, at which management should occur.
4. Evaluate and implement control tactics: Select tactics that will be most effective, economical and have least impact on non target species and the environment. Select methods that will impact beneficial organisms as little as possible while suppressing the pest. If a pesticide is one of the selected management tools, beneficial enemies (usually insects) will likely also be killed. 2.3.3 Principles of IPM Technology
According to Word Bank (2005), there are some principles of IPM technology process;
2. Manage the agro-ecosystem: it is such a way that pests remain below economic damaging levels, rather than attempt to eradicate the pest. Prevention of pest build up and encouragement of natural mortality of the pest is the first line of defense to protect the crop. Non-chemical practices are used to make the field and the crop inhospitable to the insect pest species and hospitable to their natural enemies, and to prevent conditions favorable to the build up of weeds and diseases.
3. Decisions to apply external inputs as supplementary controls are made locally, are based on monitoring of pest incidence and are site-specific: external inputs may include predators or parasites (bio-control), labor to remove the pest manually, pest attracting lures, pest traps, or pesticides. Pesticides are generally used if economically viable non-chemical pest control inputs are not available or failed to control the pest. They are applied only when field monitoring shows that a pest population has reached a level that is likely to cause significant economic damage and the use of pesticides is cost-effective in terms of having a positive effect on net farm profits. Selection of products and application techniques should aim to minimize adverse effects on non-target species, people and the environment.
2.3.4 The Economic Injury Level (EIL)
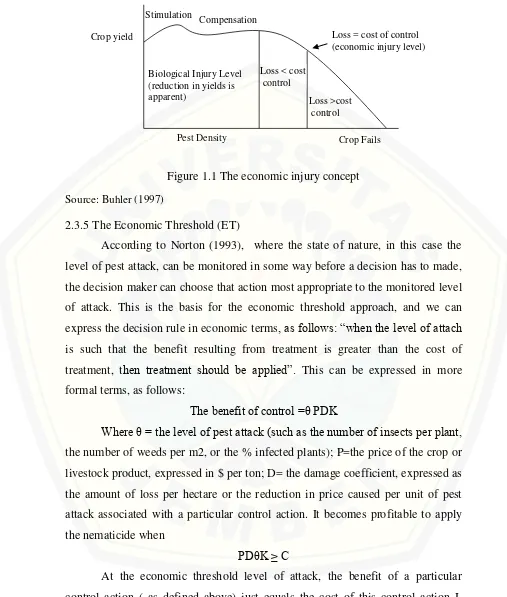
Figure 1.1 The economic injury concept Source: Buhler (1997)
2.3.5 The Economic Threshold (ET)
According to Norton (1993), where the state of nature, in this case the level of pest attack, can be monitored in some way before a decision has to made, the decision maker can choose that action most appropriate to the monitored level of attack. This is the basis for the economic threshold approach, and we can express the decision rule in economic terms, as follows: “when the level of attach is such that the benefit resulting from treatment is greater than the cost of treatment, then treatment should be applied”. This can be expressed in more formal terms, as follows:
The benefit of control =θ PDK
Where θ = the level of pest attack (such as the number of insects per plant, the number of weeds per m2, or the % infected plants); P=the price of the crop or livestock product, expressed in $ per ton; D= the damage coefficient, expressed as the amount of loss per hectare or the reduction in price caused per unit of pest expressed in $ per hectare. That is, where:
θ*PDK=C
Solving for θ*, the economic threshold level of attack: θ*=C/(PDK)
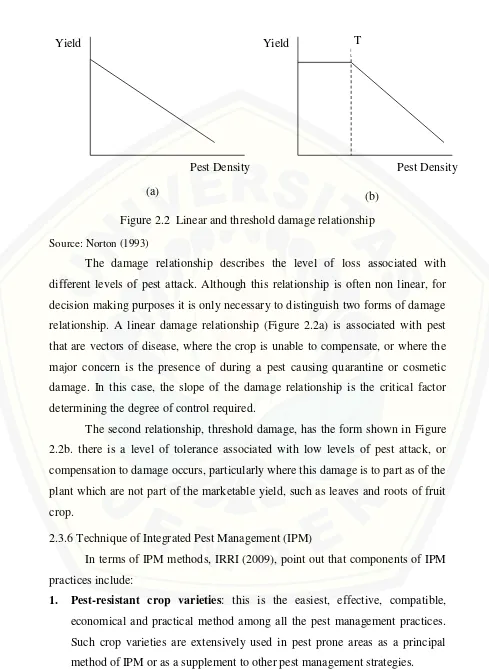
While this break even, economic threshold, as defined above, can be determined for many pest problems having a linear damage relationship (Figure 2.2a), for situations where a threshold relationship occurs, the economic threshold has to be redefined as :
θ* = T + [C/(PDK)]
where T is the damage threshold, that is, the maximum level of pest attack below which losses do not occur (Figure 2.2 b)
These economic threshold formulae can be useful in obtaining a rough idea of the influence of the different variables on the break-even of attack for particular control actions. However, for practical decision making, an action threshold needs to be determined. The economic threshold will provide some useful baseline information but to determine an appropriate action threshold, as a practical decision rule, a number of additional factors will also need to be taken into account, including:
1. Empirical, trial and error experience
2. The dynamics of the pest population, particularly for endogenous pests, that can build up over time. This raises questions concerning the optimal level and timing of control rather than the much simpler break-even criterion of the economic threshold
3. The risk attitude of the farmer, which will influence the margin for error that will need to be included to make the action threshold acceptable.
Figure 2.2 Linear and threshold damage relationship Source: Norton (1993)
The damage relationship describes the level of loss associated with different levels of pest attack. Although this relationship is often non linear, for decision making purposes it is only necessary to distinguish two forms of damage relationship. A linear damage relationship (Figure 2.2a) is associated with pest that are vectors of disease, where the crop is unable to compensate, or where the major concern is the presence of during a pest causing quarantine or cosmetic damage. In this case, the slope of the damage relationship is the critical factor determining the degree of control required.
The second relationship, threshold damage, has the form shown in Figure 2.2b. there is a level of tolerance associated with low levels of pest attack, or compensation to damage occurs, particularly where this damage is to part as of the plant which are not part of the marketable yield, such as leaves and roots of fruit crop.
2.3.6 Technique of Integrated Pest Management (IPM)
In terms of IPM methods, IRRI (2009), point out that components of IPM practices include:
1. Pest-resistant crop varieties: this is the easiest, effective, compatible, economical and practical method among all the pest management practices. Such crop varieties are extensively used in pest prone areas as a principal method of IPM or as a supplement to other pest management strategies. Yield
Pest Density (a)
Yield
Pest Density T
2. Cultural methods: these refer to good agronomic practices that enhance the crop productivity and also suppress the pest population. The cultural practices which are commonly used for rice system are;
a. Proper sanitation: timely removal of weed to reduce the pest survival and reduce the chance or any carryover of the pest
b. Proper water management timely irrigation and good drainage system is required to control plant hoppers.
c. Proper spacing: provision of alley ways of 30 cm. Width after 2-3 m bed planting particularly in the white backed plat hopper and brown plant hopper prone area, proves helpful
d. Time planting: timely and synchronous planting can reduce the occurrence of insect pests like yellow stem borer.
e. Balanced fertilizer: judicious and optimum dose of nitrogen and other fertilizer based on soil testing is essential. Split dosage of nitrogen can also reduce the risk of gall midge, leaf hopper, brown plant hopper, etc. 3. Biological control: biological control is the mainstay of the IPM strategy.
Out of 100 phytophagus insects having potential of becoming pests, only a few attain the pest status while the rest are kept under check by their natural enemies. Even those which attain the pest status have biological agents like predators, parasites ,and pathogens which decrease their population in the rice ecosystem, it is very important to conserve the natural enemies of pest in the field. Avoid the use of broad spectrum pesticides when natural enemies are abundant.
4. Chemical control: application of pesticides is no doubt one of the quickest and sometimes the only solution for the sudden outbreak of pests, specially insect pests. Their application draws the farmer to quick and visible action.
In addition, NPIC (2000) defined there are some methods in IPM technology; cultural methods, physical methods, biological methods;
sanitation can prevent many pest problems), rotating annual plants, and companion planting and intercropping (companion planting involves growing two or more specific types of plant together in the hope that the combination will discourage disease and insect pests).
2. Physical methods: hand picking, spraying in water, pruning, and using barriers (row covers, plant cages, plant collars, sticky barriers, metal barriers ).
3. Biological methods: beneficial insects, protecting beneficial insects, and creating habitat for beneficial insects.
4. Chemical methods: choose the chemical that meets the following criteria; least harmful to the environment, least toxic to the applicator, most specific to the pest, and least harmful to beneficial organisms.
2.3.7 IPM in Thailand
Government (DANIDA), the German Government (GTZ) and the Food and Agriculture Organisation of the United Nations.
According to APO (2000), the IPM strategy has been recommended in the policy guideline of the DOA since 1985. The programs are more focused on progressive agricultural zones. The Ministry of Agriculture and Cooperatives through DOA and DOAE has established IPM demonstration plots in selected crops, namely: rice, cotton, sugarcane and vegetables (crucifer and onion) and extended to 18 economical crops since 1995. From, 1995 to present, under the policy guideline of Ministry of Agriculture and Cooperatives, there has been research and development in minimizing the pesticide usage in agriculture food crops production in order to reduce environmental pollution, better health, better life and sustainable agriculture. IPM is one of the strategies to solve core problems and reach the target.
FAO (2005) reported that IPM in Thailand has been put in the nation social and economic development plan since the seventh plan until present . IPM as well as good agricultural practice (GAP) is the main activity in the Food Safety Programme set by Ministry of Agriculture and Co-operatives starting from 2004. IPM is a collaborative project of the Department of Agriculture, Department of Agricultural Extension (DOAE), the Royal Project and DANIDA.
Fuchs (2007) explained IPM by definition is a challenging subject due to its complexity and its application to commercial agriculture, which requires active management. Proper implementation of IPM requires that those who wish to implement it have an understanding of ecological principles and interactions involved in crop management. Successful implementation generally occurs only when technology is developed through research demonstrated in the location in which it will be used and an educational process has been conducted to make end users aware of the technology, its benefit and how it fits into a production system.
across the country and the USD 7 million outbreak budget was cancelled with 15% of it reallocated to FFS training. However, the promotion of FFS and integrated pest management (IPM) was not sustained, and although the concept still appears in government policies, support for it is currently very low.
In the agricultural sector, adoption of advanced technique or technology may take various forms such as using a new variety, changing the farming process, altering resource inputs, combining different farming practices and so on (Ellis in Huy, 1993). Chi (2008) said that the advantages of IPM included input cost reduction (saving from less seed and pesticide use), benefit increase, and environmental protection. Rice IPM strategy gives high profit to farmer and minimize the bad effects of chemicals (FAO, 1997 in Bandara 1999).
2.3.8 Factor adoption in Integrated Pest Management (IPM) Technology
According to Bonabana (2002), factor affecting of adoption IPM technology includes; economic factors (include farm size, cost of technology, level of expected benefit, and off farm hours), social factor (age of adopter, education, and gender concern), and institutional factors ( information and extension contact).
Singh (2008) indicated that farmer’s characteristics such as age, education, knowledge regarding negative externalities of pesticide use; perception regarding expected yield losses due to pests if pesticides not used; institutional factors such as membership in farmers club; farm size and frequency of meeting with extension personnel have significant effect in adoption behavior in IPM technology. Formal training of farmers on IPM technology was positive and significant in paddy farmers. Farmer who participated in self help groups and owned smallholdings were more likely to adopt IPM practices.
Veisi (2012) found that there are some factor of adoption behavior of IPM technology; exogenous factors (external factor, access of information, access of input, attitude of reference group), farm characteristic (farm size, soil quality, mechanization, number of plots, and labor use), farmer characteristics (age, education, experience, knowledge, attitude, spiritual and religion), and characteristics of innovation (feasibility of IPM practices).
Borkhani (2013), point out that there was positive and significant correlation between IPM technologies adoption and variables including participation in FFS programs, opinion of the leader, participation in extension-education activities, and participation in local association. It shows the important role of agricultural extension agents which can affect paddy farmer’s perception and behavior to adopt and apply IPM technologies.
2.3.9 Constraints in Adoption IPM Technology
change agents), (c) personal constraints (lack of knowledge to identify pests and disease, difficult in calculate dosage, poor education in standard of IPM), (d) socio economic constraints (high of cost input, lack of economical support), and (e) technological constraints (difficult to apply biological method).
Chi (2008), point out that the main reasons of non adoption of IPM included weak perceptions of IPM and low education of farmers, weak teaching capacity and limited knowledge of extension staff, not well organization, and management of extension programs, limitation of concrete conditions of local area and fund.
Ofuoku (2009), pointed out that low adoption in technology can caused by low contact with extension agent. In addition, Hoang (2006) explained that the reason of this problem are; the extension workers lack of knowledge and skills; extension worker cannot communicate effectively with targeted groups not only because they do not have much in common with them but also because they are not equipped with the necessary social skills, organizational know how, and knowledge of the communities they are dealing with.
Borkhani (2010), found that there are five barriers in adoption IPM; infrastructure barrier, management barriers, economic and social barriers, institutional barriers, and training – skill barriers. The researcher gave some solution to solve this problem; educate farmer about benefit of IPM, FFS is the best approaches which facilities awareness enhancement and participation of farmer, increasing plant protection clinic, and increasing center for presenting input for IPM.
the field level. As a result the farmers could not acquire enough confidence on IPM technologies.
2.3.10 The IPM Strategy
According to APO (2000), the extension of IPM in Thailand is progressing gradually but steadily. However the future view for IPM strategy in Thailand should focus on:
1. Pesticide management through safe, efficient, applicable, and economic use of pesticides.
2. Utilization of promising natural enemies such as egg parasitoids, larva parasitoids, predators and other parasitioids.
3. Maximum use of microbial insecticides.
4. Minimize use of chemical insecticides especially those with long residue effect development of practical treatment threshold.
5. Development of other alternative control methods.
6. Development and focus on application technique on different crops/areas. 7. All promising IPM packages will be tested in growing area and evaluated for
its cost effectiveness, cost benefit, and impact to environment.
8. Crop yield by IPM farms will be checked, analyzed regularly for toxic residues by Agricultural Toxic Substance Division, DOA.
2.4 Rice Production in Thailand
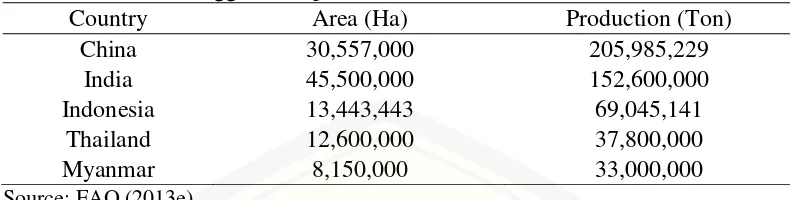
Table 2.1 The fifth biggest rice producer countries in 2012
Country Area (Ha) Production (Ton)
China 30,557,000 205,985,229
Thailand export quantity of rice during 2007-2011 as shown in the Table below, it has dynamic performance, tends to increase. in the 2007, total export quantity of rice around 9.2 million tons which has increased around 16.5% to 10.7 million tons in 2011. Rice not only important for Thailand domestic consume, but also as export commodity.
Table 2.2 Thailand export quantity in 2007-2011
Unit: ton
Based on the Table 2.3 , total rice area in Thailand tends to increase during 2008 to 2012. During those time, total area was increased 18%, followed by increasing in the production and yield dramatically around 19% and 1.2% respectively. Increasing on the total area related with the increasing on the production, and makes the yield increase either.
Table 2.3 Thailand total area, production, and yield of rice in 2008-2012
Year Area (Ha) Production (ton) Yield(Kg/ha)
2008 10,683,549 31,650,632 2,963
2009 11,141,447 32,116,063 2,883
2010 12,119,524 35,583,635 2,936
2011 11,944,320 34,588,355 2,896
2012 12,600,000 37,800,000 3,000
According to the Table below, shows that Central plain region can produce major rice and second rice. In the last five years reported that major rice production has dynamic performance, tends to decrease. While second rice production tends to increase. In 2008, major rice production accounting for 5,585,555 tons, it decreased become 4,876,834 tons in 2011. While second rice production has increase from 4,481,873 tons in 2008 to 4,848,098 tons or increase around 8%.
Table 2.4 Central plain total rice production in 2008-2012
Unit: ton
Ratchaburi is one province in Central plain region which has potential in rice cultivation. Ratchaburi Province can produce major rice and second rice. during 2008 to 2912, both major rice production and second rice production has increased performance every period. Major rice production has increased 9%, while the second rice production has increased 17.7%. the increasing performance shows that Ratchaburi Province has developed on rice production sector.
Table 2.5 Ratchaburi total rice production in 2008-2012
components concerning production management and development of farmers, marketing management and product development, a drive for exports, and speedy and cost-effective product distribution. The second rice strategic plan to be implemented form 2011 to 2015, the Ministry of Agriculture and Cooperatives and the Ministry of Commerce will work more closely in order to link production and marketing for greater efficiency. Thailand has set a target to retain its rice planting area at 62 million rai or about 21 million acres, during the period of the country’s second rice strategic. The second rice strategic plan has three components. First, research and development will be emphasized in order to produce rice varieties of good quality, which are able to resist rice crop insect and be adjustable to the changing climatic conditions. The second component is developing in rice production and products, with a target to increase productivity from 405 kilogram to 679 kilogram per rai, an increase about 10%. It seeks to lower production costs for farmers by 15% in 2015. Moreover this components also involves rearrangement in the rice farming system, efficient use of water, and development of the production system
Panuwet (2012) explained that as an agricultural country and one of the world major food exporters, Thailand relies heavily on the use of pesticides to protect crops and increase yield. The Office of Agricultural Economics (OAE, 2011) and The office of Agricultural Regulation (OAR, 2010) showed that pesticide use increase in the last decade with more than 100.000 tons of active ingredients being imported to Thailand.
to control the import, export, manufacture, sales, storage, transport, and use of hazardous substance including pesticides.
In terms of pesticide use condition in Thailand, Praneetvatakul (2013) reported that Thailand has been progressively banning the most hazardous pesticides over recent years, and by 2011 had banned 98 active ingredients from being used in agriculture. Activists have also called for bans on pesticides such as carbofuran, methomyl and dicrotophos to be introduced, yet opponents of such bans have argued that these chemicals are essential for Thai agriculture and food security. In 2004, the Thai government tried to improve food quality and food safety by introducing a public standard for good agricultural practice, called Q-GAP. The standard has expanded rapidly with certificates issued to 212 thousands farms in 2010 alone. However, recent case studies suggests that the expansion of this scheme has been too rapid, as there is a general lack of compliance among farmers and an insignificant impact on both the average quantity and toxicity of pesticides used. On the supply side, the government has tried to rein in pesticide use through regulation. In 1992 the hazardous substance act harmonized the registration, licensing and monitoring of pesticides following the FAP Guidelines on the Registration and Control of Pesticides, however these stricter regulations have proved difficult to enforce because there are a large number of companies involved in the pesticide trade, there are millions of farmers using pesticides.
2.5 Adoption Innovation
2.5.1 Main Elements in the Diffusion of Innovations
that originates a message. A channel is the means by which a message gets from the source to the receiver. Diffusion is a specific kind of communication and includes these communication elements: an innovation, two individuals or other units of adoption, and communication channel. Thirdly, time: the time aspect is ignored in most behavioral research. The innovation diffusion process, adopter categorizes and rate of adoption all include a time dimension. The last one, social system: the social system defined as a set of interrelated units engaged in joint problem solving to accomplish a common goal.
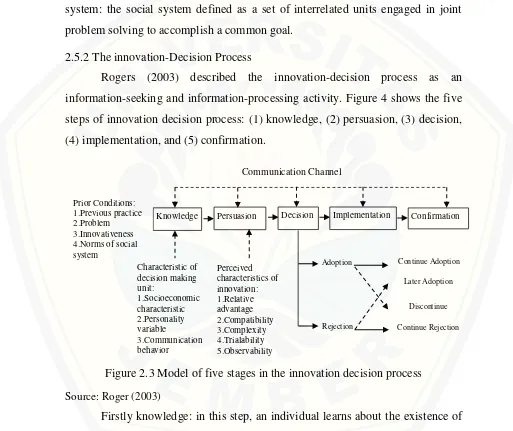
2.5.2 The innovation-Decision Process
Rogers (2003) described the innovation-decision process as an information-seeking and information-processing activity. Figure 4 shows the five steps of innovation decision process: (1) knowledge, (2) persuasion, (3) decision, (4) implementation, and (5) confirmation.
Figure 2.3Model of five stages in the innovation decision process Source: Roger (2003)
Firstly knowledge: in this step, an individual learns about the existence of innovation and seeks information about the innovation. “What?,” “how?,” and “why?” are the critical questions in the knowledge phase. Secondly, persuasion: the persuasion step occurs when the individual has a negative or positive attitude toward the innovation. Thirdly, decision: at the decision stage in the
innovation-Continue Rejection
Knowledge Persuasion Decision Implementation Confirmation
decision process, the individual chooses to adopt or reject the innovation. Adoption refers to full use of an innovation as the best course of action available and rejection means not to adopt an innovation. Fourthly, implementation: at the implementation stage, an innovation is put into practice. The last one, confirmation: decision must be reaffirmed or rejected.
According to Sanders (1966), there are some step in effecting change in adoption technology;
1. Initiation 2. Limitation 3. Diffusion
4. Organization and planning for action 5. Conducting the program
6. Evaluation
Initiation as the first step emphasized that someone comes up with a new idea or recognized a problem. The decision that this problem is important and that something need to be done about it is made by one or more persons. Involving “key” persons among the relevant social system at this point is necessary. The second step legitimation, refers to the process of getting approval of the idea from the power structure of the relevant social systems. It is important to identify who these influential people are and to make plans to get their support. Organizational and planning for action as the fourth stage implies that at some point, a group of “key” people and organization must be brought together to explore alternatives. They should look at relevant situational data and define groups and organizations whose support is needed. Conducting the program and evaluation, indicate that the plans should be carried through to completion and evaluation conducted to determine the degree of which objective are achieved.
2.5.3 Attributes and Rate Adoption Theory
the current way of doing things), compatibility (how the innovation fits in with other management practices), complexity (the level of difficulty to understand and use the innovation), trialability (the degree to which an innovation can be used on a trial or experimental basis), and observability (how visible the results of the innovation are to others). Rate of adoption as the relative speed with which an innovation is adopted by members of a social system. The number of individuals who adopted the innovation for a period of time can be measured as the rate of adoption of the innovation.
2.5.4 Adopter Categorize Theory
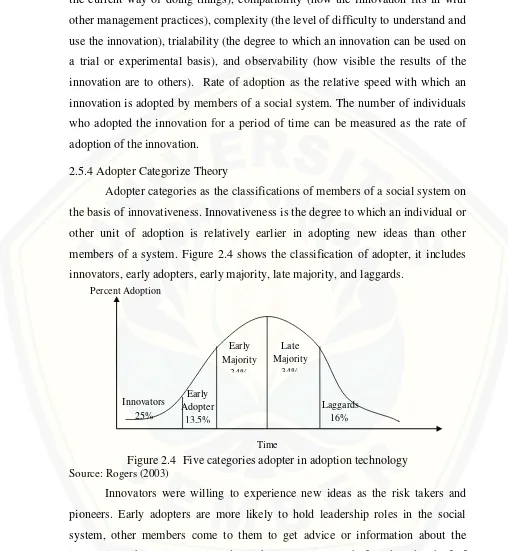
Adopter categories as the classifications of members of a social system on the basis of innovativeness. Innovativeness is the degree to which an individual or other unit of adoption is relatively earlier in adopting new ideas than other members of a system. Figure 2.4 shows the classification of adopter, it includes innovators, early adopters, early majority, late majority, and laggards.
Figure 2.4 Five categories adopter in adoption technology Source: Rogers (2003)
have the traditional view and they are more skeptical about innovations and change agents than the late majority.
2.5.5 Farmer’s Socio Economic Characteristics
According to Choirotunnisa (2008), adoption of advance technology by farmer can be effected by the social factors and economic factors of farmers. Harold (1971) stated that adoption of the approved farm practices reveal the individual’s characteristic relation to his rate of adoption of such practice including age, farm income, social participation, education, land holding, experienced, and communication source as follow:
Age
According to Sutarto (2008), age will effect on the physic capability and respond to the new thing in the rice cultivation. The old farmer was difficult to understand the new technology and change the way of thinking and practice. Fardiaz, M (2008) also pointed out that the younger farmers has higher motivation to know the new thing in the rice cultivating, therefore they were has high level of adoption than the old farmer. However the younger farmer has limitation of experienced, they still has higher motivation on adoption of advanced technology. According to Nurdin (1981) in Choirotuinissa (2008), the unproductive age was under 15 and more than 65 years old. While the productive age was 15 years old to 64 years old.
Farm income
Higher gross farm income related with the adoption rate by farmers. Farmer that has higher income will has higher adoption rate than farmer that has lower income (Harold, 1971). Farm income will increase the motivation of farmer to take the decision on adoption of technology.
Social participation
Education
Rate of adoption is directly related to number of years of formal schooling. However it is not one of the most reliable indicators because it also effect by age, income, and experienced (Harold, 1971 ). Choirotunnisa (2008) also stated that there are two types of education including formal education and informal education. In the informal education, extension service will increase the farmer’s knowledge towards rice cultivation system. Extension service aimed to help farmer on identification farmer’s problem. While the formal education was the years of formal education. Farmer who has higher education will has higher level of adoption than farmer that has lower education.
Land holding
According to Rahardjo (1999) in Sutarto (2008) stated that land holding will effect on the level of farm income which can be factor on the level of adoption the advanced technology. Lionberger in Choirotunissa stated that larger area makes the owner has higher adoption of technology because of high capability in financial. Adopter that more innovative has larger area because their farm was oriented on commercial farm. The adopter will increase their productivity (adopt the advance technology) to increase their profit.
Experienced
Communication source
Different stages in the adoption process are influenced by different communication sources. These source are usually listed as mass media, neighbors, agricultural agencies, and dealers and salesmen. In the trial and adoption stages agricultural agencies including cooperative extension is the second important agencies in individuals adoption an innovation. While the primary influencing is neighbors (Harold, 1971).
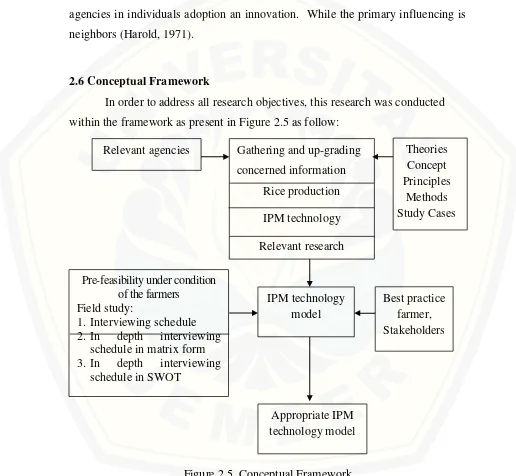
2.6 Conceptual Framework
In order to address all research objectives, this research was conducted within the framework as present in Figure 2.5 as follow:
2.7 Research Hypothesis
The testing hypothesis of this study involves the factors affecting adoption of IPM technology among rice farmers in the study area. From the relevant research papers, many independent variables had statistically significant relationship with dependent variables. Then in this investigation, the research hypothesis are as follows:
1. There are relationship between farmer’s personal background factors, including age, gender, education level, household member, marital status, year of experience with adoption of IPM technology, and media perception with adoption of IPM technology.
2. There are relationship between input used factors, including cost of seeds, cost of fertilizer, cost of pesticide, cost of labor input, cost of machinery input, cost of land use, and cost of opportunity capital with adoption of IPM technology.
3. There is relationship between physical factor including location from paddy field to water resources.
4. There are relationship between biological factors including, infestation by brown plant hopper, rat, golden snail, and weed with adoption of IPM technology.
5. There are relationship between social factors including IPM training and number of group belonging with adoption of IPM technology.
6. There are relationship between economic factors including land tenure and utilization, accessibility of credit, farm income, and non farm income with adoption of IPM technology.
7. There are relationship between institutional factor including number of extension contact and number of service provider contact with adoption IPM technology.
2.8 Structure of Hypothesis
Based on the hypotheses the structures of testing hypotheses is presented in Figure
Figure 2.6 Structure of testing hypotheses Adoption Awareness
Interest Evaluate
Trial Practice Farmers personal
background factors
Social factors
Institutional factors Psychological
factors Biological factors Input Used Factors