Doctor of Philosophy
Faculty of Manufacturing Engineering
SUSTAINABLE MANUFACTURING PRACTICE AND
SUSTAINABILITY PERFORMANCE MEDIATED BY
INNOVATION PERFORMANCE
Norsiah binti Hami
SUSTAINABLE MANUFACTURING PRACTICE AND SUSTAINABILITY PERFORMANCE MEDIATED BY INNOVATION PERFORMANCE
NORSIAH BINTI HAMI
A thesis submitted
in fulfillment of the requirements for the degree ofDoctor of Philosophy
Faculty of Manufacturing Engineering
UNIVERSITI TEKNIKAL MALAYSIA MELAKA
DECLARATION
I declare that this thesis entitled “Sustainable Manufacturing Practice and Sustainability Performance Mediated by Innovation Performance” is the result of my own research except as cited in the references. The thesis has not been accepted for any degree and is not concurrently submitted in candidature of any other degree.
Signature : ... Name : Norsiah binti Hami
APPROVAL
I hereby declare that I have read this thesis and in my opinion this thesis is sufficient in terms of scope and quality for the award of Doctor of Philosophy.
Signature : ... Supervisor Name : Prof. Dr. Mohd Razali Muhamad Date : ...
Signature : ... Co-Supervisor Name : Dr. Zuhriah Ebrahim
DEDICATION
i
ABSTRACT
ii
ABSTRAK
iii
ACKNOWLEDGEMENTS
In the name of Allah, the Most Gracious and the Most Merciful. I would like to extend my deepest gratitude and thanks to Allah the Almighty for giving me excellent health and energy to complete my research.
I would like to express my gratitude to everyone who contributes to the completion of this research. Special thanks go to my main supervisor, Prof. Dr. Mohd. Razali Muhamad, and co-supervisor, Dr. Zuhriah Ebrahim, for their valuable guidance, ideas and encouragement throughout the entire research process. Without their assistance and continued support, I would not be able to complete this thesis as presented here.
My acknowledgments are also dedicated to Ministry of Education Malaysia for financial support and my beloved employer, Universiti Utara Malaysia (UUM), for giving me the chance to pursue my PhD in the Universiti Teknikal Malaysia Melaka (UTeM). I am also indebted to the respondents in this study for their time and willingness to share valuable information.
iv
1.2 Sustainability in manufacturing 4
1.3 Research motivation 10
1.4 Research questions 16
1.5 Research objectives 16
1.6 Research scope 17
1.7 Research significance 17
1.8 Thesis organization 19
2. LITERATURE REVIEW 21
2.1 Preliminary 21
2.2 Sustainability and sustainable manufacturing (SM) 21 2.3 Sustainable manufacturing practice (SMP) 25 2.3.1 Internal sustainable manufacturing practice (Internal SMP) 30 2.3.2 External sustainable manufacturing practice (External
SMP) 34
2.4 Innovation 39
2.4.1 Innovation performance (IP) 43
2.5 Theoretical foundation 47
2.5.1 Resource-based view (RBV) theory 47
2.5.2 Stakeholder theory 49
2.6 Theoretical framework 52
2.6.1 Sustainable manufacturing practice (SMP) and
sustainability performance (SP) 54
2.6.1.1 Sustainable manufacturing practice (SMP) and
economic sustainability 57
2.6.1.2 Sustainable manufacturing practice (SMP) and
environmental sustainability 62
2.6.1.3 Sustainable manufacturing practice (SMP) and
social sustainability 64
2.6.2 SMP, innovation performance (IP) and sustainability
v
2.6.2.1 Sustainable manufacturing practice (SMP) and
innovation performance (IP) 69
2.6.2.2 Innovation performance (IP) and sustainability
performance (SP) 72
2.6.2.3 Innovation performance (IP) as a mediator 76
2.7 Summary 78
3. RESEARCH METHOD 79
3.1 Preliminary 79
3.2 Research process 80
3.3 Item measure development 83
3.3.1 Exogenous latent variables 84
3.3.2 Endogenous latent variables 93
3.4 Questionnaire development 101
3.4.1 Construction of initial questionnaire 101
3.4.2 Pre-test 101
3.4.3 Pilot test 102
3.5 Survey administration 104
3.5.1 Survey plan 104
3.5.2 Survey implementation 106
3.5.3 Response analysis 108
3.6 Data analysis 112
3.6.1 Descriptive analysis 112
3.6.2 PLS-SEM 113
3.6.2.1 Measurement model validation 114
3.6.2.2 Structural model analysis 116
3.6.2.3 Structural model 1 through structural model 9 119
3.7 Summary 126
4. RESULT AND DISCUSSION 127
4.1 Preliminary 127
4.2 Descriptive analysis of respondent 127
4.3 Measurement model validation 132
4.3.1 Exogenous variables 133
4.3.2 Endogenous variables 141
4.4 Descriptive analysis of variable 149
4.5 Structural model analysis 152
4.5.1 Hypothesis 1 results (SMP→SP) 154
4.5.2 Hypothesis 2 results (SMP→IP→SP) 157
4.5.3 Validated model 171
4.6 Discussion 174
4.6.1 The level of SMP, SP and IP 174
4.6.2 The impact of SMP on SP 177
4.6.2.1 The impact of SMP on economic sustainability 178 4.6.2.2 The impact of SMP on environmental
sustainability 181
4.6.2.3 The impact of SMP on social sustainability 182 4.6.3 Mediating effect of IP on SMP-SP linkage 184
4.6.3.1 Mediating effect of product innovation on
vi
4.6.3.2 Mediating effect of process innovation on
SMP-SP linkage 187
4.6.3.3 Mediating effect of organizational innovation on
SMP-SP linkage 189
4.6.3.4 Mediating effect of marketing innovation on
SMP-SP linkage 190
4.6.4 Validated model 192
4.7 Summary 194
5. CONCLUSION AND FUTURE RESEARCH 196
5.1 Preliminary 196
5.2 Research findings 197
5.3 Research contributions 199
5.4 Research implications 201
5.5 Limitations and future research 203
REFERENCES 207
vii
LIST OF TABLES
TABLE TITLE PAGE
1.1 Global merchandise trade 3
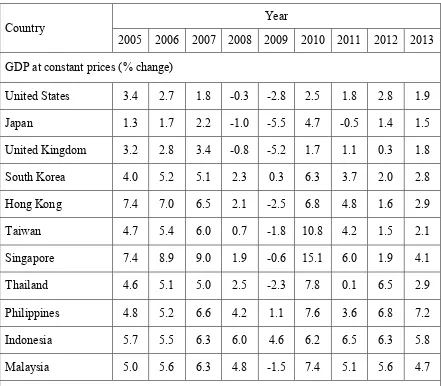
1.2 GDP growth for selected countries 3
1.3 Percentage share of GDP by economic activities 5 1.4 Key indicators of manufacturing sector for 2005 and 2010 5 1.5 Relative frequency of accidents reported for 2008 through 2012 7 1.6 Number of accidents reported according to industry for 2012 8 2.1 Conceptual definition of each element in 6R methodology (Jayal et
al., 2010)
28
2.2 Definition of the constructs 55
2.3 Empirical findings on insignificant SMP-SP linkage 67
3.1 The indicator variables of internal SMP 87
3.2 The indicator variables of external SMP 90
3.3 The indicator variables of SP 94
3.4 The indicator variables of IP 98
3.5 The comments from pre-test 103
3.6 The analysis of interim consistency reliability 105 3.7 Determination of sample size (Cochran, 1977) 107 3.8 Determination of final sample size (Cochran, 1977) 107
viii
3.10 Structural model 1 through structural model 9 121 3.11 The four steps of mediation analysis (Baron and Kenny, 1986) 124
4.1 Profile of the responded firms 128
4.2 Profile of respondents 131
4.3 Factor loadings, composite reliability and AVE for internal SMP 136 4.4 Factor loadings, composite reliability and AVE for external SMP 137 4.5 Comparison of the AVE and squared correlation between constructs
for SMP at first-order model
140
4.6 Comparison of the AVE and squared correlation between constructs for SMP at second-order model
140
4.7 Factor loadings, composite reliability and AVE for SP 144 4.8 Factor loadings, composite reliability and AVE for IP 145 4.9 Comparison of the AVE and squared correlation between constructs
for SP and IP
148
4.10 Mean and standard deviation of variables 150
4.11 Collinearity statistics 153
4.12 Hypothesis 1 (Structural Model 1 through Structural Model 3) test results
155
4.13 Summary of the results (hypothesis 1) 156
4.14 Specific hypothesis of H2(a) (Structural Model 4) - Internal SMP, IP and SP1
158
4.15 Specific hypothesis of H2(b) (Structural Model 5) - External SMP, IP and SP1
160
4.16 Specific hypothesis of H2(c) (Structural Model 6) - Internal SMP, IP and SP2
ix
4.17 Specific hypothesis of H2(d) (Structural Model 7) - External SMP, IP and SP2
164
4.18 Specific hypothesis of H2(e) (Structural Model 8) - Internal SMP, IP and SP3
166
4.19 Specific hypothesis of H2(f) (Structural Model 9) - External SMP, IP and SP3
168
x
LIST OF FIGURES
FIGURE TITLE PAGE
1.1 Three pillars of sustainability 11
2.1 The evolution of manufacturing concepts (Jawahir and Dillon Jr., 2007)
26
2.2 The evolution of SM concepts and practices (OECD, 2010) 27 2.3 Interactive model of innovation (Rothwell and Zegveld, 1985) 40
2.4 Theoretical framework of the present study 53
3.1 The research process 81
3.2 Exogenous variables 86
3.3 Path diagram of measurement model for internal SMP 89 3.4 Path diagram of measurement model for external SMP 92
3.5 Path diagram of measurement model for SP 96
3.6 Path diagram of measurement model for IP 100
3.7 Hypothesized structural model 120
4.1 Measurement models of exogenous variables 134
4.2 The result of measurement model of SMP 135
4.3 Measurement models of endogenous variables 142
4.4 The result of measurement model of SP and IP 143
4.5 Validated causal model of SMP on SP 172
xi
LIST OF APPENDICES
APPENDIX TITLE PAGE
A Gantt chart for the present research 237
B Cover letter of questionnaire 238
C Finalized set of questionnaire 239
D Factor loadings and cross loadings for SMP 246
E Factor loadings and cross loadings for SP 247
xii
LIST OF ABBREVIATIONS
3R - Reduce, reuse, recycle
6R - Reduce, reuse, recycle, recover, redesign, remanufacture APEC - Asia-Pasific Economic Cooperation
AVE - Average variance extracted BNM - Bank Negara Malaysia
CB-SEM - Covariance based structural equation modeling CEO - Chief executive officer
CFA - Confirmatory factor analysis CI - Confidence interval
CMB - Common method bias CO2 - Carbon dioxide
CR - Composite reliability
CSR - Corporate social responsibility EFA - Exploratory factor analysis
EMS - Environmental management systems EPA - Environmental Protection Agency Ext1 - Supplier relation
xiii Ext5 - Industrial relation
FMM - Federation of Malaysian Manufacturers GDP - Gross domestic product
GHG - Greenhouse gases
GLC - Government-linked companies
IBM SPSS - Statistical Package for the Social Sciences IEA - International Energy Agency
ILO - International Labor Organization IMF - International Monetary Fund Int1 - Cleaner production
Int2 - Eco-efficiency Int3 - Employee relation IP - Innovation performance IP1 - Product innovation IP2 - Process innovation
IP3 - Organizational innovation IP4 - Marketing innovation
ISO - International Organization for Standardization
JV - Joint venture
LC - Local company
MNC - Multinational corporation
OECD - Organization for Economic Co-operation and Development PBDE - Dipheny polybrominated ether
xiv R&D - Research and development RBV - Resource-based view SD - Sustainable development SEM - Structural equation modeling SME - Small and medium enterprise SMP - Sustainable manufacturing practice SOCSO - Social Security Organization SP - Sustainability performance SP1 - Economic sustainability SP2 - Environmental sustainability SP3 - Social sustainability
TBL - Triple bottom line
TQM - Total quality management
UNEP - United Nations Environment Programme
UK - United Kingdom
US - United States
VIF - Variance inflation factor
xv
LIST OF PUBLICATIONS
Hami, N., Muhamad, M.R. and Ebrahim, Z., 2014. Exploring Sustainable Manufacturing Practices and Sustainability Performance among Malaysian Manufacturing Firms. In
International Symposium on Research in Innovation and Sustainability 2014, Melaka,
Malaysia, 15-16 October 2014. Universiti Teknikal Malaysia Melaka.
Hami, N., Muhamad, M.R. and Ebrahim, Z., 2014. The impact of Sustainable Manufacuring Practices and Innovation Performance on Economic Sustainability. In 12th
Global Conference on Sustainable Manufacturing, Johor Bahru, Malaysia, 22-24
September 2014. CIRP.
Hami, N., Muhamad, M.R. and Ebrahim, Z., 2012. Sustainable Manufacturing Practices towards Performance Improvement. In Bani Hashim, A.Y., Proceedings of the
International Conference on Design and Concurrent Engineering, Melaka, Malaysia,
15-16 October 2012. Universiti Teknikal Malaysia Melaka.
Muhamad, M.R., Ebrahim, Z. and Hami, N., 2014. The Influence of Innovation Performance towards Manufacturing Sustainability Performance. In Proceedings of the
2014 International Conference on Industrial Engineering and Operations Management,
1
CHAPTER 1
INTRODUCTION
1.1 Preliminary
The business environment has changed significantly since the last decades. Efforts toward globalization have increased due to an increase in connectivity and interdependence among different markets and business niches around the world. Globalization, which is the process of international integration, has become the propeller of global economic growth (Kim, 2010). International trade has managed to record positive growth annually for the past five years (2005-2010), with an annual average growth of more than 7% (WTO, 2011).
Table 1.1 shows the data of global merchandise trade dating from the middle of the 20th century. The data highlighted an increase pattern for both merchandise exports as well as imports. More remarkably, the value of global merchandise exports and imports has increased significantly from US$59 billion and US$62 billion in 1948 to US$14,851 billion and US$15,077 billion in 2010, respectively (WTO, 2011). This is an indicator which signaled how developed and developing countries are able to create competitive advantages by opening their economies to the global stage. Impressive evidence could be seen from the favorable economic performance exhibited by one of Asia’s own economic giants, The People's Republic of China (PRC).
2
world, with growth rates averaging 10% over the past 30 years. Its share in the global growth from 1995 to 2002 was estimated at 25%, compared to 20% in the US (Kim, 2010). Besides PRC, other developing countries in Asia have also experienced rapid economic growth. For example, in 2013 alone, GDP increased by 4.7% in Malaysia, 2.9% in Thailand, 5.8% in Indonesia and 7.2% in Philippines (IMF, 2014), displayed in Table 1.2.
Nevertheless, various conflicts of interest emerged between the economic profit originating from industrialization and the accompanying adverse effects due to severe pollution and destruction of natural resources caused by such industrial activities. For instance, rapid industrial development in PRC since the 1980's as a result of economic reformed stirred concern. PRC, which emitted 5.92 tons per capita of carbon dioxide (CO2)
or approximately 25% of global emissions in 2011, has been the biggest emitter of CO2 in
the world since 2006 (IEA, 2013). There is a strong view that the level of CO2 and other
greenhouse gases (GHG) such as methane, nitrous oxide and a number of gases that are created from industrial processes is rising (Rajemi, 2010). Although the flow of carbon emissions is not harmful to the public immediately, contrasting with the other polluting gases, it is a major contributor to climate change problems.
3
Table 1.1 Global Merchandise Trade
Year 1948 1953 1963 1973 1983 1993 2003 2010
Value (Billions US$)
Merchandise exports 59 84 157 579 1838 3676 7377 14851 Merchandise imports 62 85 164 594 1882 3786 7695 15077 Source: World Trade Organization, International Trade Statistics 2011
Table 1.2 GDP Growth for Selected Countries
Country Year
2005 2006 2007 2008 2009 2010 2011 2012 2013 GDP at constant prices (% change)
United States 3.4 2.7 1.8 -0.3 -2.8 2.5 1.8 2.8 1.9 Japan 1.3 1.7 2.2 -1.0 -5.5 4.7 -0.5 1.4 1.5 United Kingdom 3.2 2.8 3.4 -0.8 -5.2 1.7 1.1 0.3 1.8 South Korea 4.0 5.2 5.1 2.3 0.3 6.3 3.7 2.0 2.8 Hong Kong 7.4 7.0 6.5 2.1 -2.5 6.8 4.8 1.6 2.9
Taiwan 4.7 5.4 6.0 0.7 -1.8 10.8 4.2 1.5 2.1
4 1.2 Sustainability in manufacturing
Although remarkable economic achievement has contributed to human development and reduced poverty in Malaysia, the impacts of rapid environmental changes raise doubts as to its sustainability and inter-generational equity (Hezri and Hasan, 2006). In recent decades, the country faces new challenges related to the sustainability due to the increasing of the scarcity of resources, the rapid deterioration of the global environment, and human beings pursuit of a higher quality of life. With the increasing of the depletion of natural resources of the earth, firms are looking for better efficiency in managing their resource needs.
Manufacturing is one of the key economic sectors in Malaysia which recorded positive annual growth, accounted for 24.2% of GDP in 2012 as shown in Table 1.3. The main impetus for this favorable performance were petroleum, chemical, plastic and rubber products (29.9% shares) as well as the rebound in transport equipment and other manufactured products. Meanwhile, electrical and electronics products were the second largest contributor with 24.5% of shares (Department of Statistics Malaysia, 2013).
Key indicators of the manufacturing sector registered a positive growth in 2010, as shown in Table 1.4. The value of gross output grew by RM181.0 billion in the five years, resulting in an annual compounding growth rate of 5% between 2005 and 2010. During the same period, the other key indicators of manufacturing sector include intermediate input, value added, fixed assets, and employment followed the same trend, with an increase of 4.4%, 7.6%, 2.0% and 1.6%, respectively (Department of Statistics Malaysia, 2012).