I. Introduction
This section provides the background of the study, highlighting the increasing use of online marketing and e-ticketing in the airline industry, specifically focusing on AirAsia. The research problem is clearly defined as the need to understand factors influencing customer satisfaction with online ticket purchases from AirAsia. The research questions focus on the relationships between promotion, service quality, customer experience, brand, and customer satisfaction. The objectives of the study are explicitly stated, outlining the intention to investigate these relationships.
II. Literature Review
This section reviews existing literature related to online marketing, customer satisfaction, purchase decisions, and e-ticketing. It explores various theories and models relevant to understanding customer satisfaction, including the disconfirmation paradigm and the SERVQUAL model for service quality. The section also delves into the impact of promotion, service quality, customer experience, and brand on customer satisfaction, drawing upon relevant research findings and establishing the theoretical framework for the study. Different perspectives on customer satisfaction, such as cognitive and affective dimensions, are examined.
2.1 Online Marketing
This subsection discusses the evolution of online marketing and its impact on consumer behavior, particularly in the context of the airline industry. It examines the shift in consumer expectations and the role of the internet in facilitating e-commerce. The growth of internet usage and its influence on marketing strategies are also discussed. This sets the stage for understanding AirAsia's online ticket sales within a broader market context.
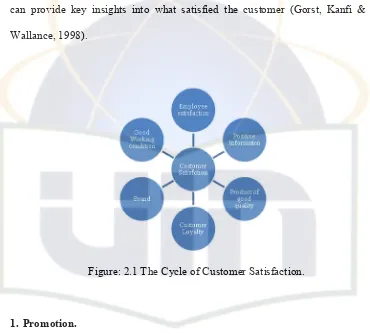
2.2 Customer Satisfaction
This subsection examines various definitions and models of customer satisfaction, emphasizing the distinction between satisfaction with tangible products and services. The role of expectations, performance, and disconfirmation in shaping customer satisfaction is explored. Different theoretical perspectives, such as the disconfirmation paradigm and value-percept disparity theory, are analyzed. The complex nature of customer satisfaction and its measurement are addressed.
2.3 Purchase Decision
This subsection focuses on the consumer decision-making process, highlighting the various factors influencing purchase decisions, and the role of price expectations. It explores different consumer decision-making styles and how these styles might impact choices in online ticket purchases. The influence of product characteristics on consumer choices is also discussed, laying the groundwork for understanding how factors like brand and price influence online ticket purchases.
2.4 E-Ticketing
This subsection provides a detailed explanation of e-ticketing, its benefits for both airlines and customers, and how customers use online e-ticketing systems. The advantages and disadvantages of e-ticketing are analyzed, along with the evolution of airline reservation systems. This contextualizes the study's focus on AirAsia's e-ticketing system.
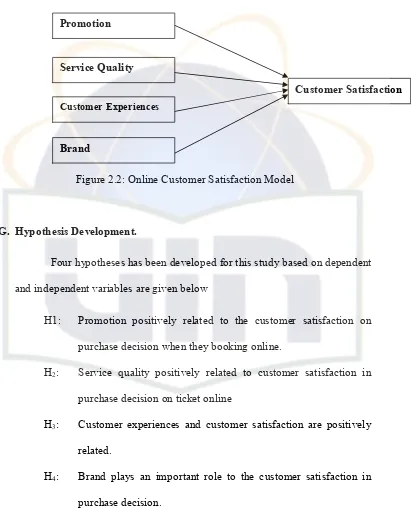
2.5 Factors Affecting Customer Satisfaction in Purchasing Tickets Online
This subsection focuses on the specific factors that influence customer satisfaction in online ticket purchases, particularly promotion, service quality, customer experience, and brand. The relationship between these factors and customer satisfaction is discussed, citing relevant research findings and establishing the hypotheses for the study. Each of the key variables is introduced and their potential impact on customer satisfaction is explored.
III. Research Methodology
This section details the research design, sampling method, data collection procedures, and data analysis techniques employed in the study. The research design is described, explaining the chosen approach and rationale. The sampling method (purposive judgment sampling) is justified and its implications for the generalizability of the findings are discussed. Data collection instruments (questionnaires) and the measurement scales used are detailed. The data analysis techniques, including multiple linear regression, are explained.
3.1 Research Design
This subsection outlines the overall research design adopted for the study, specifying whether it's quantitative, qualitative, or mixed-methods. The rationale behind the choice of research design is clearly articulated, justifying its suitability for answering the research questions. The chosen design's strengths and limitations are also acknowledged.
3.2 Unit of Analysis
This subsection clarifies the unit of analysis for the study, which in this case is likely individual customers who have purchased AirAsia tickets online. The selection of this unit of analysis is justified, explaining its relevance to the study's objectives and the research questions. The implications of focusing on the individual level are discussed.
3.3 Research Sampling
This subsection details the sampling method used to select the participants for the study. The specific method (purposive judgment sampling) is explained and justified. The sample size is mentioned, along with the rationale behind the chosen number of respondents. The potential biases associated with the sampling method are acknowledged.
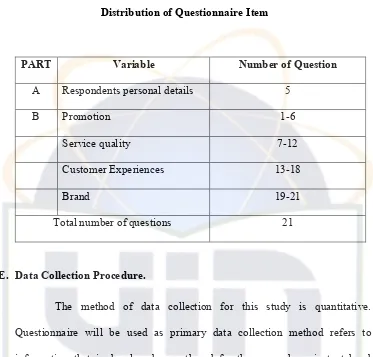
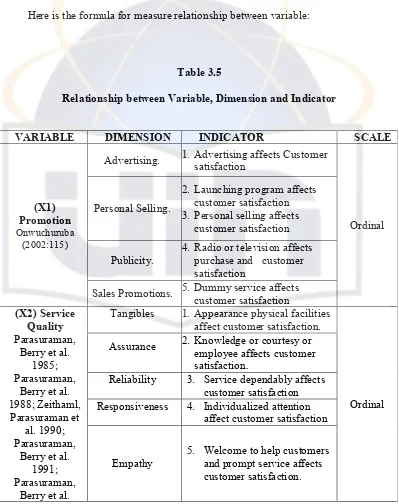
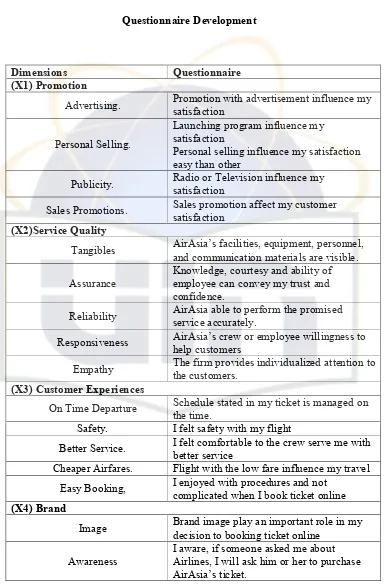
3.4 Instrument and Measurement
This subsection describes the instruments used to collect data, such as questionnaires. The specific items included in the questionnaires and the scales used to measure the variables are described. The reliability and validity of the measurement instruments are addressed, explaining how these were established. The choice of measurement scales (e.g., Likert scale) is justified.
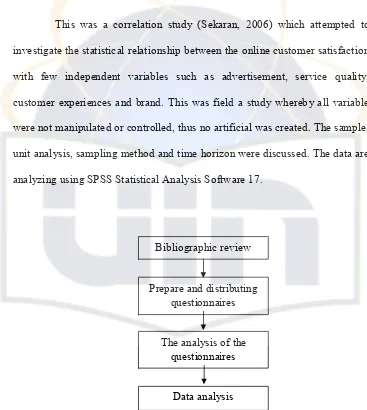
3.5 Data Collection Procedure
This subsection outlines the step-by-step process used to collect the data. This involves describing how the questionnaires were administered, the target population, and the methods used to ensure a high response rate. Any challenges encountered during the data collection process are mentioned. The procedures used to maintain the integrity of the data are described.
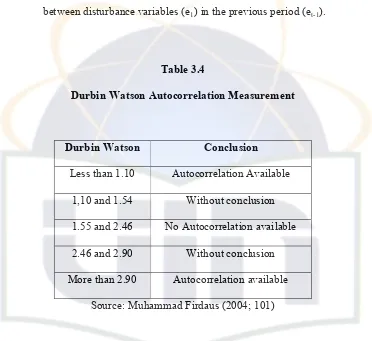
3.6 Data Analysis Technique
This subsection describes the statistical techniques used to analyze the collected data. The specific techniques employed (multiple linear regression, frequency analysis, validity and reliability tests) are explained in detail. The rationale for choosing these techniques is articulated, highlighting their suitability for addressing the research questions. The interpretation of the results obtained using these techniques is outlined.
IV. Findings and Analysis
This section presents the results of the data analysis, including descriptive statistics and inferential statistics. The findings are presented systematically, starting with descriptive statistics to provide an overview of the sample characteristics. Then, the results of the multiple linear regression analysis are presented, showing the relationships between the independent variables (promotion, service quality, customer experience, and brand) and the dependent variable (customer satisfaction). The statistical significance of the findings is discussed.
4.1 General Description of Research Object
This subsection provides a descriptive overview of the sample demographics. This would include details such as gender, age, education level, frequency of AirAsia purchases, etc. This information helps to understand the characteristics of the respondents and provides context for interpreting the study's findings. The data presented here should be summarized using descriptive statistics, such as frequencies and percentages.
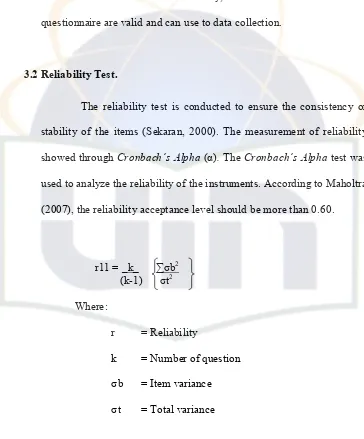
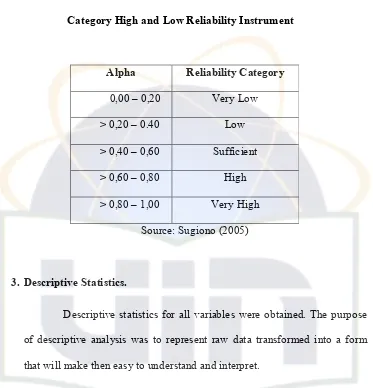
4.2 Validity and Reliability
This subsection assesses the validity and reliability of the measurement instruments used in the study. The results of validity tests (e.g., content validity, construct validity) are presented and discussed, demonstrating the accuracy and appropriateness of the measures. The reliability coefficients (e.g., Cronbach's alpha) are reported and interpreted, indicating the internal consistency of the scales used.
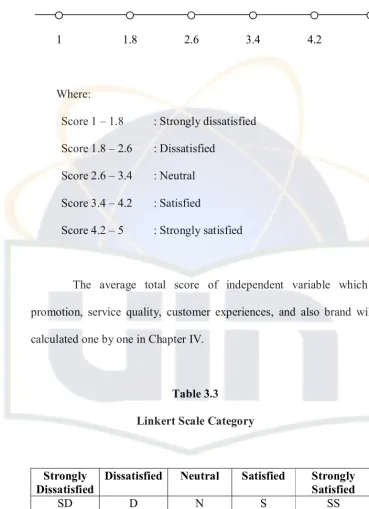
4.3 Descriptive Analysis
This subsection presents descriptive statistics for each of the variables in the study. Means, standard deviations, and frequencies are presented for each variable, providing a summary of the data collected. This section gives an overall picture of the responses obtained and helps to lay the groundwork for further analysis.
4.4 Multiple Linear Regression
This subsection presents the results of the multiple linear regression analysis. The regression model is presented, showing the relationship between the independent variables (promotion, service quality, customer experience, brand) and the dependent variable (customer satisfaction). The regression coefficients, R-squared, F-statistic, and t-statistics are reported and interpreted. The statistical significance of the relationships is assessed.
4.5 Summary
This subsection summarizes the key findings of the data analysis. The most important results are reiterated concisely, highlighting the relationships between the variables and their implications for understanding customer satisfaction with online ticket purchases from AirAsia. This section serves as a bridge to the conclusion and implications.
V. Conclusion and Implications
This section summarizes the major findings, discusses their implications for AirAsia and the airline industry, offers recommendations for improving customer satisfaction, and acknowledges any limitations of the study. The conclusions are clearly stated and directly related to the research questions and objectives. The implications of the findings are discussed in terms of their practical relevance for AirAsia's marketing and service strategies. Recommendations are provided based on the research findings.
5.1 Conclusion
This subsection provides a brief summary of the study's main findings. It reiterates the key relationships identified between the independent and dependent variables. The conclusions should be supported by the evidence presented in the findings section and directly address the research questions.
5.2 Implication of Study
This subsection discusses the practical implications of the study's findings for AirAsia. It explains how the findings can inform AirAsia's marketing and service strategies to enhance customer satisfaction. The implications should be discussed in relation to the specific factors identified as significant predictors of customer satisfaction.
5.3 Recommendation
This subsection offers recommendations to AirAsia based on the study's findings. These recommendations should be specific, actionable, and feasible. They should focus on improving the aspects of promotion, service quality, customer experience, and brand that were identified as being important for customer satisfaction.
5.4 Limitation
This subsection discusses the limitations of the study. This includes acknowledging any potential biases associated with the sampling method or measurement instruments. Any limitations in the generalizability of the findings are also addressed. This section contributes to the overall integrity and credibility of the study by honestly acknowledging its limitations.