RELATIONSHIP BETWEEN TRAFFIC PERFORMANCE MEASURES
AND SIGNIFICANT VARIABLES WHICH INFLUENCE
THE PERFORMANCE OF ATCS
A. Caroline Sutandi1) 1)
Senior Lecturer in Department of Civil Engineering - Parahyangan Catholic University Ciumbuleuit 94 Bandung 40141 Indonesia. Fax: +62 22 233692
Email:[email protected]
ABSTRACT
Advanced Traffic Control Systems (ATCS) are recognised as one of ITS (Intelligent Transportation Systems) technologies that have most potential to ease congestion problems in many large cities in developing countries. The application of ATCS in developing countries is unique because cities in developing countries face more severe transportation problems than those in developed countries and characterised by specific geometric and traffic local conditions, for examples: low road network densities with poor conditions, narrow lane width, poor lane discipline, and level of side friction in connection with on street parking and street vendor activities. A large road network under ATCS surveillance in Bandung, Indonesia was used as a case study. This study identified a large number of influencing factors which were then used as input variables to determine their impact on the performance of an ATCS. Multiple regression analysis was used to investigate relationships between traffic performance measures i.e. throughput, queue length, and travel time, and these significant variables. High technology built in a developed country can be successfully implemented in a developing country if the specific geometric and traffic conditions in the large cities and the local traffic behaviour are taken into account. By finding out the relationships between traffic performance measures and the significant variables, appropriate improvements of the performance of the ATCS in large city in developing country can be recommended. The findings of this study are believed not only beneficial to improve ATCS performance and reduce traffic congestion in Bandung, but also beneficial for other large cities in Indonesia and other developing countries, that has similar specific local conditions.
Keywords: ATCS, specific geometric, traffic conditions, and traffic performance measures.
INTRODUCTION
Traffic congestion is a complex problem in
many large cities around the world, including in
developing counties. Road authorities have now
recognised that building additional road capacity
alone does not help to solve traffic congestion. More
emphasis is being placed recently on travel demand
management techniques and the application of
advanced technologies such as Advanced Traffic
Control Systems (ATCS) to improve efficiency and
capacity of existing road infrastructure (US DOT,
2005, ITS Australia, 2005).
The application of such systems in developing
countries posed unique challenges because these
cities faced more severe transportation problems and
are characterised by low road network densities
(Morichi, 2005) with narrow lanes, poor lane
discipline, and level of side friction in connection
with on street parking and street vendor activities
(Sutandi and Dia, 2005a, 2005b). The aim of this
study is to identify a number of significant variables
which influence the performance of ATCS.
Multiple regression analysis was then used to
investigate relationships between traffic performance
measures i.e. throughput, queue length, and travel
time, and significant variables. The evaluation of
traffic performance measures were obtained in this
study using traffic simulation AIMSUN (Advanced
Interactive Microscopic Simulation for Urban and
Un-urban Network). By finding out the relationships
between traffic performance measures and the
significant variables, appropriate improvements in
the performance of the ATCS can be recommended,
based on the existing specific geometric and traffic
conditions and the specific local traffic behaviour.
Traffic Performance Measures and Variables
The traffic performance measures used in this
study are throughput (veh/h) and queue length (veh)
at signalised intersections and travel time (hh:mm:ss)
in the “stream”. A stream is a set of sections that are
consecutive and connected through intersection
(TSS, 2004a). All of the streams are divided based
on the road hierarchy.
The variables that might have significant
influence
on
the
performance
measures
at
intersections can be classified into the following
three categories:
variables that include in the geometric and
traffic conditions of intersections including
number of leg intersections, number of
medians, number of splitter islands, number of
phases, number of movements, the size of
intersection, the existence of CCTV, the
longest width of leg intersection, and the
shortest width of leg intersection.
variables that include in the geometric and
traffic conditions of the road network
including
the
distance
to
the
closest
intersection, the road hierarchy, volume
capacity ratio of major road, and volume
capacity ratio of minor road.
other variables, regarding the specific local
conditions in the large city Bandung including
the presence of policemen at intersection
which encourage people to adhere the traffic
regulation, the location of intersection (in CBD
or in residential area), and level of side
friction, in connection with on street parking
and on street vendor activities.
Whereas the variables that might have
significant influence on the performance
measures in the streams can be classified into
the following three categories:
variables that include in the geometric and
traffic conditions of intersections along the
stream including the distance to the closest
intersection, number of phases at intersection,
and the existence of CCTV at intersection.
variables that include in the geometric and
traffic conditions of the stream including the
road hierarchy, lane width, and number of
lanes, volume capacity of the road.
other variables, regarding the specific local
conditions in the large city, Bandung
including the presence of policemen at
intersection which encourage people to adhere
the traffic regulation, the location of
intersection (in CBD or in residential area),
and level of side friction, in connection with on
street parking and on street vendor activities
(Sutandi and Dia, 2005b).
RESEARCH METHOD
AIMSUN Microsimulator
GETRAM (The Generic Environment for
Traffic Analysis and Modelling) was used as a tool
to evaluate the traffic performance measures in
Bandung road network, Indonesia. GETRAM
consists of TEDI as a traffic editor and AIMSUN
(Advanced Interactive Microscopic Simulator for
Urban and Non Urban Networks) as a microscopic
traffic simulator (TSS, 2004a, TSS, 2004b).
Previously, the Bandung microscopic traffic
simulation models during peak and off peak periods
have been developed, calibrated, and validated using
GETRAM. Furthermore, a number of statistical tests
including Paired T-test, Two Sample T-test,
Regression Analysis, Analysis of Variance, and
Correlation Tests (Mason, Robert L. et al., 2003,
Montgomery, Douglas C., and Runger, George C.,
2003, Ott, R. Lyman, and Longnecker, Michael,
2001) were used to determine the adequacy of the
models in replicating traffic conditions. Based on the
results of five statistical analyses, all of the calibrated
and validated models reproduced traffic conditions
with an acceptable degree of confidence. Therefore,
the models were clearly accepted as significant valid
replication of “the real world” (Sutandi and Dia,
2005a, 2005b). The validated models were then used
to evaluate the traffic performance measures in
Bandung.
Data Collection
Field data was carried out in a large road
network area in Bandung, Indonesia including
geometric detail data, traffic demand data, and traffic
control data. Advanced traffic control system
SCATS (Sydney Coordinated Adaptive Traffic
Control Systems) currently controls 117 signalised
intersections out of 135 intersections in Bandung.
The observed intersections in this research were the
90 signalised intersections connected to SCATS,
wherein the other 27 signalised intersections were
under flashing yellow signal because of changes to
the direction of traffic (Sutandi, 2006).
also the distance between intersections. This data
was used to create a digitised Bandung road network
map and to develop a simulated Bandung road
network over the digitised network.
The traffic demand data was collected from
data recorded by the SCATS system using a mini
computer in the Bandung Traffic Control Room.
Direct road observations were also needed when the
road loop detectors were not available and to obtain
existence of policemen at intersection. Data
collection was carried out from the 90 signalised
intersections connected to SCATS in Bandung
during morning peak (7:00
–
8:00 am), afternoon
peak (4:30-5:30 pm) and off peak (10:00-11:00 am)
periods. It was repeated every 15 minutes, including
throughput data of each loop detector at each
intersection, plus queue length data from a number of
critical intersections with CCTV at each signalised
intersection for vehicle detection. Whereas, the field
travel time data was collected using floating car data
in a number of streams based on road hierarchies.
The survey was repeated between five to eight runs
on three working days (Tuesday, Wednesday, and
Thursday) during morning peak, off peak and
afternoon peak periods. The data was used to
validate the microscopic traffic simulation models
and was not required as an input to develop the
models.
The traffic control data including green time,
amber time, all red time, cycle time, traffic direction,
phases at each intersection, and possible turning
movements for each lane were also required
(Sutandi, 2006) .
Two data sets were collected for use in this
research. The first data set was used to develop and
calibrate the models and the second data set was used
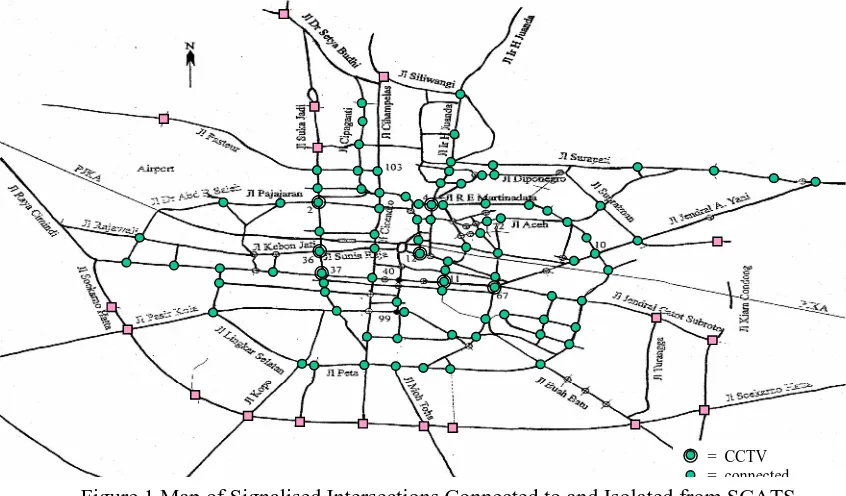
for validation. The road network map of Bandung
with intersections connected to and isolated from
SCATS control is shown in Figure 1.
Multiple Regression Analysis
Multiple Regression Analysis is used to
describe the relationship between the traffic
performance measure and the variables that
influence the performance of SCATS. This
method is also used to determine a set of
significant
variables
that
have
strong
relationships on SCATS performance. The
multiple regression equations are such as follow:
Y
int= f (X
1, X
2, X
3, X
4, X
5, X
6, X
7, X
8, X
9, X
10,
X
11,X
12, X
13, X
14, X
15, X
16)
…...….(1)
= CCTV [image:3.595.43.466.288.536.2]= connected = isolated
with,
Y
int= the performance measures at intersection
X
1= number of leg intersections
X
2= number of medians
X
3= number of splitter islands
X
4= number of phases
X
5= number of movements
X
6= the size of intersection (mean approach width:
(1) = large, > 9m ; (2) = medium, 6m - 9m ;
(3) = small, 3m-6m)
X
7= the existence of CCTV ((1) = no ; (2) = yes)
X
8= presence of enforcement at intersection
((1) = no ; (2) = yes)
X
9= the location of intersection ((1) = CBD ;
(2) = RES)
X
10= the distance to the closest intersection
((1) = < 100m ;(2) = 100m
–
200m ;
(3) = 200m - 300m ; (4) = 300m - 400m ;
(5) = > 400m)
X
11= road hierarchy ((1) = local road;
(2) = secondary collector road ;
(3) = primary collector road ;
(4) = secondary arterial road ;
(5) = primary arterial road)
X
12= the longest width of leg intersection
X
13= the shortest width of leg intersection
X
14= volume capacity ratio of major road
X
15= volume capacity ratio of minor road
X
16= level of side friction ((1) = high; (2) = low)
Y
stream= f (X
1, X
2, X
3, X
4, X
5, X
6, X
7, X
8, X
9, X
10)
…………..(2)
with,
Y
stream= the performance measures in the stream
X
1= the location of the road
((1) = CBD ; (2) = RES)
X
2= road hierarchy ((1) = local road ;
(2) = secondary collector road ;
(3) = primary collector road ;
(4) = secondary arterial road ;
(5) = primary arterial road)
X
3= lane width (m)
X
4= number of lanes
X
5= the distance to the closest intersection
((1) = < 100m ; (2) = 100m
–
200m ;
(3) = 200m - 300m ; (4) = 300m - 400m ;
(5) = > 400m)
X
6= volume capacity ratio of the road
X
7= level of side friction ((1) = high ; (2) = low)
X
8= average number of phases
X
9= the percentage of intersection with CCTV
X
10= the percentage of intersection with existence
of policemen
The
traffic
performance
measures
Y
int(throughput and queue length) and Y
stream(travel
time) were obtained from the validated microscopic
traffic simulation model whereas the geometric and
traffic conditions as the independent variables were
the observed field data.
Multiple regression analysis is carried out
during morning peak, off peak and afternoon peak
periods for both regions in Bandung, the Bandung
North Region and the Bandung South Region.
RESULTS AND DISCUSSION
The results of multiple regression analysis
during
morning peak and off peak periods are presented in
Table 1
–
2 below (Sutandi, 2006).
The further analysis were undertaken only to
the results of multiple regression analysis that have
the value of adjusted square R (R
2) more than 0.5
and the value of Durbin Watson residual test
between 1.5 and 2.5 (Lyman Ott, 2001, Dillon et. all,
1984, and Pfaffenberger et. all, 1981). Therefore, the
set of variables have not only strong relationship to
the performance measures but also significant ability
to estimate the real condition of the performance
measures.
Further Analysis Regarding The Influence Of
Significant Variables On The Performance of
SCATS
With respect to the application of a system
such as the SCATS, the analysis in this section is
very crucial. High technology built in a developed
country can be successfully implemented in a
developing country if the specific geometric and
traffic conditions there and the local traffic behaviour
are taken into account.
The results of Multiple Regression Analysis
that were presented in Table 1
–
2 above (with the
value of R
2more than 0.5 and the value of Durbin
Watson residual test between 1.5 and 2.5) clearly
showed that the performance of SCATS is positively
influenced by the local specific geometric conditions
and local traffic behaviour in the city, and therefore
the detail explanation of the relationships should also
based on the specific local conditions.
Based on these results and based on existing
geometric and traffic behaviour in Bandung, the
further analysis found that in Bandung North Region:
the drivers in Bandung causes the traffic
condition trend towards congestion during
peak and off peak periods. Lane discipline of
the drivers will increase v/c ratio of the road
and therefore, also increase the throughput at
intersection. Larger size of intersection has
wider leg intersection with higher road
capacity that might increase throughput.
Moreover, larger size of intersection provides a
space for vehicles that pass the intersection
during amber time period before the following
platoon enter the intersection. In North Region,
most intersections with the presence of
policemen at intersection have high v/c ratio.
In more detail, 9 out of 15 (60 %) intersections
[image:5.595.43.472.326.779.2]with the presence of policemen have the value
of v/c > 0.8, and 14 out of 15 (93 %)
intersections with the presence of policemen
have the value of v/c > 0.5. The drivers usually
have poor lane discipline and often pass an
intersection during amber time period. At
intersection with
very congested traffic
condition, this behaviour cause more traffic
congestion. But, the presence of policemen at
intersection will encourage people to adhere to
the
traffic
regulations.
Therefore,
at
intersections with high v/c ratio, the presence
of policemen will increase throughput at
intersection.
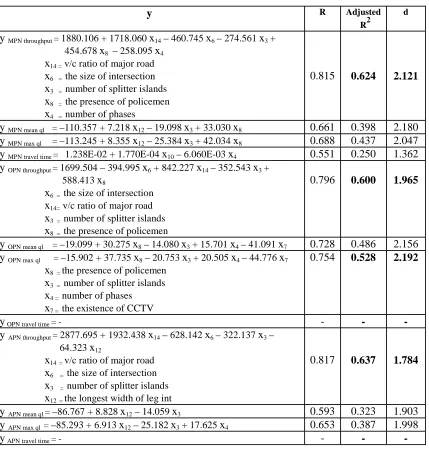
Table 1. The results of Multiple Regression Analysis between performance measures and
significant variables during morning peak (MP), off peak (OP), and
afternoon peak (AP) periods in Bandung North Region
y
R AdjustedR2
d
y
MPN throughput=1880.106 + 1718.060x
14– 460.745x
6– 274.561x
3+ 454.678x
8 – 258.095x
4x
14 = v/c ratio of major roadx
6 =the size of intersectionx
3 =number of splitter islandsx
8 =the presence of policemenx
4 =number of phases0.815
0.624
2.121
y
MPN mean ql =–110.357 + 7.218x
12– 19.098x
3+ 33.030x
80.661
0.398
2.180
y
MPN max ql =–113.245 + 8.355x
12– 25.384x
3+ 42.034x
80.688
0.437
2.047
y
MPN travel time= 1.238E-02 + 1.770E-04x
10– 6.060E-03x
40.551
0.250
1.362
y
OPN throughput=1699.504– 394.995x
6 + 842.227x
14– 352.543x
3+588.413
x
8x
6 =the size of intersectionx
14= v/c ratio of major roadx
3 =number of splitter islandsx
8 =the presence of policemen0.796
0.600
1.965
y
OPN mean ql =–19.099 + 30.275x
8– 14.080x
3+ 15.701x
4– 41.091x
70.728
0.486
2.156
y
OPN max ql =–15.902 + 37.735x
8– 20.753x
3+ 20.505x
4– 44.776x
7x
8 =the presence of policemenx
3 =number of splitter islandsx
4 =number of phasesx
7 =the existence of CCTV0.754
0.528
2.192
y
OPN travel time= --
-
-y
APN throughput=2877.695 + 1932.438x
14– 628.142x
6– 322.137x
3– 64.323x
12x
14 =v/c ratio of major roadx
6 =the size of intersectionx
3 =number of splitter islandsx
12 =the longest width of leg int0.817
0.637
1.784
y
APN mean ql=–86.767 + 8.828x
12– 14.059x
30.593
0.323
1.903
y
APN max ql=–85.293 + 6.913x
12– 25.182x
3+ 17.625x
40.653
0.387
1.998
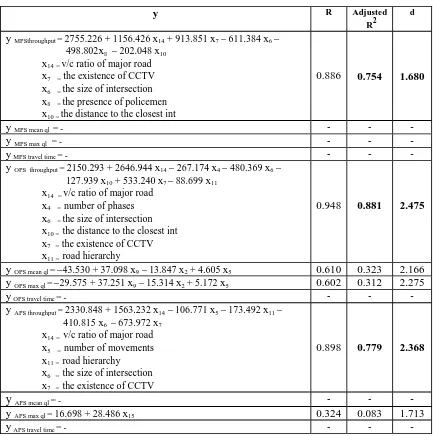
-Table 2. The results of Multiple Regression Analysis between performance measures and
significant variables during morning peak (MP), off peak (OP), and
afternoon peak (AP) periods in Bandung South Region
y
R AdjustedR2
d
y
MPSthroughput=2755.226 + 1156.426x
14 + 913.851x
7– 611.384x
6– 498.802x
8 – 202.048x
10x
14 =v/c ratio of major roadx
7 = the existence of CCTVx
6 =the size of intersectionx
8 =the presence of policemenx
10 =the distance to the closest int0.886
0.754
1.680
y
MPS mean ql= - - --y
MPS max ql = - - --y
MPS travel time= - - --y
OPS throughput=2150.293 + 2646.944x
14– 267.174x
4– 480.369x
6– 127.939x
10+ 533.240x
7– 88.699x
11x
14 =v/c ratio of major roadx
4 =number of phasesx
6 =the size of intersectionx
10 =the distance to the closest intx
7 = the existence of CCTVx
11 =road hierarchy0.948
0.881
2.475
y
OPS mean ql=–43.530 + 37.098x
9– 13.847x
2+ 4.605x
50.610
0.323
2.166
y
OPS max ql=–29.575 + 37.251x
9– 15.314x
2+ 5.172x
50.602
0.312
2.275
y
OPS travel time= - - --y
APS throughput=2330.848 + 1563.232x
14– 106.771x
5– 173.492x
11– 410.815x
6– 673.972x
7x
14 =v/c ratio of major roadx
5 =number of movementsx
11 =road hierarchyx
6 =the size of intersectionx
7 =the existence of CCTV0.898
0.779
2.368
y
APS mean ql= - - --y
APS max ql=16.698 + 28.486x
150.324
0.083
1.713
y
APS travel time= - - --
Throughput was found to decrease at
intersection with higher number of splitter
islands, higher number of phases, and the
longest width of leg intersection. Splitter
islands force the drivers to queue in the proper
lane. The vehicles that want to go straight
cannot queue in the LTOR (left turn on red)
lane. This condition decrease throughput at
intersection. This is one of specific local
conditions in Bandung. Higher number of
phases needs more time to get back to the same
phase in order to produce throughput during
the green time period. This condition decrease
throughput at intersection. At intersection in
Bandung, traffic condition on leg intersection
with the longest width usually very congested
because they lie on the road with higher road
hierarchy. In order to increase throughput and
reduce the very congested traffic condition,
wider width of the leg is needed.
[image:6.595.58.491.121.557.2]CCTV is one of the input data for SCATS
traffic control system to determine the green
time that can reduce the queue length.
Max queue length was found to increase at
intersection with the presence of policemen
and higher number of phases during off peak
period. The presence of policemen at
intersection will encourage people to adhere to
the traffic regulations, for example, not pass
the intersection during amber time period. This
condition
increases
queue
length
at
intersection. Higher number of phases needs
more time to get back to the same phase in
order to produce throughput during the green
time period. This condition will increase queue
length at intersection.
Whereas in Bandung South Region it was found that:
Throughput was found to increase at
intersection with higher v/c ratio of major
road, under CCTV surveillance, and larger size
of intersection. Similar to the Bandung North
Region condition, poor lane discipline of the
drivers causes the traffic condition trend
towards congestion during peak and off peak
periods. Lane discipline of the drivers will
increase v/c ratio of the road and therefore,
also increase the throughput at intersection.
Field data from CCTV is one of the input data
of SCATS traffic control system to determine
green time period that can increase throughput.
The condition could occur because intersection
under CCTV surveillance in Bandung South
Region was not in a congested or over
saturated traffic conditions. In saturated traffic
condition, the presence of CCTV or adaptive
traffic control system cannot help to increase
traffic performance. Larger size of intersection
has wider leg intersection with higher road
capacity that might increase throughput.
Moreover, larger size of intersection provides a
space for vehicles that pass the intersection
during amber time period before the following
platoon enter the intersection.
Throughput was found to decrease at
intersection with farther distance to the
adjacent intersection, higher road hierarchy,
the presence of policemen, higher number of
phases, and higher number of movements. The
application of SCATS was not effective at
intersections with far distance to the adjacent
intersection because long stream between 2
intersections can accommodate larger number
of traffic movements, larger number of
vehicles in the same road capacity, higher
speed, and longer queue length at intersection
without direct impact to the traffic congestion
at intersection. In these conditions adaptive
traffic
control
system
SCAT
cannot
significantly increase traffic performance,
therefore performance of SCATS was better at
intersections with close distance to adjacent
intersection. The performance of SCATS was
worse at intersections along the stream with
higher road hierarchy that usually very
congested. In this condition the presence of
adaptive traffic control system cannot increase
traffic performance. In South Region, most
intersections with the presence of policemen at
intersection have moderate or low v/c ratio. In
more detail, 2 out of 14 (14 %) intersections
with the presence of policemen have the value
of v/c > 0.8, and 9 out of 14 (64 %)
intersections with the presence of policemen
have the value of v/c > 0.5. The drivers usually
have poor lane discipline and often pass the
intersection during amber time. At intersection
with moderate or low v/c ratio, pass the
intersection during amber time will increase
throughput at intersection. The presence of
policemen at intersection will encourage
people to adhere to the traffic regulations, for
example not pass the intersection during amber
time. Therefore, at intersection with moderate
or low v/c ratio, the presence of policemen will
decrease throughput at intersection. This is one
of the local specific conditions in a large city
in a developing country. Higher number of
phases and movements needs more time to get
back to the same phase and movement in order
to produce throughput during the green time
period. This condition decrease throughput at
intersection.
Based
on
these
significant
variables,
appropriate
improvements
to
increase
the
performance of SCATS traffic control system can be
recommended.
Substantial Improvements
The recommended improvements to SCATS
fall into the following three categories:
1. Recommended improvements that can be
implemented physically.
2. Recommended improvements to encourage
drivers to adhere to traffic regulations.
3. In addition to the two categories of
recommended improvements, there are a
number of variables that also have strong
relationships and significant ability to
estimate real performance and improve the
performance of SCATS, but are difficult to
apply.
1 Recommended improvements that can be
implemented physically
The substantial improvements to increase the
performance of SCATS are such as follow:
Since higher number of phases and higher
number of movements were found to
decrease in throughput and increase in queue
length at intersections, it was recommended
to restrict the number of movements at
intersection. The movement from the road
with lower road hierarchy was prohibited to
enter the road with higher hierarchy but the
movement from higher hierarchy road was
permitted to enter the lower hierarchy road.
The
choice
of
intersections
to
be
recommended for restrictions in number of
phases and movements should be taken
seriously into account. Intersections are
chosen for a number of reasons as discussed
below:
-
the intersection is in the middle of the
stream
-
the stream has a number of in
tersections
-
the intersection has many movements
(> 10 movements)
-
there are other ways to enter the road
with higher hierarchy
-
the intersection is crossroad between
different road hierarchies that usually
more congested
In the longest width of leg at intersections in
Bandung, it was found to decrease in
throughput because these legs have lain on
the road with higher road hierarchy that
usually
very
congested.
Higher
road
hierarchy was also found to decrease in
throughput. Another analysis result indicated
that larger size of intersection that certainly
had wider width of leg at intersection was
found to increase in throughput. However,
building wider leg intersection or additional
road capacity physically has a number of
challenges, particularly in large city in
developing country that has high population
density, limited land area and limited
financial support. Furthermore, building
additional road capacity is not the right
solution to increase the performance of
SCATS. Based on the condition, in order to
increase throughput at intersection, it was
recommended to make the width of leg
intersection wider by changing two-way road
into one-way road if there was an alternative
road
with
the
same
hierarchy
to
accommodate vehicles from the changed
direction. The one-way road not only caused
the leg wider but also reduced number of
phases and number of movements at
intersection.
Since the performance of SCATS was found
worse at intersections with far distance
(300m-400m, > 400m) between adjacent
intersections, it was recommended to change
these intersections under SCATS to be under
Fixed Time traffic control system. The
intersections that were recommended to be
under Fixed Time traffic control system were
intersections that had worse performance for
all performance measures under SCATS
traffic control system. The performance
measures including throughput and queue
length at intersections and density, speed,
travel time, delay time, stop time and
number of stops in the streams, as the output
of the models.
2 Recommended improvements in order to
encourage drivers to adhere to the traffic
regulation are as follows:
Lane discipline of drivers will increase v/c
ratio of the road and therefore increase
throughput
at
intersections.
Since
intersections with high v/c ratio of the major
road were found have increased throughput,
efforts should therefore be made to
encourage people to adhere to the traffic
regulations, in particular, to lane discipline.
throughput, the presence of policemen at
intersections is still needed to encourage
people to adhere to the traffic regulations.
3 Variables that have strong relationship to the
performance
measures
in
increasing
the
performance of SCATS, but are difficult to
apply. The variables are as follow:
Larger size of intersection was found to
increase throughput at intersection, but as
was
previously
mentioned,
building
additional road capacity has a number of
challenges, particularly in a large city in a
developing country that has high population
density, limited land area and limited
financial
support.
Moreover,
building
additional road capacity is not the right
solution to increase the performance of
SCATS. Larger sizes of intersections (that
certainly has wider width of leg) were found
to increase throughput. Wider width of leg
intersection can be achieved by changing
two-way roads into one-way roads, as was
recommended previously.
Higher number of splitter islands was found
to decrease throughput at intersections
because they force the drivers to queue in the
proper lane. The vehicles that want to go
straight cannot queue in the LTOR (left turn
on red) lane. This decreases throughput at
intersections, however the existence of
splitter islands has to be maintained to
encourage people to queue in the proper
lane.
CONCLUSIONS
This study evaluated the relationships between
the traffic performance measures and the significant
variables that influence the performance of advanced
traffic control system SCATS in Bandung during
peak and off peak periods. The variables that might
have significant influence on the performance
measures are classified into three categories:
variables related to the geometric and traffic
conditions of intersections, variables related to the
geometric and traffic conditions of the road network
and variables related to the specific local conditions
in the large city, for example traffic behaviour. The
traffic performance measures were obtained from the
validated microscopic traffic simulation models,
whereas the geometric and traffic conditions as
independent variables were the observed field data.
Multiple regression analysis was used to describe the
relationship between the traffic performance measure
and the selected set of variables and to determine the
significant variables that influence the performance
of SCATS. The results of multiple regression
analysis that were discussed above clearly showed
that the performance of SCATS is positively
influenced by the local specific geometric conditions
and local traffic behaviour in the city. The
recommended
improvements
to
increase
the
performance of SCATS should be based on the
significant variables and based on specific local
conditions in order to be realistic in application, for
instances: restriction in number of phases and
movements, changing two-way road into one-way if
there is alternative road, change intersections far
from adjacent intersection under SCATS to be under
Fixed Time. Further detail analysis is beneficial to
obtained detailed results of implementation of
recommended improvements. The findings of this
study are believed to be applicable not only to
Bandung, but also beneficial for other large cities in
Indonesia and other developing countries that have
similar specific local conditions.
REFERENCES
AWA Plessey (1996a), Bandung Area Traffic
Control, SCATS Presentation and "Before"
Traffic Study Details, Directorate General of
Land Transport, Ministry of Communications,
Government of Republic of Indonesia.
AWA Plessey (1996b), Bandung Area Traffic
Control, Final System Design, Directorate
General of Land Transport, Ministry of
Communications, Government of Republic of
Indonesia.
Dillon, William R., Goldstein, Matthew (1984),
Multivariate
Analysis
Methods
and
Applications, John Wiley and Sons, USA.
ITS Australia (2005). Intelligent Transportation
System Australia [online] Available from
http://www.its-australia.com.au/
Mason, Robert L., Gunst, Richard F., Hess, James L.
(2003), Statistical Design and Analysis of
Experiments with Applications of Engineering
and Science, 2
ndedition, John Willey and Sons
Hoboken, New Jersey.
Morichi, Shigeru (2005), Long-term Strategy for
Transport System in Asian Megacities,
Journals of the 6
thEastern Asia Society for
Transportation
Studies,
International
Conference in Bangkok, Thailand, September
2005, pp. 1
–
21, K-WING 6F, 2-1, Kojimachi
5 chome, Chiyoda-ku, Tokyo, 102-0083,
Japan.
Ott, R. Lyman, Longnecker, Michael (2001), An
Introduction to Statistical Methods and Data
Analysis, 5
thedition, Duxbury 511 Forest
Lodge Road Pacific Grove, CA 93950, USA.
Pfaffenberger, Roger C. and Patterson, James H.
(1981), Statistical Methods, Richard D.
Irwin, Inc. Homewood, Illinois 60430,
Unites States of America.
Sutandi,
A.
Caroline
(2006),
Performance
Evaluation of Advanced Traffic Control
Systems In A Developing Country, Ph. D
Dissertation (The University of Queensland,
Brisbane, Australia).
Sutandi., A. Caroline, Dia, Hussein
(2005a),
Performance Evaluation of An Advance
Traffic Control Systems in A Developing
Country, Proceedings of the 6
thEastern Asia
Society
for
Transportation
Studies
International
Conference
in
Bangkok,
Thailand, September 2005, pp. 1572
–
1584,
345, K-WING 6F, 2-1, Kojimachi 5 chome,
Chiyoda-ku, Tokyo, 102-0083, Japan.
Sutandi., A. Caroline, Dia, Hussein, December
(2005b), Evaluation of the Impacts of Traffic
Signal Control Parameters on Network
Performance, Proceedings the 27
thConference
of the Australian Institutes of Transport
Research, , December 2005, Queensland
University of Technology, Brisbane, Australia.
TSS
(2004a),
Transport Simulation Systems,
available from http://www.tss-bcn.com
TSS (2004b), GETRAM Manual, Open Traffic
Simulation Environment, February 2004,
available from
http://www.aimsun.com/v4.2/Manual.zip
U.S. Department of Transportation (2005), Benefit of
Integrated Technologies and The National ITS
Architecture [online] Available