Efficacy of NETDC (New England Trophoblastic Disease Center)
prognostic index score to predict gestational trophoblastic tumor from
hydatidiform mole
Khrismawan*, Agustria Zainu Saleh*, Rizal Sanif*, Theodorus**
Abstrak
Penelitian longitudinal prospektif analitik untuk menilai ketepatan prediksi timbulnya penyakit trofoblas ganas melalui sistem penilaian prognosis mola hidatidosa yang dikembangkan oleh NETDC (New England Trophoblast Disease Center) telah dilakukan. Di antara parameter faktor risiko yang dinilai; usia penderita, jenis mola hidatidosa, pembesaran uterus, kadar hCG serum, kista lutein, serta ada-tidaknya komplikasi merupakan factor risiko yang bermakna untuk timbulnya keganasan setelah mola hidatidosa dievakuasi (p=0,032). Penelitian dilakukan pada 50 penderita mola hidatidosa dengan pengamatan lanjutan selama 1 tahun (Januari 2001-Desember 2002) di Bagian Obstetri dan Ginekologi RS Mohammad Hoesin, Palembang. Hasilnya menunjukan prediksi keganasan skor NETDC 50% pada risiko tinggi dan 10% risiko rendah untuk berkembang menjadi ganas (p<0,05). Hasil ini lebih besar dibandingkan dengan nilai yang diajukan WHO yaitu 19-30%. Risiko untuk terjadinya keganasan pasca mola hidatidosa pada kelompok risiko tinggi ialah 9,0 kali lebih tinggi disbanding pada kelompok risiko rendah (CI: 1,769-45,786). (Med J Indones 2004; 13: 40-6)
Abstract
A prospective longitudinal analytic study assessing the efficacy of NETDC (New England Trophoblastic Disease Center) prognostic index score in predicting malignancy after hydatidiform mole had been performed. Of the parameter evaluated; age of patients, type of hydatidiform mole, uterine enlargement, serum hCG level, lutein cyst, and presence of complicating factors were significant risk factors for malignancy after hydatidiform mole were evacuated (p<0.032). The study were done on 50 women diagnosed with hydatidiform mole with 1 year observation (January 2001-December 2002) at the Department of Obstetrics and Gynecology, Mohammad Hoesin Hospital, Palembang. The results showed that the NETDC prognostic index score predicted malignancy in 50% of high risk group and 10% in low risk group (p<0.05). This showed a higher number than that found by the WHO (19%-30%). The risk for incidence of malignancy after hydatidiform mole in the high risk group is 9.0 times higher compared to that of the low risk group (CI: 1.769-45.786). (Med J Indones 2004; 13: 40-6)
Keywords: New England Trophoblastic Disease Center (NETDC), gestationaltrophoblastic tumor, hydatidiform mole, high and low risk.
Gestational trophoblastic tumors (GTTs) are rare but highly curable tumors arising from the products of conception in the uterus. The prognosis for cure of patients with GTTs is good even when the disease has spread to distant organs, especially when only the lungs are involved. The probability of cure depends on the histologic type (mole, invasive mole, or choriocarcinoma), the extent of spread of the
disease, the level of the human chorionic gonadotropin (hCG) titer, the duration of disease from initial pregnancy event to start of treatment, the specific sites of metastases, the nature of antecedent pregnancy, and the extent of prior treatment. Selection of treatment on these factors plus the patient’s desire for future pregnancies. Human chorionic gonadotropin, produced normally during pregnancy, is abnormally elevated in the blood and urine of patients with this group of diseases and is a sensitive marker to indicate the presence or absence of disease before, during and after treatment.1,2
The most common antecedent pregnancy is that of a hydatidiform mole, usually a genetic disorder of
* Department of Obstetrics and Gynecology, Faculty of
Medicine, Sriwijaya University, Palembang, Indonesia
**
pregnancy in which only placental-like tissue is present. The patient will present with abnormal bleeding from onset of pregnancy and may have a uterus which is much larger than expected. Sonography is the preferred method of diagnosis, and suction curettage is the preferred method of evacuation. Of most importance is careful follow-up with serum beta HCG (βhCG) weekly until less than 100 mIU/mL and then every two weeks. The patient should have a careful pelvic examination every other week and a chest x-ray every 4-6 weeks. Once the titer of serum βhCG has fallen to normal levels, these two examinations need no longer be done; however, βhCG titers need to be repeated every 2 weeks for 3 months, then monthly for 3 months, then every 2 months for 6 months, then every 6 months for 3 years. Each patient should be counseled in the use of a reliable birth control method. Any patient who develops an increasing level of serum βhCG, a plateau of the βhCG over 3 weeks, or persistent elevation of βhCG after 16 weeks of follow-up should be considered as having gestational trophoblastic tumor and should undergo the appropriate work-up and treatment. Similarly, any patient who develops metastatic disease during follow-up should be staged and undergo treatment.2,3
Various classification systems for gestational tropho-blastic tumors (GTTs) have been applied. An anatomical staging system has been adopted by FIGO (International Federation of Gynecology and Obstetrics). In addition, the NETDC (New England Trophoblastic Diseases Centre) has proposed a prognostic scoring system for the determination of therapy. There has, however, been a lack of uniformity in the use of these systems.
MATERIAL AND METHODS
This study includes patients with hydatidiform mole diagnosed in Mohammad Hoesin Hospital Palembang, from January 2001 to December 2002. The patients divided into high and low risk for NETDC prognostic score with determining factors were type of hydatidiform mole, uterine enlargement, lutein cyst, age and abcent or present factors correlated with hydatidiform mole. The patients with hydatidiform mole included in this study were those evacuated at Dr. Moh. Hoesin Hospital. Before that the patients will take the blood sample for βHCG serum examination and other clinical and laboratory examination to determine high and low risk. The patient will be closely follow up for a year to observe malignancy after hydatidifom mole evacuated.
We computed relative risk as estimators of high and low risk, together with their 95% approximate confidence interval. A 2
test was used to compare the distribution of various patient characteristics in the two risk score group. Logistic regresion will be determine what is the factor was influence to malignancy. A significance level of .05 was chosen. However, because adjustment for most covariates and important prognostic score in NETDC score, we present estimates high and low risk for occur malignancy after evacuated hydatidiform mole. The data were analyzed using the program package SPSS 11.5 for windows.
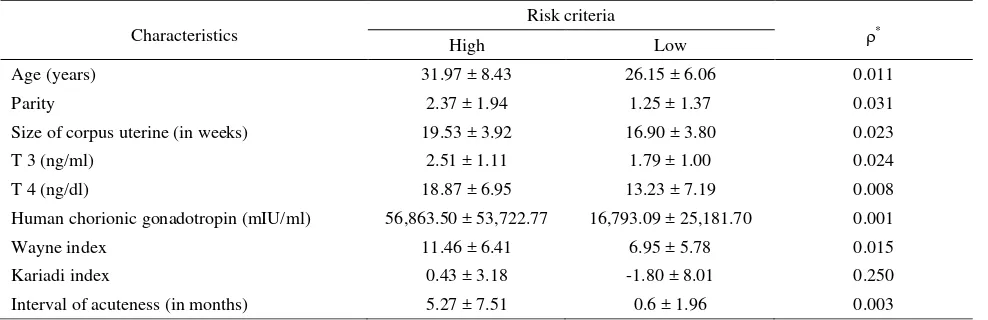
Table 1. Characteristics
* Student t test. (mean ± SD) Significant < 0.05
Characteristics
Risk criteria
*
High Low
Age (years) 31.97 ± 8.43 26.15 ± 6.06 0.011
Parity 2.37 ± 1.94 1.25 ± 1.37 0.031
Size of corpus uterine (in weeks) 19.53 ± 3.92 16.90 ± 3.80 0.023
T 3 (ng/ml) 2.51 ± 1.11 1.79 ± 1.00 0.024
T 4 (ng/dl) 18.87 ± 6.95 13.23 ± 7.19 0.008
Human chorionic gonadotropin (mIU/ml) 56,863.50 ± 53,722.77 16,793.09 ± 25,181.70 0.001
Wayne index 11.46 ± 6.41 6.95 ± 5.78 0.015
Kariadi index 0.43 ± 3.18 -1.80 ± 8.01 0.250
RESULTS
Seventy cases of hydatidiform mole (40 occurred in 2001 and 30 in 2002) and 69 cases of gestational trophoblastic tumor were diagnosed between January 2001 and December 2002. In addition, seventeen patients at the very beginning were diagnosed as having hydatidiform mole. The ratio of hydatidiform mole at Moh. Hoesin Hospital of Palembang was 1 to 43.375 deliveries and 1 to 57.45 pregnancies in 2001, and 1 to 44.3 deliveries and 1 to 64.90 pregnancies in 2002.
The average age of the patients in this study was 29.64 ± 8.04 years and the most dominant group was in the range of 20-35 years. Age difference average in the high risk group (31.97 ± 8.43 years) and in the low risk group (26.15 ± 6.06 years) showed a significant indication (ρ < 0.05). The average of marital duration was 8.08 ± 7.63 years. The high risk group showed a higher parity average of 2.37 ± 1.94 than that of the low risk group (1.25 ± 1.37) (ρ = 0.031). Most of the patients (90%) had low educational back-ground, and 80% had no jobs. Their husbands also had low educational background and 48% were laborers. Thirty six patients (72%) live in the urban areas and 14 patients (28%) live outside the urban areas. Their sistolic blood pressure average was 125.33 ± 17.01 mmHg in the high risk group and 115.50 ± 17.01 mmHg in the low risk group. Their pulse average was 102.67 ± 17.93 in the high risk group and 96.20 ± 12.56 in the low risk group. Their breathing average was 23.07 ± 2.77 and 22.90 ± 2.63 respectively. There was no significant difference in all these variables (ρ > 0.05).
Based on the last menstruation period, pregnancy length of the high risk group was 12.77 ± 4.07 weeks ; this was a little bit higher than that of the low risk group (14.50 ± 2.35 weeks)(ρ > 0.05). In contrast, in fundal height, it showed the following data (19.53 ± 3.9 weeks for the high risk group and 16.90 ± 3.81 weeks for the low risk group) (ρ < 0.05). In terms of uterine fundal height, the average pregnancy length was higher than the first day of the last menstruation period (ρ < 0.05).
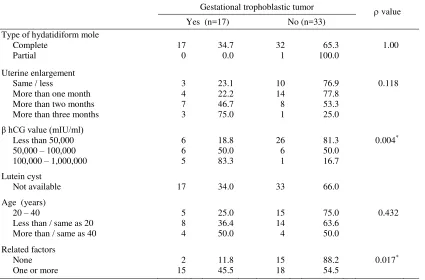
The number of patients and their husbands having O blood group was 52 % and 38.5 % became gestational trophoblastic tumor (ρ > 0.05). Eight patients (33.3 %) having anemia became gestational trophoblastic tumor, and nine patients (34.6%) had no anemia. Nine patients (10%) showed positive urine proteins, and the rest showed the negative ones. Three patients (6%) showed positive acetone urine and 47 (94%) did not. There were no correlation between blood group, anemia, protein urine, or acetone urine and gestational trophoblastic tumor (ρ > 0.05). Average T3 composition was 2.22 ± 1.11 ng/ml and that of T4 was 18.87 ± 6.95 ug/dl. T3 and T4 contents showed differences in the high risk and low risk groups (ρ < 0.05). There were no significant correlation between Wayne index and the risk grouping (ρ > 0.05). The Index showing hyperthyroid (57.1%) indicated that they would suffer gestational trophoblastic tumor (ρ < 0.05). The Kariadi index showed that 11 patients (55%) suffering thyrotoxycosis and six patients (20%) having euthyroid would undergo gestational trophoblastic tumor (ρ < 0.05) (Table 2). Pathologically, all high risk patients suffered complete hydatidiform mole, 34.7% of them experienced gestational tro-phoblastic tumor, and only one of them had partial hydatidiform mole (ρ > 0.05).
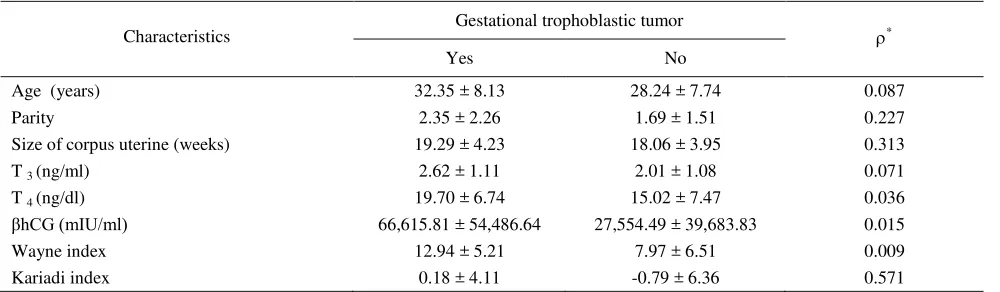
Table 2. Gestational trophoblastic tumor
*
Student t test. Average score (mean ± SD) hCG (Human Chorionic Gonadotropin). Significant < 0.05
Characteristics Gestational trophoblastic tumor *
Yes No
Age (years) 32.35 ± 8.13 28.24 ± 7.74 0.087
Parity 2.35 ± 2.26 1.69 ± 1.51 0.227
Size of corpus uterine (weeks) 19.29 ± 4.23 18.06 ± 3.95 0.313
T 3 (ng/ml) 2.62 ± 1.11 2.01 ± 1.08 0.071
T 4 (ng/dl) 19.70 ± 6.74 15.02 ± 7.47 0.036
βhCG (mIU/ml) 66,615.81 ± 54,486.64 27,554.49 ± 39,683.83 0.015
Wayne index 12.94 ± 5.21 7.97 ± 6.51 0.009
As for hCG, high risk patients showed an average of 56,863.50 ± 53,722.77 mIU/ml and the low risk ones 16,793.09 ± 25,181.70 mIU/ml and they significantly turned into sufferers of gestational trophoblastic tumor (ρ < 0.05). Fifty eight percent of the patients with a ß hCG concentration of over 50,000 mIU/ml and 21.2% with that of less than 50,000 mIU/ml suffered gestational trophoblastic tumor (ρ < 0.05). NETDC prognostic scores obtained through a univariate regression analysis indicated that only the variable of ß hCG serum concentration and medical factors had significant traces of the occurrence of gestational trophoblastic tumor (ρ < 0.05). A further analysis showed the dominance of hCG only (ρ = 0.02). In general, the variables above had an influence in the occurrence of gestational trophoblastic tumor (ρ = 0.032).
Based the NETDC prognostic scores, it was found that 50 % of hydatidiform mole occurred to the high risk group (a score of ≥ 4) and 10% to the low risk group (a score of < 4) that led to gestational trophoblastic tumor (ρ < 0.05). The high risk group suffered nine times higher than the low risk group (confidence interval: 1.769 – 45.786) (Table 3).
Table 3. Risks of hydatidiform mole turning into gestational trophoblastic tumor
Risks grouping
Gestational trophoblastic tumor
Yes No
High 15 50.0% 15 50.0% 30
Low 2 10.0% 18 90.0% 20
17 60.0% 33 40.0% 50
2 =8.556 RR:9.0 (CI:1.769-45.786)=0.003
Average time intervals between the diagnose of hydatidiform mole and gestational trophoblastic tumor was 10.00 ± 7.28 months. The interval for the high risk group was 6.00 ± 2.83 months and the low risk group 10.53 ± 7.57 months (ρ = 0.426).
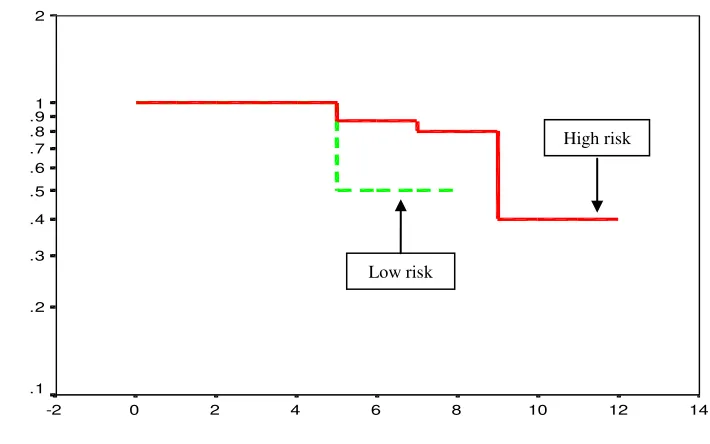
Within the 12-month observation, the high risk group showed a less survival rate than the low risk group (40% to 50%) but in the fifth months, the high risk group showed a higher survival rate (86.67% to 50%). This difference cannot be statistically proved (ρ = 0.710). (Figure 1).
Waktu menjadi PTG (bulan)
14 12
10 8
6 4
2 0
-2 2
1 .9 .8 .7 .6
.5
.4
.3
.2
.1
Times for being gestational trophoblastic tumor (months)
Figure 1. Bold straight lines indicate high risk criteria, and dotted lines low risk criteria Low risk
High risk
Survi
Twenty eight percent of the patients were evacuated by curettage, 16% percent with hysterectomy and 2% curettage-hysterectomy. Thirty six point six percent of curettage cases and 25% of hysterectomy cases developed into malignancy cases (ρ > 0.05). It was proved that hysterectomy could not fully prevent the malignancy cases from attacking post-hydatidiform mole patients.
DISCUSSION
Determination of hCG concentration with positive reaction pregnancy test was not pathognomonic. Hydatidiform mole was suspected when the pregnancy test solution was positive at 1/200. The hCG con-centration was more frequently used for a prognostic factor. A hCG concentration of more than 100,000 mIU/ml is used as one of the high risk criteria that indicates the presence of post-hydatidiform mole.4,5,6,8
Maternal age is constantly identified as a high risk factor. Presence of a specific age is depicted in the J curve: young age is the most dominant and the number of patients over 40 years is dramatically high.5,6,7 This research shows the most dominant group age falls between 20 and 35, 20 is the most frequently-tabulated age, namely 7 patients. Many references state that the group range in which hydatidiform mole occurs generally falls at the extreme reproductive age. Its distribution is usually depicted as the J curve. However, this research results in a rather different distribution; it is depicted in the parabola curve.
It was found that hydatidiform mole occurred most in the 2-5 parity group (48%). Only 4% occurred in the 6 or over parity group. In general, this distribution showed an enlarging curve that concurrently increased along with the increase in parity but suddenly lowered down as it reached at the 5 parity.9
The data shows that the length of pregnancy examined based on the fundus uteri height was bigger than that based on the last menstruation period. This fits the description of hydatidiform mole in general; 50% of hydatidiform mole uterine is much larger than the real length of pregnancy. The difference in the high risk group is big enough (6.76 weeks) whereas the one in the low risk group is small (2.40 weeks). These two differences are statistically significant (ρ < 0.05)
Forty to fifty percent of the patients with complete hydatidiform mole showed an enlargement of uterus
more than 4 weeks, which differed from that of the last menstruation period.10-13 Uterine enlargement was caused by the expansion of hyperplasia tropoblast and the bleeding of uterine cavity. Although this uterine enlargement - compared to the real length of pregnancy - was a regular clinic manifestation, 15% to 40% of the patients originally had a small uterine than gestational age.
Average T3 concentration in this research is 2.22 ±
1.11 ng/ml whereas that of T4 is 18.87 ± 6.95 ug/ml
(normally T3 range is 0.8 – 2 ng/ml, and T4 range 4 –
12 ng/dl). The two values were above the normal ones. Clinical evidence of hyperthyroid presence as an indicator of complete hydatidiform mole was found in 2% to 7% percent of the patients.14,15 They showed symptoms and signs of enlarging thyroid, tachycardi, febris, and tremor, and critical thyroid sometimes appeared. The evidence that hCG concentration proves as a thyrotropic factor in stimulating the surge of thyrotoxicosis is still a question for further research.
It was found that there was no correlation between the Wayne index value and the grouping of patients with hydatidiform mole (ρ > 0.05). However, the Wayne index indicated the presence of more thyroid in the high risk group (85.7%) than in the low risk group (14.3%). The Kariadi index showed that 60% of hydatidiform mole patients suffered euthyroid and 40% thyrotoxicosis. Sixteen patients (53.3%) with euthyroid and 14 patients (70%) with thyrotoxicosis fell in the high risk criteria. It could be also seen that, based on the Kariadi Index, the number of thyrotoxicosis patients is larger than that of euthyroid ones although this significant difference cannot be proved statistically (ρ > 0.05).
into gestational trophoblastic tumor (ρ < 0.05). The pre-evacuation ß hCG concentration of hydatidiform mole patients that became gestational trophoblastic tumor was higher. It could also noticed that 58.8% of the patients with ß hCG concentration over 50,000 mIU/ml then suffered gestational trophoblastic tumor. Only 21.2% of the patients showed a ß hCG concentration less than 50,000 mIU/ml.
The analysis of statistical logistic regression showed that the ß hCG serum concentration variable and presence or absence of other medical factors played a role in causing gestational trophoblastic tumor to develop (ρ < 0.05). In general all these variables affected the development of gestational trophoblastic tumor as shown by the ρ value of 0.032. A further analysis showed that only the ß hCG constituted a dominant factor (ρ = 0.02).
The NETDC prognostic scores showed that 50% of high risk hydatidiform mole cases developed into malignancy cases whereas 10% of those of low risk ones developed into the malignancy.
The gestational trophoblastic tumor did not only develop from hydatidiform mole, but also from cases of pregnancies and post-abortus. Several prognostic scores were created as a means of predicting the acuteness of post-hydatidiform mole. Bagshawe and WHO pioneered the development of these prognostic scores. In general, it is agreed that 19% to 30% of high risk hydatidiform mole cases will develop into malignancy cases while that of low risk constitute 5% to 10%. This study shows that the presence of gestational trophoblastic tumor in the high risk group is nine times higher than that of the low risk group. (Confidence interval: 1.769 – 45.786).
The average time intervals between the hydatidiform mole diagnosis and the finding of gestational trophoblastic tumor for all patients was 10.00 ± 7.28 months: the average of 6.00 ± 2.83 months for the high risk group and 10.53 ± 7.57 months for the low risk group (ρ = 0.426). It could be seen that the 12 -month observation on the high risk group demonstrated a lower survival rate than the low risk group (40% : 50%).
Table 4. NETDC prognostic scores of gestational trophoblastic tumor
Data are presented in percentage (%)
*
Univariate logistic regression
Gestational trophoblastic tumor value
Hydatidiform mole are treated by the evacuation of mole tissues and close follow up examination of ß hCG concentration quantitatively. Approximately 90% of complete hydatidiform mole cases and 90%-95% of partial hydatidiform mole cases showed spontaneous regression without being treated with chemotherapy. In this study, 82% of the patients were treated by evacuate, namely curettage, 16% by hysterectomy, and 2% by a combined curettage-hysterectomy. After the treatment of curettage, 15 patients (36.6%) then suffered gestational trophoblastic tumor and 25% of hysterectomized patients experienced the malignancy too. Hysterectomic treatments did not prevent the disease from developing. Two patients (25%) who were hysteroctomized still suffered gestational trophoblastic tumor. After curettage, 15 patients (36.6%) experienced the malignancy of the disease. No malignancy occurred to the patients who were treated with curettage followed by hysterectomy.
Summary
Predictive or prognostic score of post-hydatidiform mole based on the high- and low-risk grouping was still high. The malignancy experienced by patients of the high risk group is nine times higher than those of the low risk group. Special effort to detect this malignancy as early as possible and thus reduce the number of the high risk patients is crucial; it will decrease the number of diseases and death caused by complication and/or malignancy.
REFERENCES
1. Bagshawe KD. Trophoblastic tumour : Diagnostics methods, epidemiology, clinical features and management. In : Monaghan JM, Morrow CP, Tattersall MH. Gynecologic oncology fundamental principles and clinical practise. 2nd
ed. Edinburg : Churchill Livingstone; 1992.p.1027-43
2. Martaadisubrata D. Problematik penyakit trofoblas ditinjau dari epidemiologi serta pengelolaannya. Bandung : Universitas Padjadjaran, 1980 : 1-130
3. Paradinas FJ. Pathology and classification of trophoblastic tumors. In: Coppleson M. Gynecologyc oncology. 2nd ed. London: Longman Group Ltd; 1992.p.1013-26
4. Hidayat YM, Martaadisubrata D, Bratakoesoema DS. Peranan faktor risiko terjadinya keganasan pascamola hidatidosa di RSHS Bandung 1989-1990. Bandung : Kumpulan makalah KOGI X, 1996:154-64
5. DiSaia PJ, Creasman WT. Clinical gynecologic oncology. 3rd ed. Washington DC: The CV Mosby Company; 1989:214-41
6. Chin HG. On call obstetric and gynecology. 1st ed. Philadelphia : WB Saunders Company; 1997:229-38 7. Sasotya S, Bratakoesoema D. Pengalaman penggunaan
sistem skoring sebagai penduga keganasan pascamola hidatidosa. Bandung : Kumpulan naskah ilmiah PTP POGI X Ujung Pandang 1997 : 227-38
8. O’Quinn AG, Barnard DE. Gestational trophoblastic disease. In : De Cherney AH, Pernoll ML. Current obstetric and gynecologic diagnosis and treatment. 8th ed. Norwalk : Appleton & Lange; 1994.p.967-76
9. Parazzini F, Mangili G, Vecchia LC. Risk factor for gestational disease : A separate analysis of complete and partial hydatidiform moles. Obstet Gynecol 1991; 78: 1039-44
10. Kurnia K. Hubungan antara defisiensi vitamin A dengan molahidatidosa. Jakarta : Bagian Obstetri dan Ginekologi Fakultas Kedokteran Universitas Indonesia; 1991 11. Kurnia K, Andriono, Asikin N. A case control study of
vitamine A level in hydatidiform mole. Med J Indones 1997; 6: 153-7
12. Parazzini F, Vecchia LC, Mangili G. Dietary factors and risk of trophoblastic disease. Am J Obstet Gynecol 1988; 158: 93-9
13. Brinton LA, Wu BZ, Wang W. Gestational trophoblastic disease : A case-control study from the People’s Republic of China. Am J Obstet Gynecol 1989; 161: 121-7 14. Berkowitz RS, Cramer DW, Bernstein MR. Risk factors
for complete molar pregnancy from a case-control study. Am J Obstet Gynecol 1985; 152: 1017-20