DOI: 10.12928/TELKOMNIKA.v14i2A.4355 372
Analysis of Hot Topics on Microblog Based on Findings
and Social Governance
Chan Xu*1, Rodrigo Moreno2 1
Wuhan University of Technology, Wuhan, 430070, China
2 Teledyne Scientific Company, Leon, France
*Corresponding author, e-mail: [email protected]
Abstract
In the finding of hot topics on microblog, the short text, less word, non-standard word use and other features of microblog have made the traditional identification method of hot topic powerless. To solve this problem, discovery method of microblog hot topic based on speed increase has been put forward. First, divide pretreated microblog according to windows with equal quality, count word frequency of each word in each window and express as two-tuple sequence of time; then calculate increase slope of each word in every two adjacent windows to find words with faster increasing speed; later calculate increasing speed of users and article number of microblogs related to the word to make sure whether the word is hot subject term; finally produce hot topic from the cluster of hot subject term. The feasibility of this method has been verified by experiment. Experimental results show that this method has improved identification efficiency and lowered omission ratio and fall-out ratio, which can effectively and promptly discover the hot topic of microblog.
Keywords: Topic identification; Two-tuple sequence of time; Hot topic of microblog; Analysis on public sentiment
Copyright © 2016 Universitas Ahmad Dahlan. All rights reserved.
1. Introduction
As a new research direction of information retrieval, topic identification aims to monitor reports to realize automatic identification [1] for new topics in information stream of news media. Comparing with information retrieval, information extraction, text mining and several cross-over studies, topic identification puts more emphasis on discovery ability of new information, and concerns information related to a particular topic rather than relatively broad subject categories. Frequently-used topic models include vector space model (VSM) and Language Model (LM) currently. Vector space model is a topic model based on bag-of-words description and language model is probabilistic model [2] [3]. Typically, researches of topic identification focus on clustering algorithm of relevant reports. CMU [4], Weihua Luo [5], Xiang-Ying Dai [6], Bin Ma and others all use clustering algorithm for topic identification. The defect of clustering algorithm is that complexity of time and space is relatively high, and the quality of clustering center directly affects the accurate identification of follow-up reports. Apart from clustering method, probabilistic method can also be used for topic identification. Loulwah Alsumait has used empirical Bayes Theorem in topic identification [8,9], but the relevant researches are very few.
2. Discovery Model of Hot Topic on Microblog
In basic belief network model [10-12], the term set , , … , is a discourse, and has defined sample space for belief network model. ⊂ is a subset of , and g ⟺ ∈ . Every index term is considered as a basic conception, thus is seen as a concept space and concept is the subset of . Document and user queries are expressed with the concept of concept space .
Probability distribution defined on sample space is shown below. is a concept on , which means a document or a user query.
(1)
( ) ( | ) ( )
u
p c p c u p u
(2)
Equation (1) defines p c as coverage degree of c in spaceU; equation (2) represents that all concepts in concept space have equal probability to occur.
Figure 1 shows the topological structure of basic belief network; query qis modeled as
network node associated with random variable of binary system; node which constitutes term of query concept points to query node . Document is also modeled as network node associated with random variable of binary system; node which constitutes term of query concept points to document node .
The sorting of document related to given query is understood as a concept matching relationship, which reflects the coverage degree of concept provided by concept . Therefore, use | to calculate the sorting of document concerning query in belief network. According to conditional probability, formula (2) and Bayes Theorem, this can be obtained:
is a normalization factor wherein. Different provisions on | probability and will correspond to sorting policies of different information retrieval models.
Figure 1. Basic belief network
3. Identification Model of Hot Topic on Microblog 3.1. Modeling Basic
Topic identification model on the basis of Bayesian Belief Network proposed by the work is based on the following basic work:
(1) Apply terminology bank of reportS
sk ,sk , ,sk1 2 n
built through samples reports.Certain word segmentation technology can be use in its establishment process to obtain some terms to represent each sample reportsi. The weight of term can be calculated by formula (4).
(2) Terminology bank of event built; each event is composed by several reports. It is more complicated if simply use feature items of all reports belonging to the event to represent, so certain methods can be used in this step to simplify set of report term, and then obtain set of event term. We can reselect the first feature items with more weight to constitute set ′ from selected feature items of each report to describe event which it belongs, namely:
x
x 1 2 n
e S'
E e ek ,ek , , ek
(5)
The weight of term s kp q in set ex is mainly based on the calculation of frequency
appearing in report which it belongs, but all reports are developed around a core report. Thus in event description, the weights of terms appearing in core reports shall be increased. Increasing method proposed by formula (6) can be adopted:
p q p q
w e k w s k (6)
Wherein, w( e k )p q is the weight of term e kp q in eventep;w( s k )p q is the weight value of
term s kp q in core reportsp; is a factor for increasing, and its value is more than 1.
(3) Topic bank builtTt ,t , t1 2 r . Its establishment method is similar to the establishment
from terminology bank of report to terminology bank of event. Description terms of each topic ti
in topic bank root in the corresponding terminology bank of event, and these terms can be obtained by the partial extraction principle above. As for the weight calculation of term in topicti,
increasing strategies given by formula (6) can also be adopted; that is, if term kjdescribing topic
i
t comes from core events, then its weight is:
ij p q
w w e k 1 (7)
3.2. Topological Structure and Probability Calculation of Model
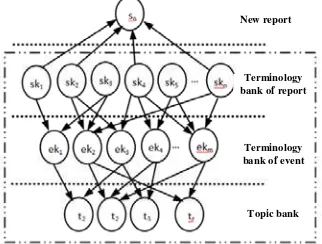
Based on built terminology bank of report, terminology bank of event and topic bank, topological structure of belief network model that is suitable for topic identification has been established in the work as shown in Figure 2; and probability calculation for the identification of new report sn has been provided. Decide whether sn is existing topic or new seeded topic
through the comparing of threshold values.
Terminology bank of report
Terminology bank of event
Topic bank New report
Figure 2. Belief network for topic identification
The nodes in the figure include four parts which respectively represent new report sn,
pointing directions of arcs indicate index relationship, for example, term sk1,sk2,sk4,skn in
terminology bank of report all have arcs pointing to new report, thus. It can be found from above figure that the whole network is belief network, but the part enclosed by gridlines is inference network; thus relevant knowledge has also been involved during the inference procedure of probability. Assuming that prior probabilities of all topics ti are equal and based on Bayesian
probability, conditional independence assumptions and related knowledge of inference network, the following formula can be obtained:
i n n i
Wherein, is the subset of set of report term; is a normalization factor; the premise of above formula establishment is to assume that the occurrence of all subsets occur at an equal probability. Conditional probability P t |ei , P s |s n and P e|s can be calculated by formulas (9),
respectively. Besides, in order to simplify calculation, only consider subsets composed by at leastterms from subset sfor subset eof event term, which means that both of them shall have
same elements at least.
Obtain m
i n
i 1
Max sim t , s
from formula (8); if its value is greater than given threshold,
classify new report sn as topic with greatest similarity, and otherwise output it as a new seeded
topic.
4. Experiment 4.1. Test for Set
TDT4 is used for evaluation of experiments in the work. TDT4 includes 98,245 news reports, with news reports from 20 news sources including APW, NYT, ABC, VOA, Xinhua and others from October 2000 to January 2001, which involves three languages as English, Chinese and Arabic. American Language Data Consortium (LDC) has labeled 40 news topics wherein and provided relevant and irrelevant reports of the 40 topics. The Chinese reports in TDT4 have been used in experiments to conduct performance test for the model proposed in the work.
4.2. Evaluation Method
information and it will reduce the identification performance. The influence of term number in vector quantity of new reports on precision ratio will be verified with different recall ratios at experimental part to make sure the optimal number of term in vector quantity of new reports. The calculation formula of precision ratio and recall ratio is as follows:
a a
Pr ecision Re call
a b a c
(12)
Wherein, ais the number of relevant documents identified; cis the number of relevant documents unidentified; bis the number of irrelevant documents identified.
Missing report rate and false positive rate involved in experiments are two coordinates in DET curve. The former is the vertical coordinate and the latter is abscissa. The calculation method is as follows:
c b
MP FAP
a c b d
(13)
The meanings of a,b and c are the same as above, dis the number of irrelevant documents unidentified. Although two different methods of evaluation have been used in the experimental part of the work, certain relationship can be found between the two from observing formula (12), (13).
4.3. Experiment Content and Analysis
The method of repeated training is adopted in the first experiment to obtain optimal number for expression. Experimental procedures of the second experiment are as follows: first, generate report vector, event vector and topic vector on the basis of test set, and use formula (4) to calculate term weight in vector; then carry out test in new model and vector space model (VSM) by using Chinese reports in test set, and calculate missing report rates and false positive rates of the two models under different threshold values. As for the third experiment, first adjust term weights for event bank and topic bank according to formula (5), (6), and then compare missing report rates and false positive rates before and after adjustment under different threshold values.
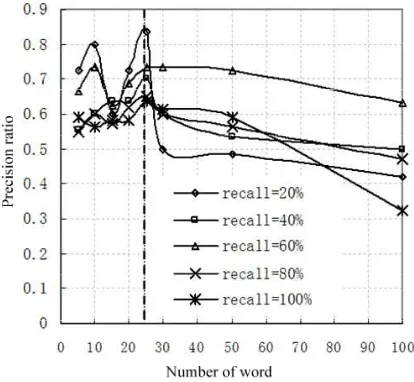
Figure 3. Influence of different number of term expression used by new report on precision ratio
carried out. 5, 10, 15 20, 25, 30, 50, 100 feature items are respectively used to represent for new report vectors when recall ratios are 20%, 40%, 60%, 80%, 100% respectively in experimental part to verify the influence of precision ratio, thus to obtain optimal number for expression of new report vector. The result of the experiment is shown in Figure 3.
Figure 3 shows that choice of feature item number of new report will influence precision ratio. It can be found from the observation on dash lines in figure that the precision ratio is the highest when the number of feature items is around 25 under different recall ratios. Based on this experiment, the expression of report all adopt first 25 terms with bigger weight to represent in experiment of comparing the performance of vector space model (VSM) and new model, before and after weight adjustment of new model.
(2) Performance comparison between vector space model (VSM) and new model: What the experiment verifies is the performance of new model weight before adjustment and vector space model (VSM). DET curve is adopted as evaluation method. In this experiment, obtain missing report rates and false positive rates of the two models under 12 threshold values and draw DET curve. Finally, two curves can be obtained; and the closer the curve to the origin, the better performance it has; the result of experiment is shown in Figure 4. The black full line represents the performance of new model. It can be found from the observation on Figure 4 that new model is closer to origin than basic vector model as for most points on curves, thus the performance of new model is better than vector space model as a whole.
Figure 4. Performance comparison between vector space model (VSM) and new model
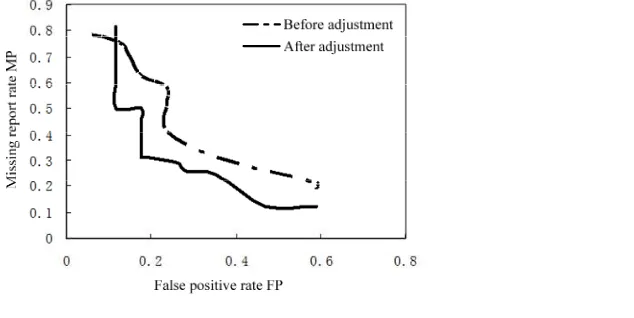
Figure 5. Performance comparison between weights of new model before and after adjustment It can be found from the observation on Figure 5 that pre-adjustment performance is slightly higher than post-adjustment one at the beginning part with higher missing report rate. However, in the actual system design, a condition with very high missing report rate will not be chosen in the setting of threshold value since the threshold is relatively high under this condition, and the threshold will filter out a lot of useful information. Therefore, the weight performance before adjustment is obviously higher than the weight performance after adjustment from application and overall effect point of view.
5. Conclusion
Bayesian belief network model for topic identification has been proposed in the work according to the relevant knowledge of Bayesian belief network and topic identification. In the modeling process mapping from report layer to event layer, there may be some deviations due to term reduction. But when terms are filtered by the work, the terms selected have relatively large weight in report, and can basically represent the report; compared with time cost of large-scale news report processing, the deviation can be accepted. In the future work, we will further improve the model and better balance time cost and deviation.
References
[1] Zhang L, He B, Sun J. Double Image Multi-Encryption Algorithm Based on Fractional Chaotic Time Series. Journal of Computational and Theoretical Nanoscience. 2015; 12: 1-7.
[2] Abdar M, Kalhori SRN, Sutikno T, Subroto IMI, Arji G. Comparing Performance of Data Mining Algorithms in Prediction Heart Diseases. International Journal of Electrical and Computer Engineering (IJECE). 2015; 5(6): 1569-1576.
[3] Lv Z, Halawani A, Feng S. Multimodal hand and foot gesture interaction for handheld devices. ACM Transactions on Multimedia Computing, Communications, and Applications (TOMM). 2014; 11(1s): 10.
[4] Guanxiong Liu, Yishuang Geng, Kaveh Pahlavan. Effects of calibration RFID tags on performance of inertial navigation in indoor environment. Networking and Communications. 2015.
[5] Jie He, Yishuang Geng, Yadong Wan, Shen Li, Kaveh Pahlavan, A cyber physical test-bed for virtualization of RF access environment for body sensor network. IEEE Sensor Journal. 2013; 13(10): 3826-3836.
[6] Gang Han, Jianwen Zhang, Xin Chu. Research and Design in Unified Coding Architecture for Smart Grids. TELKOMNIKA Telecommunication Computing Electronics and Control. 2013, 11(3): 463-472. [7] Jie He, Yishuang Geng, Fei Liu, Cheng Xu. CC-KF: Enhanced TOA Performance in Multipath and
NLOS Indoor Extreme Environment. IEEE Sensor Journal. 2014; 14(11): 3766-3774.
[8] Na Lu, Caiwu Lu, Zhen Yang, Yishuang Geng. Modeling Framework for Mining Lifecycle Management. Journal of Networks. 2014; 9(3): 719-725.
[9] M Abdar, SRN Kalhori, T Sutikno, IMI Subroto, G Arji. Comparing Performance of Data Mining Algorithms in Prediction Heart Diseases. International Journal of Electrical and Computer Engineering (IJECE). 2015; 5(6): 1569-1576.
[10] Yishuang Geng, Kaveh Pahlavan. On the accuracy of rf and image processing based hybrid localization for wireless capsule endoscopy. IEEE Wireless Communications and Networking Conference (WCNC). 2015.
[11] Li X, Lv Z, Hu J. Traffic management and forecasting system based on 3d gis. Cluster, Cloud and Grid Computing (CCGrid), 2015 15th IEEE/ACM International Symposium on. 2015: 991-998.