COMPETITIVENESS ANALYSIS AND FACTORS
AFFECTING TRADE FLOW OF NATURAL RUBBER IN
INTERNATIONAL MARKET
IRFAN RAHADIAN SUDIYANA
GRADUATE SCHOOL
BOGOR AGRICULTURAL UNIVERSITY BOGOR
DECLARATION
I, Irfan Rahadian Sudiyana, hereby declare that the thesis entitled:
COMPETITIVENESS ANALYSIS AND FACTORS AFFECTING TRADE FLOW OF NATURAL RUBBER IN INTERNATIONAL MARKET
Submitted to fulfill a requirement for the award of Master of Science in Agribusiness from Bogor Agricultural University Indonesia and Georg August University of Goettingen Germany in the framework of international joint degree program between both universities is my own work through the guidance of my academic advisors and to the best of my knowledge it has not been submitted for the award of any degree in any other academic institutions. This thesis does not contain any pieces of work of other person, except those are acknowledged and referenced herein.
SUMMARY
IRFAN RAHADIAN SUDIYANA. Competitiveness Analysis and Factors Affecting Trade Flow of Natural Rubber in International Market. Supervised by SUHARNO and RITA NURMALINA.
Natural rubber is one of the plantation commodities, which plays an important role in the economic development of many countries. This commodity also provides job opportunities for many people, primarily for smallholder farmers. The supply of natural rubber in the world market is dominated by Thailand, Indonesia and Malaysia. According to UN-Comtrade, the natural rubber export share in 1987, Malaysia is the largest exporter. By period of 1990, however, the condition of trade had started to change, allowing Thailand and Indonesia to shift the position of Malaysia. This change was due to the improvement of natural rubber production in Thailand and Indonesia. Moreover, the Malaysian production decreased due to several factors. This situation illustrates the increasing competition between the three major producers of natural rubber in the international market over the last several decades.
Thailand, Indonesia and Malaysia differ in their individual export destinations. However, according to the IRSG data, these three producing countries all exported to ten primary importing countries. As mentioned above, the competition between the main exporting countries is relatively high. Therefore, it is necessary for Thailand, Indonesia and Malaysia to individually focus on improving the quantity and quality of the product in order to remain competitive in the international rubber trade. According to the background information and problem statement, the aims of this research are, to analyze the competitiveness and the level of competition of the three major exporters of natural rubber in the international market and to identify the determinants that influence natural rubber export in international market.
All data used in this study is secondary panel data, which is a combination of time series data and cross-sectional data. Time series data includes annual data from 2003 to 2013, while the cross-sectional data covers ten major export destinations of the three main natural rubber exporting countries, with the largest export volumes going to the United States, Japan, China, Singapore, the Republic of Korea, Germany, Canada, Brazil, India, and Belgium. The data used were obtained from Statistics Indonesia (BPS), the International Rubber Study Group (IRSG), the United States Department of Agriculture (USDA), the Centre d'Etudes et d'Informations Internationales prospectives (CEPII), UN Comtrade, the World Bank, and FAOSTAT.
the share of world exports to the destination countries. So that it can be quantitatively the ability or inability of three main exporting countries compete in international trade. And the second method is gravity model. The gravity model is used to analyze the economic factors that affect the flow of trade between two countries. According to Lineman (Lapipi, 2005), the gravity model is an econometric model that is used to analyze the effects of economic integration on trade, as well as being an analytical tool that can be used to estimate the value of exported and imported goods in a region.
The estimation results of the RCA analysis for natural rubber, in the period from 2003 through 2013 shows these three countries have a comparative advantage in the international market as indicated by an RCA value greater than one. The average value of the RCA for Thailand, Indonesia and Malaysia respectively, are 29.66, 29.36 and 9.15. If the RCA value is greater than one, it indicates that the share of the natural rubber commodity, out of all commodity categories, that is exported from the three main exporter countries is greater than the share of the natural rubber commodity worldwide. From the three main exporter countries, Thailand has the highest RCA, followed by Indonesia and Malaysia. China, the Republic of Korea and India are the major natural rubber export destinations of Thailand, demonstrated by the highest average RCA values. On the other hand, the main natural rubber export destination countries of Indonesia are the US and Canada. While for Malaysia, Germany is the main natural rubber export destination.
The second result is about gravity model. The variables that significantly influence the natural rubber export value are, among others, the GDP of importing countries, natural rubber production of exporting countries, and exchange rate. The exchange rate variable has a coefficient sign that is not consistent with the hypothesis, but is supported by a condition that can explain it. Meanwhile, the remoteness index variable has no effect on the natural rubber export value.
RINGKASAN
IRFAN RAHADIAN SUDIYANA. Analisis Daya Saing dan Faktor-faktor yang Mempengaruhi Aliran Perdagangan Karet Alam di Pasar Internasional. Dibimbing oleh SUHARNO and RITA NURMALINA
Karet alam merupakan salah satu komoditas perkebunan yang memiliki peran penting di dalam sektor ekonomi pada beberapa negara. Komoditas ini juga menyediakan lapangan pekerjaan untuk orang banyak, terutama untuk para petani kecil. Pasokan karet alam dunia didominasi oleh Malaysia, Thailand, dan Indonesia. Pada periode tahun 1990, kondisi persaingan mulai berubah, Thailand dan Indonesia menyusul Malaysia di posisi pertama dalam jumlah ekspor dan produksi karet alam. Perubahan ini dikarenakan oleh perbaikan sistem budidaya karet alam di Indonesia dan Thailand. Ditambah juga dengan produksi karet alam Malaysia yang menurun karena beberapa faktor. Kondisi ini menggambarkan tingginya tingkat persaingan antara tiga negara eksportir utama karet alam di pasar internasional dalam beberapa dekade terakhir.
Thailand, Indonesia dan Malaysia memiliki perbedaan dalam negara tujuan ekspornya. Akan tetapi, berdasarkan data dari IRSG, ketiga negara ini melakukan ekspor ke sepuluh negara importer utama. Seperti yang telah disebutkan diatas, tingkat kompetisi antara ketiga negara ini sangatlah tinggi. Oleh karena itu, sangatlah penting bagi Thailand, Indonesia dan Malaysia untuk fokus dalam meningkatkan kualitas dan kuantitas dari produk karet alamnya agar tetap memiliki daya saing di pasar internasional. Berdasarkan informasi yang terdapat di latar belakang, dan rumusan masalah, tujuan dari penelitian ini adalah, untuk menganalisis persaingan dan tingkat persaingan diantara tiga negara eksportir utama karet alam dunia, dan untuk mengidentifikasi faktor-faktor apa saja yang mempengaruhi nilai ekspor karet alam di pasar internasional.
Seluruh data dalam penelitian ini menggunakan data sekunder berupa data panel, yaitu kombinasi dari data time-series dan data cross-section. Time-series data yaitu data nilai ekspor karet alam yang digunakan dari tahun 2003 -2013, sedangkan data cross-section adalah data nilai ekspor dari tiga negara eksportir utama ke sepuluh negara tujuan utama yaitu Amerika, Jepang, Cina, Singapura, Korea Selatan, Jerman, Kanada, Brazil, India dan Belgia. Data diambil dari beberapa sumber yaitu dari Badan Pusat Statistik Indonesia, the International Rubber Study Group, the United States Department of Agriculture (USDA), the Centre d'Etudes et d'Informations Internationales prospectives (CEPII), UN Comtrade, the World Bank, and FAOSTAT.
Gravity model digunakan untuk menganalisis faktor ekonomi yang berpengaruh terhadap aliran perdangangan antar dua negara. Berdasarkan Lineman (Lapipi, 2005), gravity model adalah model ekonometrik yang digunakan untuk menganalisis efek dari integrasi ekonomi pada sebuah perdagangan, dan juga merupakan alat anaisis yang bisa digunakan untuk mengestimasi nilai barang ekspor dan impor pada suatu wilayah.
Hasil estimasi dari analisis RCA untuk karet alam, pada tahun 2003 sampai 2013 menunjukkan tiga negara ini memiliki keunggulan komparatif di pasar internasional ditunjukkan dari nilai RCA yang lebih besar dari satu. Nilai rata-rata RCA untuk Thailand, Indonesia, dan Malaysia secara berturut-turut yaitu, 29.66, 29.36 dan 9.15. Thailand merupakan negara yang memiliki nilai rata-rata RCA tertinggi, diikuti Indonesia dan Malaysia. Negara tujuan ekspor karet alam Thailand yang memiliki nilai rata-rata RCA tertinggi adalah Cina, Korea Selatan dan India. Sedangkan untuk Indonesaia adalah Amerika dan Cina, dan untuk Malaysia adalah Jerman.
© Copyright, 2015. Bogor Agricultural University.
All Right Reserved
No part or this entire thesis maybe excerpted without inclusion and mentioning the sources. Excerption only for research and education use, writing for scientific papers, reporting, critical writing for reviewing of a problem and excerption does not inflict a financial loss in the proper of IPB.
A Thesis
Submitted to the Graduate School in Partial Fulfillment of the Requirement for Master of Science Degree in Agribusiness
COMPETITIVENESS ANALYSIS AND FACTORS
AFFECTING TRADE FLOW OF NATURAL RUBBER IN
INTERNATIONAL MARKET
GRADUATE SCHOOL
BOGOR AGRICULTURAL UNIVERSITY BOGOR
2015
Thesis Title : Competitiveness Analysis and Factors Affecting Trade Flow of Natural Rubber in International Market
Name : Irfan Rahadian Sudiyana
NIM : H351120021
Approved by Advisory Committee
Dr. Ir. Suharno, M.Adev. Chairman
Prof. Dr. Ir. Rita Nurmalina, MS. Member
Agreed by
Coordinator of Major Agribusiness
Prof. Dr. Ir. Rita Nurmalina, MS.
Dean of Graduate School
Dr. Ir. Dahrul Syah, MSc, Agr.
ACKNOWLEDGEMENT
First of all, all praise to Allah, who is most precious and the most merciful for his blessing on all stages of this research process
This research paper is made possible through the help and support from everyone, including: supervisors, parents, family, and all of my friends. I would like to express my deepest appreciation to all those who provided me the possibility to complete this report.
The author wishes to express my gratitude to my supervisor, Dr. Suharno, M.Adev who was abundantly helpful and offered invaluable assistance, support and guidance. Deepest gratitude is also due to the members of the supervisory committee, Prof. Dr. Rita Nurmalina without whose knowledge and assistance this study would not have been successful. The author would also like to convey thanks to the DIKTI Indonesia for providing the financial support during this study.
Special thanks also to all my friends, SIA Göttingen, SIA-IPB program, PPI Göttingen, MSA 3 IPB, especially for, Bu Intan, Ica, Maika, Dea, Ian, Mba Wida, Rizah, Rezky, Achmad, Firman, and Manu for providing me such a nice, homely living environment and for helping me so much during my study in Göttingen and Bogor.
Finally, my deepest gratitude goes to my loving mother, father and brother for their unconditional love, care and support. Without their support and encouragements, it was impossible for me to pursue my interests. My Master Thesis is dedicated to my family.
TABLE OF CONTENT
TABLE OF CONTENT v
LIST OF FIGURE vii
LIST OF TABLE vii
1 INTRODUCTION 1
1.1 Background 1
1.2 Problem Statement 4
1.3 Objective 6
1.4 Significance of the Research 6
1.5 Scope of Research 7
2 LITERATURE REVIEW 7
2.1 Competitiveness Analysis Method 7
2.2 Gravity Model and Variables 9
2.2.1 Gross Domestic Product (GDP) 10
2.2.2 Economic Distance and Remoteness 10
2.2.3 Exchange Rate 12
2.3 Research Hypothesis 12
3 THEORITICAL FRAMEWORK 12
3.1 Theory of International Trade 13
3.2 Concept of Competitiveness 14
3.3 The Concept of Gravity Model 15
3.4 Export and Exchange Rate 17
4 METHODS 18
4.1 Types and Sources of Data 18
4.2 Analysis Method 19
4.2.1 Descriptive Analysis 19
4.2.2 Revealed Comparative Advantage (RCA) 19
4.2.3 Regression Analysis of Panel Data with Gravity Model 20
4.3 Model Formulation 21
4.4 Goodness of Fit Test 21
4.4.1 Economic Criteria 21
4.4.2 Econometric Criteria 21
4.4.3 Statistical Criteria 23
5 OVERVIEW OF NATURAL RUBBER IN INTERNATIONAL TRADE 24
5.1 Global Perspective 24
5.2 Conditions of Natural Rubber in Exporting Countries 27
5.2.1 Thailand 27
5.2.2 Indonesia 28
5.2.3 Malaysia 30
5.3 The Balance of Natural Rubber Production and Consumption 31
6 RESULT AND DISCUSSION 33
6.1 Competitiveness of Natural Rubber in the International Market 33 6.1.1 Revealed Comparative Advantage (RCA) of Natural Rubber Major
Exporter 33
6.2 Factors Affecting Natural Rubber Trade in International Markets 37 6.2.1 Estimation of Natural Rubber Export Model in International Markets
37 6.2.2 Interpretation of The Gravity Model of Natural Rubber Export in
International Markets 39
7 CONCLUSIONS AND RECOMMENDATIONS 42
7.1 Conclusions 42
7.2 Recommendations 43
REFERENCES 44
LIST OF FIGURE
Number Page
1 Natural Rubber Price Movement in US$/Tonnes, 2008 - 2012 3 2 The Development of Natural Rubber Export Volume 4 3 Natural Rubber Production ('000 tonnes) in 2011 5 4 Consumption of Natural Rubber ('000 tonnes) in 2011 6
5 International Trade Curve 14
6 Operational Framework 17
7 Currency Revaluation Effect of The Exporting Country 18 8 World Natural Rubber Production and Consumption, 2000 –
2013 24
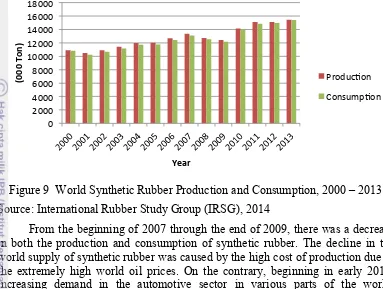
9 World Synthetic Rubber Production and Consumption, 2000 –
2013 25
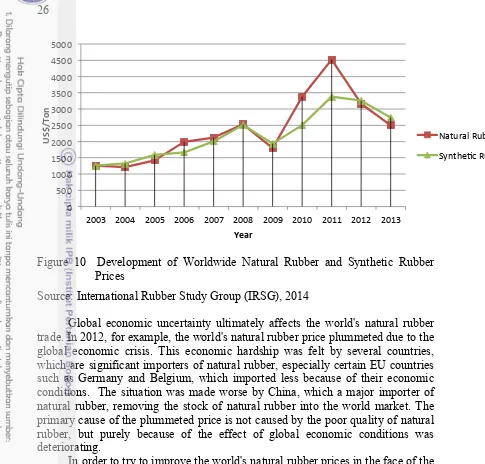
10 Development of Worldwide Natural Rubber and Synthetic Rubber
Prices 26
11 Production, Consumption and Export of Natural Rubber in
Thailand, 2003 – 2012 32
12 Production, Consumption and Export of Natural Rubber in
Indonesia, 2003 – 2012 32
13 Production, Consumption and Export of Natural Rubber in
Malaysia, 2003 – 2012 33
14 The Average Value of RCA from Three Main Exporting
Countries, 2003 – 2013 36
15 The Results of The Gravity Model 38
16 The Average of Natural Rubber Export Value and Production,
2003 – 2013 39
17 GDP Growth of Importing Countries in 2003 – 2013 40
LIST OF TABLE
1 Worldwide Production and Consumption of Natural and Synthetic
Rubber (000 mt) 2
2 Type and Source of Data 19
3 Identification Framework of Autocorrelation 22
4 World Oil Prices, 2011 - 2013 (US$/Barrel) 27
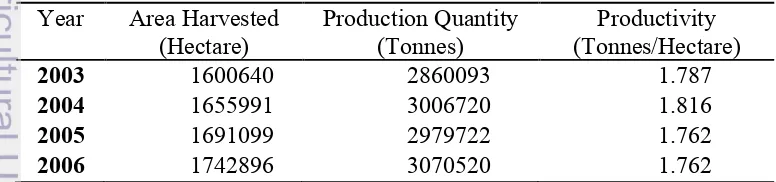
5 Area Harvested, Production, and Productivity of Natural Rubber
in Thailand, 2003 - 2012 27
6 Area Harvested, Production and Productivity of Natural Rubber in
Indonesia, 2003 - 2012 29
7 Area Harvested, Production and Productivity of Natural Rubber in
Malaysia, 2003 -2012 31
1
INTRODUCTION
1.1 Background
Rubber is one of the plantation commodities, which plays an important role in the economic development of many countries. This commodity also provides job opportunities for many people, primarily for smallholder farmers. Rubber has a particularly wide range of uses as a raw material for various industrial products, especially for the automotive industry. Rubber is found in the liquid form of specific plants, but it can also be produced synthetically. Synthetic rubber is produced through the process of polymerization of various monomers, while natural rubber is produced through the process of tapping the plant called Hevea Brasiliensis.
The rubber tree is a native species of the Amazon River basin in South America. The ideal rubber growing regions are the areas between 8° north of the Equator and 10° south of the Equator, with an altitude below 400m and high humidity; furthermore, with the ideal annual rainfall is 2,000-4,000 mm evenly spread throughout the year, with temperatures ranging between 24° and 28°C. Accordingly, the production of natural rubber is concentrated in a few tropical countries. However, as a result of intensive breeding programs, rubber tree production areas can be found in locations with an annual rainfall of as little as 1,500 mm per year and with a dry season of up to five months. These plants generally have 32 years of productive life, but they may live up to 100 years or more. The plantation becomes economically profitable in the 6th year. The natural rubber produced is processed to convert into a storable and marketable form (NMCE, 2013).
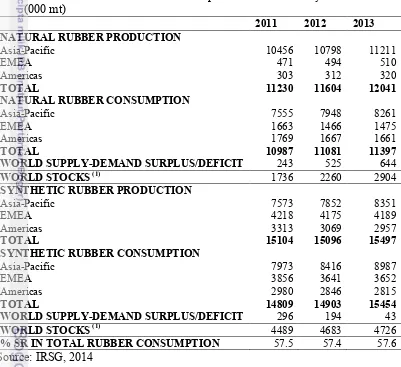
Currently, the production and consumption of natural rubber is below that of synthetic rubber worldwide (Table 1). However, synthetic rubber cannot entirely replace the need for natural rubber in the world market. The advantages of natural rubber cannot be surpassed by synthetic rubber, which leads to some industries, such as the radial tire industry, to still have a high dependency on the supply of natural rubber. Moreover, the trade of natural rubber is expected to increase significantly on the world market due to the increased public awareness of environmental sustainability, as well as the tire industry’s introduction of “green tires” which contain between 60 and 80% natural rubber (previously 30-40%). In addition, the amount of polymer industry companies that use raw materials of natural rubber is also expected to increase (Litbang, 2012).
The growing importance of natural rubber has triggered the development of the world's natural rubber economy in terms of both production and consumption. Natural rubber production showed an increase of 7% from 2011 to 2013, increasing from 11.23 million tonnes to 12.04 million tonnes, respectively. Natural rubber consumption also increased by nearly 3.5% from 2011 to 2013, amounting to a total consumption of 11.39 million tonnes natural rubber in 2013 (IRSG, 2014).
2
synthetic rubber as a raw material for various vehicle components, one of which is tires. The International Rubber Study Group (IRSG) reports that total synthetic rubber consumption increased by 4.2% from 14.8 million metric tonnes in 2011 to 15.4 million metric tonnes in 2013; the production of synthetic rubber also increased by 2,5%. Furthermore, all geographic regions experienced absolute growths in natural rubber production from 2011 to 2013. Asian natural rubber supply reached 11.2 million tonnes in 2013, while the European Union and North America were at 0.5 million tonnes and 0.3 million tonnes, respectively, for the same period. Asia is the largest supplier for natural rubber, as well as for synthetic rubber.
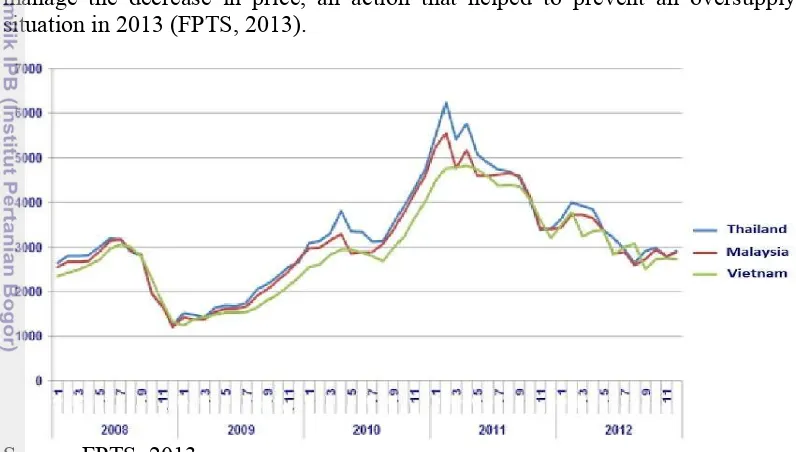
The FPT Securities Joint Stock Company (FPTS) Vietnam report shows that the price of natural rubber from 2011 to 2014 faced high volatility (Figure 1). In mid-2008, the price of natural rubber continued to increase, reaching its highest peak in the history of natural rubber at that time, at about 3,000 US$/ton. The increase in price occurred due to the increase in crude oil prices, which is a raw material for synthetic rubber. Synthetic rubber is a commodity, which is, can be both complementary and a complete substitute for natural rubber so that when the price of synthetic rubber rose, it indirectly contributed to the increase in the price of natural rubber in the international market. At the end of 2008, the price of Table 1 Worldwide Production and Consumption of Natural and Synthetic Rubber
(000 mt)
% SR IN TOTAL RUBBER CONSUMPTION 57.5 57.4 57.6
3 natural rubber deceased because of the global economic crisis that led to the weakening of the automotive industry, further affecting the natural rubber industry. The real impact on the world's natural rubber demand resulted in decreased and led to the declining price trend in the international market at a price range of 1,900 US$/ton in October 2008 and further decreasing with the June 2009 price of natural rubber coming in at only 1,500 US$/ton.
The business results from the 1st quarter of 2013 of most companies in the natural rubber industry are significantly lower than the same period of 2012 (total revenue down by 33%, profit before tax down by 56%) due to lower consumption and lower selling price (output down by 24% and price down by 10-14%). With the currently declining rubber price, it indicates that 2013 was a difficult year for companies in the natural rubber industry. The governmenets of Thailand, Indonesia, Malaysia agreed to reduce the export volume of 300,000 tonnes to manage the decrease in price, an action that helped to prevent an oversupply situation in 2013 (FPTS, 2013).
Source: FPTS, 2013
According to the IRSG, the projection of world demand for natural rubber will reach 10.9 million tonnes by 2020 with an average annual consumption growth rate of 9%, thus there will likely be a rubber shortage when the natural rubber supply is not experiencing high growth (over 9%). The majority of the demand for natural rubber is derived from the motor vehicle sector, primarily the tire industry. The largest market country in the world is China, which consumed more than a third of the global production in 2013. The demand for various other rubber products (excluding tires) will also increase due to the increasing levels of industrialization in developing countries.
As shown above, natural rubber is one of the plantation commodities, which plays a major part in international trade. Each manufacturer is competing to utilize natural rubber commodities as a foreign exchange. Furthermore, the emergences of newly industrialized countries, the improved world economy and the growing population have led to the development of rubber as a commodity. The benefits of these improvements are not only felt by the main natural rubber producers;
4
Indonesia, Thailand and Malaysia for example, but also by the importing countries.
Many importing countries require a continuous supply of natural rubber as a raw material for strategic industries, such as the automotive tire industry, military industrial equipment and industrial medical facilities, among others. Producers want high prices, while consumers want low prices, therefore the balance between natural rubber production (supplied by producer countries) and natural rubber consumption (for the needs of the industry in importing countries) is critical to the creation of a mutually beneficial price for both countries.
1.2 Problem Statement
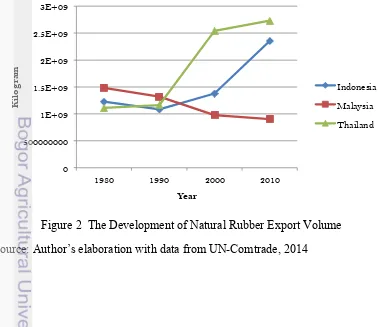
The supply of natural rubber in the world market is dominated by Thailand, Indonesia and Malaysia. According to UN-Comtrade, the natural rubber export share in 1987, Malaysia accounts for 40 percent of the total world exports, with Indonesia at 28 percent and Thailand at 22 percent. By period of 1990, however, the condition of trade had started to change, allowing Thailand and Indonesia to shift the position of Malaysia. Production in Thailand increased and ultimately reached 1.34 million metric tonnes, while Indonesia amounted to 1.3 million metric tonnes, and Malaysia amounted to 1.2 million metric tonnes (Figure 2). This change was due to the improvement of natural rubber production in Thailand, while Indonesia experienced fluctuating growth. Moreover, the Malaysian production decreased due to several factors, more specifically the increasing cost of labor and the rising competition for land uses, especially with palm oil. This situation illustrates the increasing competition between the three major producers of natural rubber in the international market over the last several decades.
Figure 2 The Development of Natural Rubber Export Volume Source: Author’s elaboration with data from UN-Comtrade, 2014
0 500000000 1E+09 1.5E+09 2E+09 2.5E+09 3E+09
1980 1990 2000 2010
Kilo
g
ram
Year
Indonesia
Malaysia
5 Figure 3 shows some of the natural rubber producing countries in the world, with the majority of production being located on the Asian continent, especially in Southeast Asia. Currently, Thailand is the world’s largest producer of natural rubber producing 3.39 million tonnes in 2011. Indonesia is the second largest producer contributing around 27% of the world’s total natural rubber production. Malaysia produced 0.99 million tonnes and occupies the third rank in terms of production. India is the fourth largest producer of natural rubber in the world. In 2011, India produced 0.89 million tonnes of natural rubber, up from 0.85 million tonnes in the previous year. India contributes roughly 8% of the world’s natural rubber production. Other major producers include Vietnam and China, each contributing 7% to the world production.
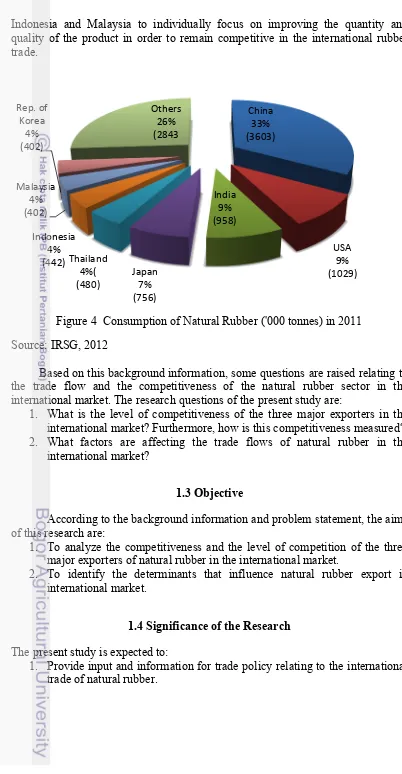
Meanwhile, in terms of consumption, China, the United States and India are the countries with the largest natural rubber consumption rate (Figure 4). Overall, the increased consumption of natural rubber in Asia is due to the economic growth in this region which gives rise to the new natural rubber-based industries, for
Figure 3 Natural Rubber Production ('000 tonnes) in 2011 Source: IRSG, 2011
Thailand, Indonesia and Malaysia differ in their individual export destinations. However, according to the IRSG data, these three producing countries all exported to ten primary importing countries. The primary importing countries are the USA, Japan, China, Singapore, Korea, Germany, Canada, India, Brazil and Belgium. As mentioned above, the competition between the main exporting countries is relatively high. Therefore, it is necessary for Thailand,
6
Indonesia and Malaysia to individually focus on improving the quantity and quality of the product in order to remain competitive in the international rubber trade.
Figure 4 Consumption of Natural Rubber ('000 tonnes) in 2011 Source: IRSG, 2012
Based on this background information, some questions are raised relating to the trade flow and the competitiveness of the natural rubber sector in the international market. The research questions of the present study are:
1. What is the level of competitiveness of the three major exporters in the international market? Furthermore, how is this competitiveness measured? 2. What factors are affecting the trade flows of natural rubber in the
international market?
1.3 Objective
According to the background information and problem statement, the aims of this research are:
1. To analyze the competitiveness and the level of competition of the three major exporters of natural rubber in the international market.
2. To identify the determinants that influence natural rubber export in international market.
1.4 Significance of the Research
The present study is expected to:
7 2. Increase knowledge in applied science, which has been obtained through
analytical problem solving skills. 3. Develop and apply research results.
1.5 Scope of Research
In conducting the present research, a few limitations have been applied that aim to make the research more focused in achieving its goals.
1. The period of analysis is 11 years, from the year 2003 to 2013.
2. The type of rubber used in this analysis is natural rubber and gums, in primary forms, plates, etc. with the code 4001 and HS1992.
3. The independent variables that are used in this study are the production of natural rubber from exporting countries, real GDP of importing countries, remoteness, and the real exchange rate.
4. The dependent variable is the volume of exports of natural rubber from three main exporting countries.
5. The export destinations are the ten major importing countries that have the highest share of import from the three main exporting countries of natural rubber.
2
LITERATURE REVIEW
2.1 Competitiveness Analysis Method
Competitiveness is usually identified by productivity, which is the level of output produced for each unit of input used. Increasing productivity means increasing the number of physical inputs (capital and labor), improving the quality of inputs used and improving the technology (total factor productivity). Competitiveness can also be seen as the ability of a country to produce goods and services on an international scale through the mechanism of free and fair trade as well as maintaining and improving the real income in the long term. An analytical outlook on the competitiveness of a commodity can be determined from two indicators, comparative advantages and competitive advantages.
Competitiveness can be analyzed by various methods of analysis. The method used must be in accordance with the specific purpose of research. Many methods can be used to calculate and to assess the competitiveness of agricultural commodities, such as Revealed Comparative Advantages (RCA) and the Policy Analysis Matrix (PAM). The Policy Analysis Matrix (PAM) is an analysis method that uses three indicators, namely private profits, social or economic advantages, and a competitiveness analysis in the form of comparative and competitive advantages, as well as using the analysis of the impact of government policies on commodities. The Revealed Comparative Advantage (RCA) method can be used to measure the comparative advantage of a commodity in the current economic conditions, along with the scope of the macro-economy or in international trade.
8
RCA analysis method to investigate the condition of Hungarian agricultural competitiveness in the international market. The results showed that an agricultural commodity in Hungary is not yet highly competitive in the international market. RCA was also used in another previous study, conducted by Serin, et al. (2008). The research is looks at the tomato, olive oil and fruit beverages industries in Turkey and their competitiveness in the EU market. The purpose of Serin’s research was to give the information to the government regarding the competitiveness of the three goods from Turkey in the international market. This information was intended to help the Turkish government make a policy to develop the commodity, which had the highest RCA. The result showed that the olive oil and fruit beverages industries have high competitiveness, while the tomato industry does not. Wu, et al. (2012), focused on the rabbit meat industry in China, with the aim to provide information to the government in order to develop this industry. The results from this study indicate that China’s rabbit meat industry is highly competitive in comparison to other exporting countries.
The RCA analysis method is also often used to see the competition among the producing countries of commodities around the world. Valenciano, et al. (2012) conducted a study, which aims to determine the competitiveness of pear commodities in the world market. In this study, Valenciano look at the condition of each country’s competitiveness as a pear exporter in the world market, and then determined which countries have high competitiveness or low competitiveness. Leishman, et al. (2012) also had interesting research employing the use of the RCA method. They conducted research regarding the wool commodities on the world market. The results indicate that Australia is a country that has the highest competitiveness in the world for wool.
The result of the RCA method essentially aims to determine which countries are indeed having high competitiveness or low competitiveness in a good compared to other exporting countries. If the results show a high level of competitiveness, then the country should maintain the condition, specialize to these goods and trade with another country. On the other hand, if the results show a low level of competitiveness, then the country should improve the trade condition and switch to specialize in other commodities. Morshed, et al. (2012) conducted research regarding the competitiveness of fruit litchi and longan fruit in China. The results showed that the commodities are not competitive, so the researchers suggested to the government to improve the system of agribusiness from upstream to downstream in both commodities, thus anticipating an increase in its competitiveness in the international market.
9 studies, the comparative advantage, competitive advantage and also the impact of government policy on these three commodities can be established.
Other previous usage of PAM was the research conducted by Mohanty, Fang, and Chaudhary (2010), which aim to determine the impact of policies on the efficiency of cotton production in five cities in India. In line with Mohanty et al., research conducted by Ngwira, et al. (2012) aims to verify the impact of policies on the efficiency of groundnut production in Malawi. Furthermore, research conducted by Esmaili (2008) regarding the competitiveness of shrimp in southern Iran aims to investigate the differences of social advantages to gain market shrimp in southern Iran. Additionally, Esmaili (2008) also discusses the impact of the subsidy policy on the competitiveness of commodity shrimp.
The purpose of the present research is to look at the general condition of the competitiveness of three main natural rubber-exporting countries in the international market. In addition, researchers also want to identify the level of competitiveness of major competitor countries in terms of exports of natural rubber in the international market. Researchers will not discuss the impact of government policies on trade in natural rubber. With these considerations, the researcher chooses to utilize the RCA competitiveness analysis method, supported by panel data regression analysis for gravity models, which is expected to explain the phenomena.
2.2 Gravity Model and Variables
A gravity model is an econometric model that is often used to describe international trade between various countries. In present times, increased trade flows have been written in a number of studies that analyze the sources of trade. Gravity initial concept models are based on Newton's law and explain that the gravitational force between two objects is directly proportional and is influenced by the masses of the two objects, and the distance between them squared. Initially, the concept of the gravity model of bilateral trade is only applied between two countries. In modern times however, there are widely used gravity models that are adapted to the current phenomenon, which will be discussed by researchers.
Felipe and Kumar (2010) use a gravity model to determine the relationship between trade facilitation of international trade flows in Asia. The results showed that with the increase in trade facilitation in Asia, there will be an increase in the volume of international trade. Moreover, research conducted by Abid (2012) also showed that the increasing trade facilitation in Asian countries would increase the volume of international trade.
10
international trade in Australia. This trade potential analysis is not only used to look at one country, but can also determines the potential trade of a countries union. Research conducted by Rahman et al. (2006) aims to determine the potential of trade within the South Asian Free Trade Agreement (SAFTA).
Research related to international trade using gravity models has attracted a lot of attention by many researchers who wish to study it further. Several studies have been conducted to analyze variables of gravity models or factors that affect the dependent variable, which in this case is the trade value. Some of the research indicates that the independent variable of the gravity model that influences the trade value can either deliver the same conclusion, give conflicting results or even that the effect cannot be inferred. An example of this is the exchange rate variable, with some researchers (Aricia, 1998; Rahman et al. 2006) stating that the exchange rate factor has a positive effect on the trade value. Kristjánsdóttir (2005), however, obtained contrary results that show that the exchange rate has a negative effect on trade value. Further, Meiri (2013) concluded that the exchange rate does not significantly influence trade value. The variables of the gravity model’s that were used in several previous studies will be explained as follows:
2.2.1 Gross Domestic Product (GDP)
International trade flows can be evaluated by comparing the real Gross Domestic Product (GDP) of the exporting country with the real GDP of the importing country. The different structure of the economy and the GDP from the two countries will increase the volume of trade (Soto, 1996 in Ghosh et al., 2005). An increase in the exports from each country will increase the GDP, income, employment opportunities and foreign exchange. Therefore, the product that cannot be effectively produced domestically will be increasingly imported. In short, the GDP will increase in an international trade situation from both exports and imports.
GDP is the main variable of gravity models, where studies using the gravity model must be contained the GDP for one of independent variable. Researchers typically use either real GDP or GDP per capita for their research; with the specific measurement being dependent on the purpose of their research. If researchers use GDP per capita between the two countries, the purpose of their research is to see the effect of the GDP, as well as to simultaneously observe the influence of the population on the dependent variable (Ghosh et al., 2005; Schumacher et al., 2007; Kien, 2009; Rojid, 2006). Estimating the gravity model for a single commodity can lead to biased estimations if the GDP of the exporting countries are used as a proxy for the economic size of the exporter (Pujiati, 2014). Thus, the production of natural rubber is used in this study as a proxy for the exporter’s economic size.
2.2.2 Economic Distance and Remoteness
11 the trade quantity. Economic distance is an international border for the trade (Melitz, 2006; Anderson, 2013).
Conversely, the results from Meiri (2013) revealed that the high economic distance will increase the trade quantity. However, hypotheses concerning the economic in most of the previous research indicate a negative effect on the trade quantity. This occurs because high economic distance between exporting and importing countries will be offset by higher selling prices, further encouraging trade with exporting countries.
Remoteness is a method that is frequently used to control the multilateral resistance terms for exporting and importing countries. This is frequently calculated as:
Remi=
!"#$!"
!"#! !"#!
More specifically, remoteness is a formula that measures a country’s average weighted distance from its trading partners (Head, 2003), where weights are the partner countries’ shares of world GDP (denoted by GDPW).
There are two criticisms that are usually made regarding the use of this procedure, first, that it is not theoretically correct because the only type of trade barrier that it evaluates is distance (Anderson and van Wincoop, 2003). Second, is that it relates to the appropriate measure of internal distance, as the summation requires us to also specify also a country’s distance from itself (Head and Mayer, 2000 in Bacchetta 2012, suggest using the square root of the country’s area multiplied by approximately 0.4).
Baier and Bergstrand (2009) suggest estimating a linear approximation (by means of a first order Taylor series expansion) of the multilateral resistance terms, thus avoiding the non-linear procedure used in Anderson and van Wincoop (2003). Following this approach, the OLS reduced form gravity equation is:
12
2.2.3 Exchange Rate
The exchange rate is the price of a currency against other currencies, or the value of a currency against other currencies. Changes in exchange rates will affect international trade between two countries. Branda and Mendez (1988) in Ghosh (2005) showed that the risk of having a greater exchange rate encourages lower trading volumes. This is supported by studies from Frankel and Rose (2002) in Ghosh (2005) who found that countries that have the same currency will display an increase in the flow of trade.
Exchange rate is a variable that is often used in previous studies. The exchange rate can explain the phenomenon of research on the trade flow of a commodity trade (Meiri, 2013; Hadi, 2009 and Mega, 2013). Other studies have shown that the exchange rate effect is sometimes has positive sign and there is also a negative sign in the coefficient. It means that effect on export volume can be positive or negative, depending on the case and the phenomenon in the study.
After reviewing the literature, the researcher of the present study has established that the variables that are most suitable for the gravity model of this research are natural rubber production of exporting countries, real GDP of importing country, remoteness, and the real exchange rate. By using panel data and completing a regression analysis, this research will be able to explain and answer questions relating to the natural rubber commodity in the international market.
2.3 Research Hypothesis
The hypothesis used in this research is an alleged coefficient sign of the variables that affect the trade flow of natural rubber in international trade. Here are the hypotheses of the research:
1. Natural rubber productions from three main exporter countries have a positive relationship to the natural rubber trade.
2. Real GDP of export destination countries have a positive relationship to the natural rubber trade.
3. Remoteness has a negative relationship to the natural rubber trade.
4. The real exchange rate has a positive relationship to the natural rubber trade.
3
THEORITICAL FRAMEWORK
13
3.1 Theory of International Trade
Trade is the transfer of the ownership of goods or services from one person or entity to another in exchange for other goods, services, or money. In the era of globalization, trade does not only occur in a single country. Trade between two traders is called bilateral trade, while trade between more than two traders is called multilateral trade. According to Oktaviani, et al. (2009), trade that is conducted between the population of one country and the population of another country, on the basis of mutual agreement, is called international trade. Population can be either inter-individual (individual to individual), between the individual and the government of a country, or a state government with other governments.
Adam Smith (1776) first developed the theory of international trade. Adam Smith stated that trade among nations is influenced by its absolute advantages. When a country has the best technology and specialization in the production of one good it has an absolute advantage. The country that has an absolute advantage will gain from export. In 1821, David Ricardo developed the theory of comparative advantage. This theory state that even if a country has no absolute advantage in producing two types of goods than any other country, the beneficial trade can occur as long as the ratio of prices between countries are different than in an autarky situation. Furthermore, the development of trade patterns proposed by Eli Heckscher (1919) and Bertil Ohlin (1924) explained that the Heckscher Ohlin (HO) theory is also called the factor-proportion theory because it stresses on the interaction between the different proportions of the country’s production factors, as well as the differences in the usage of these factors on producing a wide range of items. The HO model predicts that a country tends to export the good, which uses its abundant factor intensively. The new trade theory is the modification of assumptions on the HO and Ricardian models result. The market structure in this new trade theory is different than with perfect competition. The concept of monopolistic competition was introduced by Krugman (1980), and states that the two main assumption are differentiated goods and increasing returns to scale. (Krugman et al., 2012).
In both domestic and international trade, all of the participants (traders, consumers, etc.) are seeking benefit from the economic activity. Each country trades to gain profit, as well as gain the more efficient incentive from the trade. In addition to the profit motive, Krugman, et al. (2012) revealed that the main reasons for international trade are as follows:
1. Countries trade because they are different from each other.
2. Countries trade in order to achieve economies of scale (economics of scale).
Theoretically, a country (e.g.,: country A) will tend to export a commodity, Y, to another country (e.g.,: country B), if the domestic price of commodity Y from country A (prior to the international trade) is relatively lower than the price of the same commodity in country B. The relatively low prices in country A are caused by excess supply, which means that the domestic production exceeds domestic consumption, thus enabling a country to sell its production to another country (country B).
14
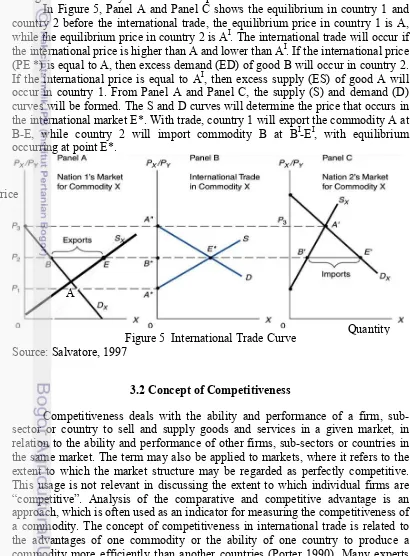
the commodity in country B is relatively higher than the price in country A. As a result of the excess demand, country B buys the commodity that is relatively cheaper from country A. Thus, the differences in needs between country A and country B lead to international trade between the two countries. Price in the international market is the price of the balance between world supply and world demand. Changes in world production will affect the world supply, while the changes in world consumption will affect the world demand. Both of these changes will ultimately affect the world price.
In Figure 5, Panel A and Panel C shows the equilibrium in country 1 and country 2 before the international trade, the equilibrium price in country 1 is A, while the equilibrium price in country 2 is AI. The international trade will occur if the international price is higher than A and lower than AI. If the international price (PE *) is equal to A, then excess demand (ED) of good B will occur in country 2. If the international price is equal to AI, then excess supply (ES) of good A will occur in country 1. From Panel A and Panel C, the supply (S) and demand (D) curves will be formed. The S and D curves will determine the price that occurs in the international market E*. With trade, country 1 will export the commodity A at B-E, while country 2 will import commodity B at BI-EI, with equilibrium occurring at point E*.
Figure 5 International Trade Curve Source: Salvatore, 1997
3.2 Concept of Competitiveness
Competitiveness deals with the ability and performance of a firm, sub-sector or country to sell and supply goods and services in a given market, in relation to the ability and performance of other firms, sub-sectors or countries in the same market. The term may also be applied to markets, where it refers to the extent to which the market structure may be regarded as perfectly competitive. This usage is not relevant in discussing the extent to which individual firms are “competitive”. Analysis of the comparative and competitive advantage is an approach, which is often used as an indicator for measuring the competitiveness of a commodity. The concept of competitiveness in international trade is related to the advantages of one commodity or the ability of one country to produce a commodity more efficiently than another countries (Porter 1990). Many experts
Quantity Price
15 agree that in order to measure the competitiveness of a commodity, it is best to look at an absolute advantage, as well as a competitive and comparative advantage. The absolute advantage is the advantage gained by either country due to the benefits or advantages of nature (natural resources), technology and human resources, so that the production becomes more efficient than in other countries (Putong, 2010).
According to Hady (2004), the theory of absolute advantage is based on several key assumptions, for instance, the factors of production used are labor, the quality of goods produced from two countries, and exchange or barter without financial compensation, with transportation costs being ignored. International trade will occur and benefit both countries if each country has a different absolute advantage. Thus, if only one country has an absolute advantage for both products, the trade will not be lucrative. This is a weakness of Adam Smith's theory of absolute advantage. However, the weakness of Smith's theory is improved or enhanced by David Ricardo's theory of comparative advantage. In this theory, Ricardo stated that international trade occurs when there are differences in the comparative advantage between countries. Comparative advantage will be achieved if a country is able to produce more goods and services with lower cost than the other country. The law of comparative advantage states that trade can be carried out by countries that do not have an absolute advantage in both commodities traded by product specialization to the product that has a smaller absolute loss. In other words, the theory of comparative advantage states that a nation can improve its economic situation if the country specializes in the production of goods and services that has the highest productivity and efficiency.
Another concept of relevance is competitive advantage. While the concept of comparative advantage states that a country does not need to produce a product, if the other country can more efficiently produce the good, the concept of competitive advantage is a concept that is not a natural condition must be taken into inhibitors because the advantages of the country can basically fought and competed with the struggle or effort. The advantages of a country depend primarily on the ability of firms within the country to compete in providing goods that can compete in the international market (Porter, 1992).
The Revealed Comparative Advantage (RCA) method is often used to analyze competitiveness, more specifically; the RCA is used to analyze the comparative advantage of a commodity in a specific country. RCA can also be used to measure an export commodity’s performance through evaluating the commodity’s role in the country’s total exports, compared to the share of the commodity in the world market. In 1965, Ballasa first introduced the concept of RCA, which assumes that a country's comparative advantage is reflected from its exports. The concept of RCA has since been widely used in research reports and empirical studies, as an indicator of the comparative advantage of a product, and further, as a reference for international trade specialization. The competitiveness of the goods can be reflected from the value of the RCA.
3.3 The Concept of Gravity Model
16
developed the first gravity model equations through the specification of total exports as a function of the Gross National Product (GNP) and distance between the countries (Kien, 2009). Bergstrand (1989) further developed this model by clarifying that it is not only useful for analyzing trade as a whole, but can also be applied to the trade flow of a specific commodity. Moreover, according to Alonso (1987), a strong association can be found in relation to gravity, by replacing the function of the mass with the population and the strength of the gravitational interaction with distance between two countries (Yuniarti, 2007).
The gravity model is used to analyze the economic factors that affect the flow of trade between two countries. According to Lineman (Lapipi, 2005), the gravity model is an econometric model that is used to analyze the effects of economic integration on trade, as well as being an analytical tool that can be used to estimate the value of exported and imported goods in a region. The formulation of the gravity model was adopted from the general equation of Newton's law of gravity, which states, "The interaction between two objects is proportional to its mass and inversely proportional to the distance of each object". The statement is applied in the following formula: represents the distance of both countries and G is the constant.
Furthermore, through a logarithmic equation, the equation is converted into a linear form for the econometric analysis to provide a general form for gravity models. In this case, the constant G is converted into β0 and GDP is used as a measure for the economy of both countries.
Log (bilateral trade flow) = β0 + β1 log (GDP country 1) + β2 log (GDP country2) + β3 log (distance) + ε
Thus, the general formula of gravity models according to Bergstrand (1989), Koo, et al (1994) in Oktaviani (2009) is as follows:
countries and the interaction of the country’s economy. In econometrics, gravity models are empirically proven to be robust by including other factors such as income level, diplomatic relations and trade policies. Initially, gravity model theories had a weak theoretical basis, but over the years they have become very popular and more reliable in empirical studies of international trade flows.
17 empirical analysis of trading patterns compared with the other econometrics model which only predict full specialization of a country in commodity production and does not account for supporting factors such as the relative amounts of labor and capital in the country. Second, gravity models have been quite successful in estimating the trade flows between countries over the years. Third, more attention has been focused on empirically examining the trade impacts of a regional trade regulations (Frankel 1997 in Ghosh, et al., 2005).
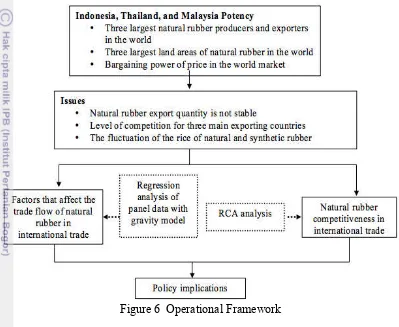
Figure 6 Operational Framework
Essentially, the gravity model explains the flow of trade based on the distance between countries and the interaction between the sizes of each country’s economy (GDP). The flow of trade between countries is determined by several variables, namely: the variables that represent the total potential demand of the importing country which can be described by real GDP of the importing country, the total potential supply of the exporting country which can be described by the real GDP or production of a commodity of the exporting country, and the variables that either support or inhibit the flow of trade between the two countries, for instance, distance, remoteness export commodity prices, exchange rates, export policies, and regional trade agreements (Figure 6).
3.4 Export and Exchange Rate
18
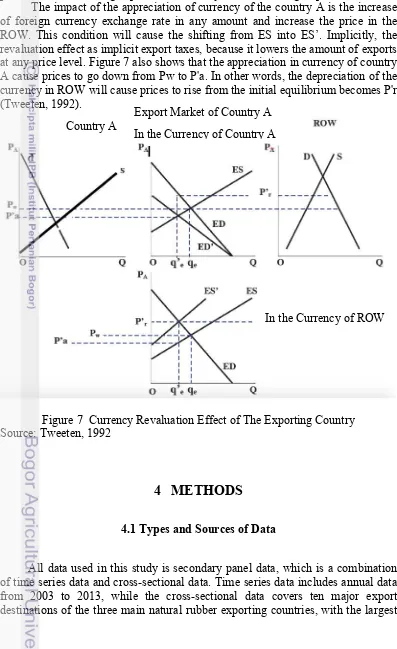
Appreciation in the exchange rate of country A will shift the excess demand from the ED to ED’ vecause ROW only be willing to pay a lower price. At the end of this condition will cause the domestic price in country A dropped, increasing the price in ROW, lowering exports from country A, and reducing imports in ROW.
The impact of the appreciation of currency of the country A is the increase of foreign currency exchange rate in any amount and increase the price in the ROW. This condition will cause the shifting from ES into ES’. Implicitly, the revaluation effect as implicit export taxes, because it lowers the amount of exports at any price level. Figure 7 also shows that the appreciation in currency of country A cause prices to go down from Pw to P'a. In other words, the depreciation of the currency in ROW will cause prices to rise from the initial equilibrium becomes P'r (Tweeten, 1992).
Figure 7 Currency Revaluation Effect of The Exporting Country Source: Tweeten, 1992
4
METHODS
4.1 Types and Sources of Data
All data used in this study is secondary panel data, which is a combination of time series data and cross-sectional data. Time series data includes annual data from 2003 to 2013, while the cross-sectional data covers ten major export destinations of the three main natural rubber exporting countries, with the largest
Country A
Export Market of Country A
19 export volumes going to the United States, Japan, China, Singapore, the Republic of Korea, Germany, Canada, Brazil, India, and Belgium. The data used were obtained from Statistics Indonesia (BPS), the International Rubber Study Group (IRSG), the United States Department of Agriculture (USDA), the Centre d'Etudes et d'Informations Internationales prospectives (CEPII), UN Comtrade, the World Bank, and FAOSTAT. Types and sources of data for the study are summarized in Table 2.
Table 2 Type and Source of Data
No Type of Data Unit Source of Data
1 Natural Rubber Export Volume KG UN COMTRADE
2 Natural Rubber Production KG FAOSTAT
3 Real GDP US$ WDI
4 Distance Km CEPII &
timeanddate.com
5 Exchange Rate WDI
4.2 Analysis Method
4.2.1 Descriptive Analysis
The descriptive analysis is an analytical method that is used to describe the general condition of a phenomenon. The purpose of descriptive analysis is to facilitate the interpretation or explanation in the estimation result of the data. In this study, a descriptive analysis is used to describe a general overview of the international trade of natural rubber specifically the development of the sector from upstream to downstream in the world trade system.
Additionally, descriptive analysis is used to analyze the dynamics of international trade flows, as well as the competitiveness of the commodity as a means of support for the result of the quantitative analysis. Some of the techniques are used to compile the data in the form of tables or graphs, along with the interpretation of the data and presented arguments. Descriptive analysis and graphical tabulation are the simplest methods, yet still have a strong capability to qualitatively explain the relationship between the observed variables.
4.2.2 Revealed Comparative Advantage (RCA)
20
where Xij is the export value of natural rubber commodity from country j,
Xit equals the value of total exports for country j, Wj represents the world export
value of natural rubber commodity and Wt is the total value of world exports.
The competitiveness index value of a commodity in the RCA has two possibilities, namely:
1. If RCA> 1, it indicates that the share of natural rubber commodity in the total exports of country j is greater than the average share of natural rubber export in all countries (the world). This means that country j has a comparative advantage, so it is relatively more specialized in natural rubber commodity.
2. If RCA <1, it shows that the share of natural rubber commodity in the total exports of country j is less than the average share of export natural rubber commodity in all countries (the world). This means that country j does not have a comparative advantage, so the country will not specialize in natural rubber commodity.
By entering a number of dgit = 1 (g=i), the initial equation becomes: �!" = �!�!!"+�!�!!"+⋯+�!�!"#+�!"! �+�!"
This equation can be estimated with the OLS approach in order to obtain the parameter βLSDV. The advantage of the LSDV approach is that it can generate
the estimated parameter, β, which is unbiased and efficient. The weakness of this approach, however, is that if the research contains a large number of observation units, it looks "unmanageable". To test whether the intercept is significant or not, the F-test can be used with the following hypotheses:
�! =�! =�! = �! =⋯ =�!
H1= one value of α is not the same.
The hypothesis can be directly used to test whether it is better to use the PLS or the LSDV approach. The basic rejection of H0 is to use the F-statistic that
21 where R2DV equals the R2 of LSDV, R2p is the R2 of PLS and K is the
number of variables.
If the value of the F-stat test result is greater than the values in the F-table, then there is evidence for the rejection of the null hypothesis so that the assumption that α is the same for all individuals can be rejected.
4.3 Model Formulation
The dependent variable used in the model is the natural rubber export volume to the destination countries. Meanwhile, the independent variables are, among others, the natural rubber production from exporting countries, the real GDP of destination countries, remoteness, and the real exchange rate. The gravity equation model of natural rubber in international trade can be formulated as
(kg), the variable RGDPjt represents the real GDP of country j (US$), Rjt accounts
for the remoteness of country j, ERijt is the currency exchange rate from country i
to country j, with α
!�! representing the dummy variable for the exporting country effect and γ!�! representing the dummy variable for the importing country effect.
β! indicates the intercept, while β! indicates the parameter (n= 1, 2, …, N), t is and magnitude of the coefficient results are in accordance with economic theory.
4.4.2 Econometric Criteria a. Autocorrelation
22
b. Heteroskedasticity
Heteroskedasticity occurs due to the variance of the error term not being consistent, so that it does not satisfy the Gauss Markov theorem; this is a problem that is commonly seen in cross-sectional data. The impact arising from heteroskedasticity issues, among others, is that the variance is not constant, causing the value of the variance to be larger than estimated. The high variance causes the hypothesis test (F-test and t-test) to become less precise, with the confidence intervals becoming larger due to large standard errors, and further resulting in an improper conclusion. To eliminate these problems, the cross-sectional weighted regression should be applied; this is otherwise known as the Generalized Least Squares (GLS) method (Nachrowi, 2006).
Table 3 Identification Framework of Autocorrelation
DW Value
4-dl < DW < 4 Reject H0, negative autocorrelation
4-dl < DW < 4-dl Results cannot be determined
2 < DW < 4-du Accept H0, there is no autocorrelation
du < DW < 2 Accept H0, there is no autocorrelation
dl < DW < du Results cannot be determined 0 < DW < dl Positive autocorrelation
c. Multicollinearity
Multicollinearity indicates a strong linear relationship between the independent variables in a multiple regression analysis. According to Gujarati (2011), the presence of multicollinearity can be determined as follows: the sign of the coefficient is not as expected, and have high r2 but in the result of many individual-test (t-test) is not significant. In other words, if the correlation between the variable is high (rij > 0.8), R2 < rij indicates that multicolinearity happens.
The presence of multicollinearity leads to the inability to determine the least squares coefficient, as well as the variance and the covariance values of the coefficients becoming infinite. Multicollinearity also leads to a high standard error in the statistical equation, which causes the confidence interval to become larger and further results in the coefficient value becoming imprecise.
d. Normality
The Normality test is conducted to determine whether the error term is close to a normal distribution or not. A normality test of the error term is conducted by using the Jarque Bera test, with the following hypotheses:
H0: α = 0, the error term is normally distributed
H1: α ≠ 0, the error term is not normally distributed
The region of acceptance is Jarque Bera <X2 df-2 ; probability (p-value)> α),
whereas the rejection region (Jarque Bera> X2 df-2 ; probability (pvalue) <α).
Normality of the data is required in the multiple regression analysis; due to this method is one of parametric analysis method. Normality is determined through the equitable distribution of the regression of each value. The acceptance of H0
23
4.4.3 Statistical Criteria
There are several tests that can be used to determine the suitability of the statistically derived regression model.
a. F-Test
The F-test is a statistical test used to determine the effect of independent variables on the dependent variable as a whole. The first step in performing the F-test is to determining and writing the hypotheses.
H0: β1 = β2 = ... = βt = 0
(No independent variables that affect the dependent variable) H1: at least one βt ≠ 0
(At least one of the independent variables significantly influences the dependent variable).
1. If the F-statistic < significance level (α), then reject H0 and it conclude that at
least one independent variable affects the dependent variable.
2. If the F-statistic > significance level (α), then accept H0 and conclude that
there are no independent variables that affect the dependent variable.
b. T-Test
The T-test is a statistical test used to measure whether the parameters of the equation are individually significant or not, and is also known as a partial test of significance because the significance of each variable can be observed in the model. A T-test is used in this study to determine the effect of each explanatory factor to the three main exporters of natural rubber. The first step to performing a t-test is determining and writing the hypotheses.
H0: βt = 0 to t = 1,2,3, ...., N
H1: ≠ 0 βt
If the t-statistic obtained on the real level of α is greater than in the t-table (t-statistic > t-table), then H0 is rejected. Rejection of the H0 (�=0) implies that
the variables tested significantly affect the dependent variable. Conversely, if the t-statistic is less than in the t-table (t-statistic < t-table) on the real level of α, then H0 is accepted. Accepting H0 (β = 0) indicates that the variables tested did not
significantly affect the dependent variable. A smaller α implies further risk reduction. The result of the model is expected to be better with each additional independent variable that has a significant effect on the dependent variable.
c. R2 and adj-R2 Test