THE INTELLECTUAL CAPITAL EFFECT ON
FINANCIAL PERFORMANCES AT ISLAMIC INSURANCE
Rizqon Halal Syah Aji & Kurniasih1
Abstract. he Intellectual Capital Efect on Financial Performances at Islamic Insurance. he research has analyzed the intellectual capital efect of the Islamic insurance company’s inancial performance. Intellectual capital is quantiied by VAICTM (Value Added Intellectual Capital), for eiciency components
are physical capital coeicient (VACA), human capital coeicient (VAHU), and structural capital coeicient (STVA). Financial performance is quantiied by ROA and RBC. Data is given from seven Islamic insurance companies during 2009-2013. Data analysis used is PLS (Partial Least Square). he result shows that intellectual capital factors had an afect the company’s inancial performance. Intellectual capital relation to inancial performance parameter value estimated coeicient 0,845 with t-statistic 46,771. VAICTM enables to elucidate inancial
performance variable 71, 6%, is by inding the R-square PERF value (inancial performance) 0,716.
Keyword: Intellectual capital, inancial performance, Partial Least Square (PLS)
Abstrak. Pengaruh Modal Intelektual Terhadap Kinerja Keuangan pada Asuransi Syariah. Penelitian ini menganalisis pengaruh modal intelektual terhadap kinerja keuangan di industri asuransi syariah. Modal intelektual dijelaskan dengan VAICTM (Value Added Intelectual Capital), sedangkan komponen
eisiensi ialah koeisien modal isik (VACA), koeisien modal manusia (VAHU), dan koeisie modal structural (STVA). Kinerja keuangan dikuantiikasikan dengan ROA dan RBC. Data yang digunakan ilah dari tujuh perusahaan asuransi syariah selama 2009 – 2013. Data dianalisis dengan partial least square. Hasil yang ada menunjukkan bahwa faktor modal intelektual memiliki pengaruh terhadap kinerja keuangan perusahaan. Modal intelektual memiliki hubungan terhadap parameter kinerja keuangan dengan nilai estimasi sebesar 0,845 dengan nilai t-hitung sebesar 46,771. VAICTM mampu mendorong variabel kinerja keuangan
sebesar 71,6%, hal ini diperlihatkan dengan nilai R2 sebesar 0,716.
Kata Kunci: Modal intelektual, kinerja keuangan, partial least square
First draft: January, 10th 2015, Revision: February, 27th 2015, Accepted: March, 20th 2015 1 Syarif Hidayatullah State Islamic University. Jl. Ir. H. Juanda No. 95, Ciputat, South
Tangerang, Banten, Indonesia.
Introduction
Knowledge based industries concept leads to new business view. It exposes old paradigm of business view which is dominant on labor based business view. Ambar Widyaningrum (2004) igure out that knowledge based industries is transformation, capitalization and knowledge transfer process as a media to get earning. It can be new reference of knowledge based industries concept and it is crucial in uplifting company’s performance, especially in inance reporting.
In this research, it will be appeared quantifying of Intellectual capital by “Value Added Intellectual Coeicient” (VAICTM). Ante Public ofered a measure
unit to asses value added eiciency as a result of company intellectual ability. Primary components of VAICTM are comprises of physical capital (VACA – value added capital
employed), human capital (VAHU – value added human capital) and structural capital (STVA – structural capital value added). Furthermore, Ante Public said that intellectual ability (VAICTM) indicates how both of human resource (physical capital
and intellectual capital) has already used by some companies eiciently.
he role of human resource in Islamic insurance have important role, is agent to uplift up selling. On the other research also indicating that area of information technology (IT), marketing and human resource of Islamic insurance are needed to develop, because it will afect company proit. hose indicate that if company would invest in developing human resource, infrastructure, or marketing, those will become intellectual capital and value added of the company.
Indonesian insurance have no identify yet intellectual capital seriously as important factor. Till know, several companies in Indonesia have tend to use conventional based in forming their business. So that, products were produced meritless technology touching. Some instances are human capital, structure capital and customer capital. hose are indicated by many cases of fraud agent, claim matter. hose are diicult to break out and technology use have not maximized yet. hose matters come up a research challenge of intellectual capital problematic. Based on problems above, in this research will be elucidated: irst, How to do treating, measuring and exposing intellectual capital of insurance company in Indonesia? Second, How to report intellectual capital which is able to afect for inance performance of Islamic insurance company?
Literature Review
capital is the results of three main organization elements (human capital, structural capital, costumer capital) have relation to knowledge and information rendering value added and eminency for company to compete.
Ante Public submitted that eiciency measure for assessing of value added is the result company intellectual ability (Ihyaul Ulum, 2009). VAIC™ model quantiied intellectual capital to create value depend on the third relation of main components are physical capital, human capital, and structural capital. he irst relation of VA using physic capital (CA) is called “value added capital coeicient” (VACA). It is indicator that is VA created by a physic capital. VACA draws how many value added of company created from capital used. In inance commentary, capital employed for equity accounting. If a unit of CE generating return bigger than other companies, means the company better in employing its CE. So that, CE employing for IC forming efort better. Human Capital Coeicient (VAHU) describes how much VA enables to deliver through expended fund for employs. he relation between VA and HC identiied capability of HC to compose company value. HC is represented by employs expense in inance commentary for personnel expense. he third relations are Structural Capital Coeicient (STVA) that emerging structural capital (SC) contribution to form value. STVA assesses SC total needed to yield one rupiah from VA and it indicates how successful SC in creating value. Value Added Intellectual Coeicient (VAICTM) ratio created from additional coeicients
like VACA, VAHU, and STVA.
According to Fahmi (2006), performance is work achievements. It used for an organization or on a unit of organization. So that, if connect to the deinition, it can be drawn a simple deinition that inance performance can be understood as outcome of managers in accomplishing them loaded task which having relation to company inance managing.
he research aimed to quantify inance performance using two ratios: a. Return on asset (ROA) indicates how much net proit acquired by company if quantiied from active value. (Harahap, 2010). Firer and Williams in Ihyaul Ulum (2009) have already veriied that intellectual capital quantiied with VAICTM and having positive
efect for company inance performance. Besides that, it also demonstrates that intellectual capital has positive impact and company proitability is signiicance. It is indicated by ROA. Risk Based Capital (RBC) is fund suicient risk ratio to endure and become a main indicator to quantify insurance of company inance balancing, especially relate to solvability.
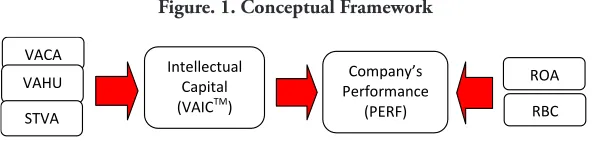
Based on the theories, the conceptual framework of this research is to ind relation between intellectual Capital (VAICTM) as exigent variable and company
Figure. 1. Conceptual Framework
Company’s Performance
(PERF) Intellectual
Capital (VAICTM) VACA
VAHU
STVA
ROA
RBC
Intellectual Capital (VAICTM) counted from VACA, VAHU and STVA are
exigent variable. Exigent variable will afect endogen variable. Company performance is quantiied by ROA and RBC endogen variable. he company performance will be afected by intellectual capital as exigent variable.
he irst time intellectual capital studies began of Stewart article on 1991, Brain Power – How Intellectual Capital Is Becoming America’s Most Valuable Asset. It arranged intellectual capital to being management agenda (Ihyaul Ulum, 2009). Stewart deines intellectual capital as intellectual matters (knowledge, information, intellectual property, experiencing) are valuable to have wealth. It is a thought collective power or useful set of insight. he research of Intellectual Capital ofered some deinitions. According to Moeheriono (2012), intellectual capital knowledge and ability have had by social collectivity: intellectual organizations, professionals and resource delegations of have high value and ability to run as knowledge.
Besides that, Sveiby (1998) in Sawarjuwono (2003), “he invisible intangible part of the balance sheet can be classiied as a family of three, individual competence, internal structural and external structure”. Kadir (2003), deines: Intellectual capital as the result of three main elements of organizations: human capital, structural capital, costumer capital. hey relate to knowledge and technology has more valuable for companies by privilege organization competing (Sawarjuwono and Kadir, 2003).
One of deinitions most used to describe intellectual capital is Organization for Economic Cooperation and Development (OECD) on 1999 told that intellectual capital is an economic account among two intangible asset categories: irst, organizational (structural) capital refers to software system, distribution network and circle of availability. Second, human capital comprises of human resource in the organization (employs) and external resources are consumer and supplier (Ihyaul Ulum, 2013).
formed an intellectual capital for companies.
Human capital refers to knowledge point; skill, innovation, and experience are owned by companies’ member. Many experts describe as owned knowledge of companies’ employs through training and education process. Human capital has important role for intellectual capital because it is being a customer capital invention process on human capital component and it is helped by structure capital. Human capital has interacted with customers to identify knowledge, skill, ability, and expected value by customers (Sangkala, 2006). Edvinson dan Manole exposes human capital as knowledge, skill, innovation and companies members’ ability to settle up tasks.
VAICTM method is promoted by Ante Public on 1997. Primary components
of VAICTM can be seen from companies sources based physic capital, human capital,
structural capital. Moreover, the model designed to provide information of value creation eiciency companies’ intangible asset. It began with companies ability to invent value added (VA). VA is being the most objective indicator to assess successful business and it represented companies ability in inventing value.VA is accounted as deviation among output and input.
In Tan et al. (2007) Output (OUT) represented revenue and included all products are sold in market. here is accounting of operational and non operational income in commentary inance. Input (IN) includes all expenses are used to get revenue. he important point of this model is labor expenses does not include IN because has active role in processing in IN, are value creation, intellectual potential (representing labor expenses) unaccounted as cost and not include in IN component. herefore, the keyword of Ante Public’s model is to treat employs as value creating entity. VA is afected by human capital eiciency (HC) and Structural Capital (SC).
Physical capital use or value added capital coeicient is being indicator that VA is yielded by a unit of physic capital. VACA represented how much companies’ value added have been invented from capital used. here are accounting equities in inance commentary capital employed. If a unit of CE delivering return better from other companies, means companies better to employing their CE. hereby, CE utilization might be being eforts to form better IC.
Human Capital Coeicient (VAHU) indicates how much VA produced through expensed fund for employs. he relation between VA and HC indentiied HC ability to invent companies’ value. HC is represented by employs’ expense in personnel accounting inance commentary.
software for companies supporting. Simply, it is supporting tool for employs. In this case, even though employs have high intelligence, but if they do not supported by adequate tools to apply some innovation, the capability would not employing intellectual capital. he third relations are structural capital coeicient (STVA) igure out structural capital in scoring. STVA quantifying SC total needed to deliver one rupiah from VA and it indicates how successful of SC in scoring.
Ante Public presented that SC are not independent standard as HC. It is dependent to value creation or as big HC contribution to value creation, as small SC contribution to it. Furthermore, Public said that SC is VA minus HC, it veriied by empirical research on traditional industry sector. Value Added Intellectual Coeicient (VAICTM) ratio yielded from coeicient addition of VACA, VAHU and
STVA. Public method’s has intrigue to gain data easily and lead to furthermore which will be conducted to other data resources. Data are needed to get standard ratio from various inance numbers audited and usually it is from companies inance reporting. Alternative IC measurement is limited to engage inance and non inance indicators are adjusted with individual companies’ proit (Roos et al., 1997 in Tan et al., 2007). hose indicators are unavailable or unwritten by other companies, especially non inance. he impact, capability to realize alternative IC steps have various samples for comparative analysis being lack consistent (Firer and Williams, 2003 in Tan et al., 2007).
Methods
his research is using quantitative approach to verify intellectual capital theories which afecting to inance performance. Intellectual capital is counted using VAICTM method and veriied using partial least square method. Moreover,
intellectual capital results are described and analyzed as data found and interpreted as real condition. Secondary data used are inance reporting yearly, such as balance sheet, income statement and statement of funds companies inancial health of the latest fund on 2009-2013 from insurance companies have being object of the research.
Discussion
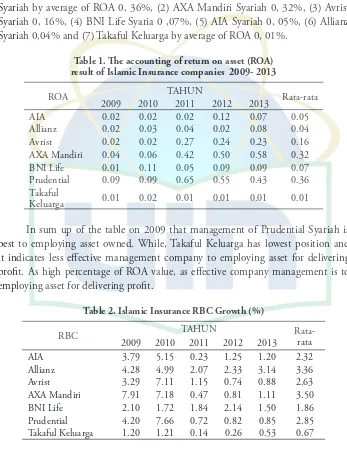
Referring the table indicates that ROA value growth is invented by each Islamic insurance companies for 2009 until 2013, ROA igures out companies management ability to draw income from asset management owned. Besides that, it can be seen that ROA value on 2009 until 2013 of highest to lowest: (1) Prudential Syariah by average of ROA 0, 36%, (2) AXA Mandiri Syariah 0, 32%, (3) Avrist Syariah 0, 16%, (4) BNI Life Syaria 0 ,07%, (5) AIA Syariah 0, 05%, (6) Allianz Syariah 0,04% and (7) Takaful Keluarga by average of ROA 0, 01%.
Table 1. he accounting of return on asset (ROA) result of Islamic Insurance companies 2009- 2013
ROA TAHUN Rata-rata
2009 2010 2011 2012 2013
AIA 0.02 0.02 0.02 0.12 0.07 0.05
Allianz 0.02 0.03 0.04 0.02 0.08 0.04
Avrist 0.02 0.02 0.27 0.24 0.23 0.16
AXA Mandiri 0.04 0.06 0.42 0.50 0.58 0.32
BNI Life 0.01 0.11 0.05 0.09 0.09 0.07
Prudential 0.09 0.09 0.65 0.55 0.43 0.36
Takaful
Keluarga 0.01 0.02 0.01 0.01 0.01 0.01
In sum up of the table on 2009 that management of Prudential Syariah is best to employing asset owned. While, Takaful Keluarga has lowest position and it indicates less efective management company to employing asset for delivering proit. As high percentage of ROA value, as efective company management is to employing asset for delivering proit.
Table 2. Islamic Insurance RBC Growth (%)
RBC TAHUN
Rata-rata 2009 2010 2011 2012 2013
AIA 3.79 5.15 0.23 1.25 1.20 2.32
Allianz 4.28 4.99 2.07 2.33 3.14 3.36
Avrist 3.29 7.11 1.15 0.74 0.88 2.63
AXA Mandiri 7.91 7.18 0.47 0.81 1.11 3.50
BNI Life 2.10 1.72 1.84 2.14 1.50 1.86
Prudential 4.20 7.66 0.72 0.82 0.85 2.85
he Table 2 igures out that RBC value growth for each Islamic insurance company during 2009 until 2013. Also it indicates adequacy capital of risk is borne by insurance company. In inance ministry regulation of 11/PMK.010/2011 about inance health of insurance business and reinsurance to Islamic principle, company have to maintain latest fun solvability by seeing inance health achievement ratio of latest fund the lowest 30 % from fund needed to anticipate the risk of possible loss caused of deviation in asset managing or responsibility. Moreover, the table identiied that Islamic insurance company has already fulilled lowest RBC standard, is 30%.
he highest RBC of Islamic insurance companies are (1) AXA Mandiri Syariah 350%, (2) Allianz Syariah 336% (3) Prudential Syariah 285%, (4) Avrist Syariah 263%, (5) AIA Syariah 232%, (6) BNI Life Syariah 186% and (7) Takaful Keluarga 67%. Referring to the RBC value, the seven companies has already fulilled of solvability by RBC value more 30 %
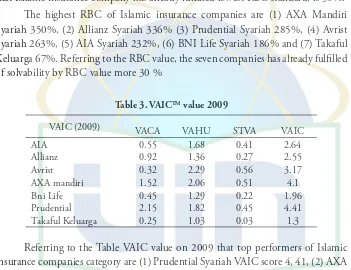
Table 3. VAICTM value 2009
VAIC (2009) VACA VAHU STVA VAIC
AIA 0.55 1.68 0.41 2.64
Allianz 0.92 1.36 0.27 2.55
Avrist 0.32 2.29 0.56 3.17
AXA mandiri 1.52 2.06 0.51 4.1
Bni Life 0.45 1.29 0.22 1.96
Prudential 2.15 1.82 0.45 4.41
Takaful Keluarga 0.25 1.03 0.03 1.3
Referring to the Table VAIC value on 2009 that top performers of Islamic insurance companies category are (1) Prudential Syariah VAIC score 4, 41, (2) AXA Mandiri VAIC score 4, 1 dan (3) Avrist Syariah VAIC score 3, 17. It indicates that the three Islamic insurance companies quite eicient to use their concrete assets, are physic and intangible asset by agent ability to serve insurance members.
Table 4. VAICTM Value 2010
VAIC (2010) VACA VAHU STVA VAIC
AIA 0.42 1.58 0.37 2.37
Allianz 0.87 1.36 0.27 2.5
Avrist 0.25 2.25 0.56 3.05
AXA mandiri 1.7 2.39 0.58 4.67
Bni Life 0.59 1.09 0.09 1.77
Prudential 1.52 2 0.5 4.02
Takaful Keluarga 0.39 1 0.005 1.38
he VAIC on 2010 stated that no signiicant from previous year. he Islamic insurance companies are included top performers category still similar as previous year. But they are little decline and rise: (1) AXA Mandiri VAIC 4, 67 (2) Prudential Syariah VAIC 4, 02 and (3) Avrist Syariah VAIC 3, 05.
he islamic insurance companies are included in good performers category are (1) Allianz Syariah VAIC 2, 5, and (2) AIA Syariah VAIC 2, 37. hen, BNI Life Syariah is common performer category is VAIC 1, 77 and Takaful Keluarga VAIC 1, 38 is still bad performer category. It is afected by forming value of structure capital value added is structure capital has decline. On 2010 net of total income has declined but employs expenses (commission and acquisition fee) is increased.
Table 5. VAICTM Value 2011
VAIC (2011)
VACA VAHU STVA VAIC
AIA 2.17 1.09 0.08 3.33
Allianz 3.9 0.91 -0.09 4.72
Avrist 0.3 1.36 0.27 1.93
AXA mandiri 0.51 4.44 0.77 5.72
Bni Life 0.31 1.72 0.42 2.45
Prudential 3.42 2.68 0.63 6.73
Takaful Keluarga 0.53 1.06 0.05 1.64
Mandiri VAIC 5, 72, (3) Allianz Syariah VAIC 4, 72. he STVA of Allianz syariah is -0, 09. It is caused employs expense bigger than value added (VA = OUT-IN). his is in line with Ante Public’s theory has stated that as big contribution of HC in value creation, as smaller SC contribution. he last is (4) AIA syariah VAIC 3, 33.
Islamic insurance companies which are included in good performers category is BNI Life Syariah VAIC 2, 45. Common performers are yaitu(1) Avrist Syariah 1, 93 is decline from previous year in top performer category. It is caused by decline of VAHU and STVA value. (2)Takaful VAIC 1, 64 rise from VAIC previous year being a common performer.
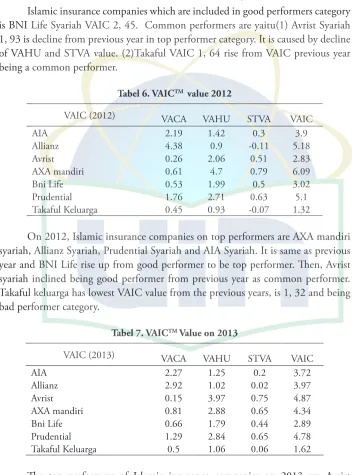
Tabel 6. VAICTM value 2012
VAIC (2012) VACA VAHU STVA VAIC
AIA 2.19 1.42 0.3 3.9
Allianz 4.38 0.9 -0.11 5.18
Avrist 0.26 2.06 0.51 2.83
AXA mandiri 0.61 4.7 0.79 6.09
Bni Life 0.53 1.99 0.5 3.02
Prudential 1.76 2.71 0.63 5.1
Takaful Keluarga 0.45 0.93 -0.07 1.32
On 2012, Islamic insurance companies on top performers are AXA mandiri syariah, Allianz Syariah, Prudential Syariah and AIA Syariah. It is same as previous year and BNI Life rise up from good performer to be top performer. hen, Avrist syariah inclined being good performer from previous year as common performer. Takaful keluarga has lowest VAIC value from the previous years, is 1, 32 and being bad performer category.
Tabel 7. VAICTM Value on 2013
VAIC (2013) VACA VAHU STVA VAIC
AIA 2.27 1.25 0.2 3.72
Allianz 2.92 1.02 0.02 3.97
Avrist 0.15 3.97 0.75 4.87
AXA mandiri 0.81 2.88 0.65 4.34
Bni Life 0.66 1.79 0.44 2.89
Prudential 1.29 2.84 0.65 4.78
Takaful Keluarga 0.5 1.06 0.06 1.62
syariah, Prudential Syariah, AXA mandiri syariah, Allianz syariah, AIA syariah. BNI life syariah is good performer and Takaful keluarga is common performer.
Table 8. VAICTM Value 2009-2013
VAIC TAHUN Rata-rata
2009 2010 2011 2012 2013
AIA 2.64 2.37 3.33 3.9 3.72 3.192
Allianz 2.55 2.5 4.72 5.18 3.97 3.784
Avrist 3.17 3.05 1.93 2.83 4.87 3.17
AXA mandiri 4.1 4.67 5.72 6.09 4.34 4.984
Bni Life 1.96 1.77 2.45 3.02 2.89 2.418
Prudential 4.41 4.02 6.73 5.1 4.78 5.008
Takaful Keluarga 1.3 1.38 1.64 1.32 1.62 1.452
he table describes wholly VAIC average for 2009-20013. he top performers of the period are (1) Prudential Syariah VAIC 5, 008; (2) AXA mandiri VAIC 4, 98; (3) Allianz VAIC 3,784; (4) AIA VAIC 3, 192; and (5) Avrist VAIC 3, 17. While, BNI Life Syariah VAIC 2, 418 is included in god performer and Takaful keluarga VAIC 1,452 is bad performer. he VAIC is proposed by Public is a model has pointed out how companies ability to manage and to maximize their intellectual asset for creating value of companies. hose igureics show up that Islamic insurance VAIC value every year have declined and inclined but the trends are tend to stable. Prudential Syariah and AXA Mandiri Syariah are Islamic insurance companies have top performer of VAIC value from 2009 to 20013. In the igureic, they can be seen that VAIC is 4, 0 and 7, 0. Avrist Syariah is included on top performer on 2009-2010 and it is in 3.0-4.0; but on 2011 has declined, is 2, 0. After that, Avrist Syariah has inclined trend on 2013, is 4, 87.
On 2009-2010 AIA Syariah and Allianz Syariah are in 2, 0 – 3, 0; then, they have inclined from 2011-2013 and being top performers. BNI Life Syariah and Takaful Keluarga in VAIC 1, 0—2, 0 for 2009-2010. he next year, BNI Life Syariah has better trend even though little, is 2, 0 – 3 ,0; meanwhile, Takaful Keluarga has stable trend in 1, 0 – 2, 0.
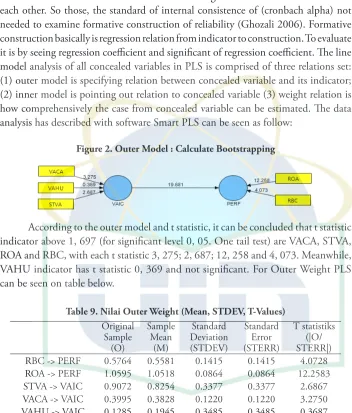
Formative indicator is assumed as among indicator have no correlation each other. So those, the standard of internal consistence of (cronbach alpha) not needed to examine formative construction of reliability (Ghozali 2006). Formative construction basically is regression relation from indicator to construction. To evaluate it is by seeing regression coeicient and signiicant of regression coeicient. he line model analysis of all concealed variables in PLS is comprised of three relations set: (1) outer model is specifying relation between concealed variable and its indicator; (2) inner model is pointing out relation to concealed variable (3) weight relation is how comprehensively the case from concealed variable can be estimated. he data analysis has described with software Smart PLS can be seen as follow:
Figure 2. Outer Model : Calculate Bootstrapping
According to the outer model and t statistic, it can be concluded that t statistic indicator above 1, 697 (for signiicant level 0, 05. One tail test) are VACA, STVA, ROA and RBC, with each t statistic 3, 275; 2, 687; 12, 258 and 4, 073. Meanwhile, VAHU indicator has t statistic 0, 369 and not signiicant. For Outer Weight PLS can be seen on table below.
Table 9. Nilai Outer Weight (Mean, STDEV, T-Values) Original RBC -> PERF 0.5764 0.5581 0.1415 0.1415 4.0728 ROA -> PERF 1.0595 1.0518 0.0864 0.0864 12.2583 STVA -> VAIC 0.9072 0.8254 0.3377 0.3377 2.6867 VACA -> VAIC 0.3995 0.3828 0.1220 0.1220 3.2750 VAHU -> VAIC 0.1285 0.1945 0.3485 0.3485 0.3687
Figure. 3. PLS Result: Recalculate Bootstrapping
After eliciting indicators have no signiicant and just engaging the signiicant indicators or close to signiicant, it can be known that each variables have weight 0, 050 (positive) and signiicance t statistic to p <0, 05.
Table 10. Recalculate Outer Weight (Mean, STDEV, T-Values) Original
Sample (O)
Sample Mean
(M)
Standard Deviation (STDEV)
Standard Error (STERR)
T statistiks (|O/ STERR|) RBC -> PERF 0.6040 0.5948 0.1203 0.1203 5.0208 ROA -> PERF 1.0530 1.0435 0.0814 0.0814 12.9384 STVA -> VAIC 1.0237 1.0151 0.0841 0.0841 12.1763 VACA -> VAIC 0.4031 0.3984 0.1086 0.1086 3.7125
Referring to the table that model has already it because each variables have weight >0, 5 and t-statistic >1, 697. PLS test pointed out that all indicators forming VAIC. VACA and STVA are signiicant and both ROA and RBC have signiicant for inance performance (PERF).
Structural model test is committed by inding R-square value has goodness– it model. In addition, this test inds construct relation between signiicant value and R-square of the research model.
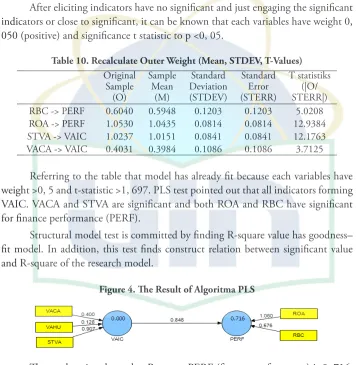
Figure 4. he Result of Algoritma PLS
he result pointed out that R-square PERF (inance performance) is 0, 716, means VAIC variable is able to deliver PERF variable 71, 6 %. he rest is delivered by another variable. he next test is to ind signiicant of VAIC efect of inance performance by identifying coeicient parameter and t-statistic signiicant.
high of VAIC, the inance performance of Islamic insurance is as high company by signiicant t-statistic 46, 771. herefore, t-statistic is bigger than t-table 1, 697. he PLS test indicates that intellectual capital has afected to company’s inance performance. he relation both of them ofered parameter coeicient estimation 0, 845 and signiicant to 0, 05 (t-signiicant table 0, 05 = 1, 697) with t-statistic 46, 771. VAIC variable enables to present inance performance variable 71, 6%, is by inding R-square PERF (inance performance) 0, 716.
he analysis aforded that as high of intellectual capital value of company owned, the company performance is increase. It means that the company has managed its intellectual resource maximally, it afordable valued added that will afect to company’s inance performance increasing. he context of path power between intellectual capital and inance performance has found is in line and supporting Tan and friends’ work (2007); Zulianti and Arya (2011), also Alipour (2012). But, the research inding is inconsistent with previous inding when indentifying weight and each signiicant indicator. he testimonies are proposed by Tan and friends (2007); Zulianti and Arya (2011); Alipour (2012) stated out that three components of VACA, VAHU and STVA as signiicant statistic to form VAIC and have inluence to company’s inance performance.
Meanwhile, the research inding ofers evidence that only VACA and STVA as signiicantly statistic forming VAIC construct for ive years observation to Islamic insurance companies (2009-2013). It can be explained that the research taking sampling of Islamic insurance companies are running in employs service ability (agent of Islamic insurance) and structural capital use like software to support insurance claim service. Nevertheless, in Indonesia, the progress years of growth observing to join with Islamic insurance is not accompanied with insurance experts of human capital growth. he big cost incurred for employs have not inlict signiicant yet of company intellectual capital. It caused the total of insurance experts to handle it is still lack.
Furthermore, RBC and ROA indicators are statistically represent Islamic insurance company, because PLS of both indicators are signiicant. Intellectual capital is able to inluence inance performance. Finance performance of this research is pointed out by ROA and RBC. he main purpose of this research is to analyze intellectual capital efect of inance performance in Islamic insurance companies. Intellectual capital is quantiied by Value Added Intellectual Capital (VAICTM). Moreover, inance performance of Islamic insurance is quantiied by
Conclusion
Intellectual capital has efect to company’s inance performance. Intellectual capital relation to inance performance is allowing parameter coeicient estimation 0, 845 and signiicant 0, 05 (t-signiicance table 0, 05 = 1, 697) with t-statistic 46, 771. As high of intellectual capital company owned, the company inance performance is increase. It means, company has managed its intellectual capital maximally be able to create value added which impacted to inclined of company inance performance. Finally, VAICTM variable enabling to explain inance performance variable 71, 6 %,
is by inding R-square PERF (inance performance) 0, 716.
he research inding ofers evidence that only VACA and STVA as signiicantly statistic forming VAIC construct for ive years observation to Islamic insurance companies (2009-2013). It can be explained that the research taking sampling of Islamic insurance companies are running in employs service ability (agent of Islamic insurance) and structural capital use like software to support insurance claim service.
References
Ainurridha. 2014. Pengaruh Intellectual Capital terhadap Proitabilitas. (Unpublished hesis). Jakarta: UIN Syarif Hidayatullah Jakarta.
Amrin, A. 2009. Bisnis, Ekonomi, Asuransi, dan Akuntansi Keuangan Syariah. Jakarta: PT Grasindo.
Antonio, M. S. et.al. 2012. An Analysis of Islamic Banking Performance: Maqashid
Index Implementation in Indonesia and Jordania. Journal of Islamic Finance,
Vol. 1 No. 1 (2012), pp. 012-029.
Fahmi, I. 2006. Analisis Investasi dalam Perspektif Ekonomi dan Politik. Bandung: PT. Raika Aditama.
Ghoni, A. & E. Arianty. 2007. Akuntansi Asuransi Syariah antara Teori dan Praktik. Jakarta: INSCO Consulting.
Ghozali, I. 2006. Structural Equation Modeling - Metode Alternatif dengan Partial
Least Square. Semarang: Badan Penerbit Universitas Diponegoro.
Gitosudarmo, I & Basri. 2002. Manajemen Keuangan. Yogyakarta: BPFE.
Harahap, S.S. 2010. Analisis Kritis atas Laporan Keuangan. Jakarta: Rajawali Press.
Hutapea, P & N. hoha. 2008. Kompetensi Plus Teori Desain, Kasus dan Penerapan
untuk HR serta Organisasi yang Dinamis. Jakarta: Gramedia Pustaka Utama.
(Unpublished hesis). Semarang: University of Diponegoro.
Petty, R. & Guthrie, J. 2000. Intellectual Capital Literature Review. Measurement, Reporting and Management. Journal of Intellectual Capital, Vol 1 No. 2 , (2000): pp. 155-176.
Prastowo, D. 2011. Analisis Laporan Keuangan Konsep dan Aplikasi. Yogyakarta: Sekolah Tinggi Ilmu Manajemen YKPN.
Puspitawati, L. & Reza, C. N. 2012. Analisis Pemeringkat Intellectual Capital
Performance dan Pengaruhnya Terhadap Kinerja Keuangan Perbankan. Jurnal
Ekono Insentif Kopwil 4 Vol. 6 No.1 , (Juli 2012), pp. 1-9.
Rustandi, R. 2012. Pengaruh Intellectual Capital terhadap Kinerja Keuangan pada
Perusahaan Retail yang Terdapat di Bursa Efek Indonesia Tahun 2009-2011.
(Unpublished hesis). Bandung: Universitas Pendidikan Indonesia.
Salim, S. M. & Karyawati, G. 2013. Pengaruh Modal Intelektual terhadap Kinerja Keuangan. Journal of Business and Enterpreneurship, Vol. 1 No. 2 , (Mei 2013), pp. 74-91.
Sangkala. 2006. Intellectual Capital Management Strategi Baru Membangun Daya Saing Perusahaan. Jakarta: Yapensi.
Sawarjuwono, T., & Kadir, A. P. “Intellectual Capital: Perlakuan, Pengukuran dan Pelaporan (Sebuah Library Research).” Jurnal Akuntansi & Keuangan,Vol 5 No. 1 , (Mei 2003): h. 35-57.
Suhendah & Rousilita. 2012. Pengaruh Intellectual Capital terhadap Proitabilitas, Produktivitas dan Penilaian Pasar pada Perusahaan yang Go Public di Indonesia
pada Tahun 2005-2007. Simposium Nasional Akuntansi XV, Banjarmasin,
2012.
Tan, H. P. et.al. 2007. Intellectual Capital and Financial Return of Companies. Journal of Intellectual Capital Vol. 8 No. 1 , (2007), pp. 76-95.
Tanjung, H., & A. Devi. 2013. Metode Penelitian Ekonomi Islam. Jakarta: Gramata Publishing.
Ulum, I. 2008. Intellectual Capital Performance Sektor Perbankan di Indonesia. Jurnal Akuntansi dan Keuangan Vol. 10 No. 2 , (November 2008), pp. 77-84. Ulum, I. 2009. Intellectual Capital Konsep dan Kajian Empiris. Yogyakarta: Graha
Ilmu.
Wibowo. 2006. Manajemen Kinerja. Jakarta: Raja Graindo.
Widyaningrum, A. 2004. Modal Intelektual. Jurnal Akuntansi dan Keuangan Indonesia, Vol. 1 , (2004), pp. 16-25.