EFFICIENCY OF THE TEXTILE INDUSTRIES AND PRODUCTS IN CENTRAL JAVA INDONESIA
Hertiana Ikasari Ida Farida
Faculty of Economics and Business, Dian Nuswantoro University Semarang
Abstract
Textiles and textile product industry, or commonly known as TPT industry is one of the pioneer industries and Indonesian’s manufacturing backbones. Textile industry does not only play an important role for the national economy, but also to the economy of Central Java Province. The industry is a priority industrial sector for Central Java Province. Nevertheless, there were still many problems faced which ultimately weakened the competitiveness of the textile industries in the world market. The aim of this research was to analyze the efficiency of the textile industries in Central Java in 2010-2011. The data used was 10 Indonesian Standard Industrial Classification (ISIC) of four digits of the Central Bureau of Statistics, Central Java. The output variable used in this reseaerch was the value of output, and the input variables were the cost of raw and auxiliary materials, expenditures for labor, purchased electricity and fuel, and lubricant expenses. This research used the data analysis tools of Data Envelopment Analysis (DEA). The results show that, in 2010, more than 60% of the textile industries in Central Java could produce their outputs with a number of existing inputs. Of 10 KBLIs of TPT industries in Central Java, six KBLIs worked efficiently based on the measurement of CRS and eight KBLIs worked efficiently based on the measurement of VRS in 2010. In 2011, more than 50% of TPT industries in Central Java could produce the outputs with a number of existing inputs. Of 10 KBLIs of TPT industries in Central Java, five KBLIs worked efficiently based on the measurement of CRS and five KBLIs worked efficiently based on the measurement of VRS in 2011. The suggestion given was that the textile industries in Central Java should be able to minimize inefficiencies in their production processes. Keywords: Efficiency, textile and clothing industry, DEA
INTRODUCTION
Textiles and textile product industry, or commonly known as TPT industry is
one of the pioneer industries and Indonesian’s manufacturing backbones. The
strategic position of the industry is increasingly apparent when viewed from the side
of its contribution to the economy, especially in the form of export earnings and
The importance of TPT industry can be seen from its role as one of basic
human needs other than food and shelter. Therefore, the consumption of clothing will
tend to increase as the population rate growth (Herman, 2011). Currently, TPT
industry is selected as one of 32 priority industries the government declared in the
National Industrial Development Policy (KPNI) (Kuncoro, 2009).
Textile industry does not only play an important role for the national economy,
but also to the economy of Central Java Province. The industry is a priority industrial
sector for Central Java Province. The data of the Industrial and Trade Agency of
Central Java (Disperindag) shows that in the textile industry in 2009 there were 718
business units which were able to absorb 154,964 workers and generates the output of
IDR 30.531 billion. Meanwhile, from the apparel sector in the same year, there were
913 business units which absorbed 95,236 workers and produced the output valued at
IDR 9.35 billion (www.regionalinvestment.bkpm.go.id//)
The importance of the roles of TPT to the economy of Central Java is also seen
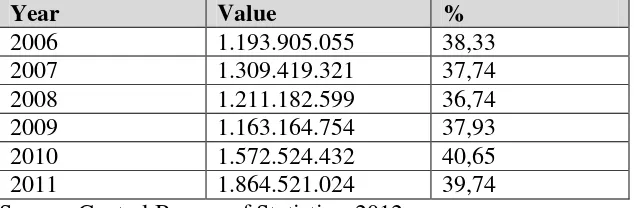
in this industry's contribution to the total exports of Central Java, as shown in Table 1
below. The contribution of this sector was the biggest compared to other sectors.
Based on table 1, the export contribution of textile industries in Central Java was
40.65% in 2010 and decreased to 39.74% in 2011.
Table 1. The Export Value and Percentage of Textile and Textile Product Industries in Central Java in 2006-2011 (US$)
Year Value %
2006 1.193.905.055 38,33
2007 1.309.419.321 37,74
2008 1.211.182.599 36,74
2009 1.163.164.754 37,93
2010 1.572.524.432 40,65
2011 1.864.521.024 39,74
In the development of recent years, TPT exports grew more slowly than the
main competitor countries such as China. The above shows that the Indonesian TPT
industry in general and Central Java in particular should have high competitiveness in
order to compete with similar industries from competing countries like China. In
building a strong textile industry and has high competitiveness, many challenges or
problems must be faced. These problems include: old machineries of domestic textile
industries, labor problems, high cost of energy, dependence on imported raw
materials, the rise of legal and illegal imports, and others.
Two basic things as the causes of low competitiveness are relatively low
efficiency and high cost economy. In addition to these reasons, the competitiveness of
Indonesian industrial products is still low because the quality and quantity and the
continuity of supply of industrial products, mostly, have not qualified the world trade.
It is, therefore, important to conduct research related to the efficiency of TPT
industries in Central Java in order to have high competitiveness in the world market.
The aim of this research was to analyze the efficiency of the textile and textile
products (TPT) industries in Central Java in 2010-2011.
LITERATURE REVIEW
Efficiency is one of performance parameters which theoretically is one of the
underlying performance of the overall performance of an organization. The ability to
generate maximum output with existing input is an expected measure of performance.
At the time of efficiency measurement, industries are faced with the challenges of
how to get the optimum output level with the existing input levels, or to get the
minimum input level with the given level of output. In addition, the separation
between the unit and the price can identify the level of technological efficiency,
allocation efficiency, and total efficiency. With the identification of input and output
allocation, it can be analyzed further to see the causes of inefficiencies (Hadad, et al,
According to Farrell (1957) in Rusydiana (2013), the efficiency of a company
consists of two components; technical efficiency and allocative efficiency. Technical
efficiency reflects the ability of a company to generate output with the available
number of inputs, while allocative efficiency reflects the ability of a company to
optimize the use of inputs, the pricing structure and production technology. The two
measures are then combined into economic efficiency. A company can be said to be
economically efficient if the company is able to minimize the production cost to
produce a given output with a level of technology commonly used as well as the
prevailing market price.
According to Kumbhaker and Lovell (2000) in Rusydiana (2013), technical
efficiency is only one component of overall economic efficiencies. However, in order
to achieve economic efficiency, a company must be technically efficient. In order to
achieve the maximum level of profits, a company must produce maximum output
with a certain number of inputs (technical efficiency) and produces output with the
right combination with a certain price level (allocative efficiency).
RESEARCH METHODOLOGY
Variables and Variable Operational Definition
The output variables in this research were the output value of textiles and textile
product industry. The input variables used were: the cost of raw and auxiliary
materials, expenditures for labor, purchased power, and fuel and lubricants expenses.
Data Sources
This research entirely used the secondary data of textiles and textile product
industries obtained from the Statistics of Large and Medium Industries in Central
Java, Volume I, II and III from 2010 to 2011, from the Central Statistics Agency
(BPS) of Central Java Province. The data used was based on the classification of the
International Standard Industrial Classification of All Economic Activities (ISIC),
Standard Industrial Classification (KBLI). The groups of textile and textile product
industries used were Indonesian Standard Industrial Classification (KBLI) of four
digits.
hj = the efficiency value of TPT industries in Central Java j
r = output
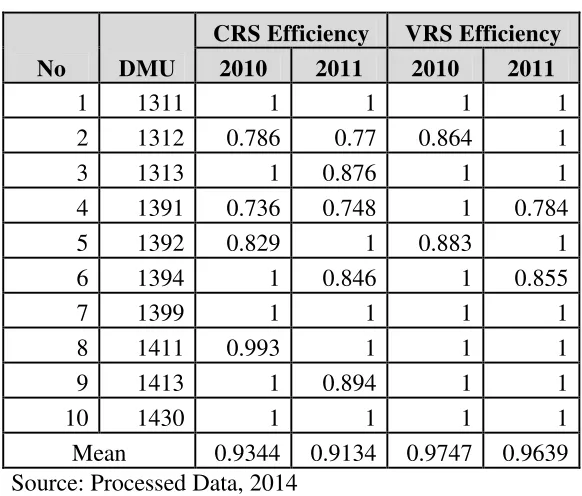
The calculation efficiency used Banxia Frontier Analyst. The results of
efficiency calculation using the method of Data Envelopment Analysis (DEA) are
Table 2. the Efficiency Value of TPT Industries in Central Java Using DEA Calculation
No DMU
CRS Efficiency VRS Efficiency 2010 2011 2010 2011
1 1311 1 1 1 1
2 1312 0.786 0.77 0.864 1
3 1313 1 0.876 1 1
4 1391 0.736 0.748 1 0.784
5 1392 0.829 1 0.883 1
6 1394 1 0.846 1 0.855
7 1399 1 1 1 1
8 1411 0.993 1 1 1
9 1413 1 0.894 1 1
10 1430 1 1 1 1
Mean 0.9344 0.9134 0.9747 0.9639
Source: Processed Data, 2014
Based on table 2, in 2010, more than 60% of the textile industries in Central
Java could produce the outputs with a number of existing inputs. Of 10 KBLIs of
TPT industries in Central Java, six KBLIs worked efficiently based on the
measurement of CRS and eight KBLIs worked efficiently based on the measurement
of VRS in 2010.
In 2010, the calculation of efficiency based on the assumption of CRS model
shows that there were six or approximately 60% of TPT industries with the efficiency
of 100%, which means, they were efficient in technical and scale. Six of the textile
industries were manufacturing industries and spinning of textile fibers (KBLI 1311),
the industry of textile final finishing (KBLI 1313), the industry of rope and goods of
rope (KBLI 1394), other textile industries of YTDL (KBLI 1399), the clothing
industry with the main material made of textile (KBLI 1413) and the industry of
knitted and embroidery / border apparel. In other hand, four or approximately the
inefficient in technical and scale. The four inefficient TPT industries were textile
weaving industry (KBLI 1312), the industry of knitted and embroideries fabrics
(KBLI 1391), textile product industry, not apparel (KBLI 1392) and apparel industry
(instead of suturing and manufacture of clothing) (KBLI 1411).
In 2010, the calculation of efficiency based on the assumption of VRS model
shows that there were eight or about 80% of TPT industries with the efficiency of
100%, which means that they were efficient in technical and scale. Eight of the TPT
industries were the industry of manufacturing and spinning of textile fibers (KBLI
1311), the industry of textile final finishing (KBLI 1313), the industry of rope and
products made of rope (KBLI 1394), the other textile industry of YTDL (KBLI
1399), the industry of clothing accessories mainly made of textile (KBLI 1413) and
the industry of knitted apparel and embroidery / border (KLBI 1430), the industry of
knitted fabrics and embroidery (KBLI 1391) and the apparel industry (instead of
tailoring and manufacture of clothing (KBLI 1411). Meanwhile, two or about the
other 20% were inefficient because their value was less than 100%, which means that
they were inefficient technically. The two inefficient TPT industries were the textile
weaving industry (KBLI 1312), the industry of manufacturing textile products, not
apparel (KBLI 1392).
In 2011, more than 50% of TPT industries in Central Java could produce the
outputs with a number of existing inputs. Of the 10 KBLIs of TPT industries in
Central Java, five KBLIs worked efficiently based on the measurement of CRS and
five KBLIs worked efficiently based on the measurement of the VRS in 2011.
In 2011, the calculation of efficiency based on the assumption of CRS model
shows that there were five or approximately 50% of TPT industries with the
efficiency of 100%, which means that they were efficient in technical and scale. Five
of the TPT industries were the other textile industry of YTDL (KLBI 1399), the
industry of knitted and embroidery/ border apparel (KLBI 1430), the industry of
tailoring and by order (KLBI 1412), the industry of textile product manufacture, not
processing and spinning of textile fibers (KLBI 1311). Meanwhile, five or about 50%
were inefficient because their efficiency value was less than 100%, which means;
they were inefficient in technical and scale. The five inefficient textile industries were
the industry of clothing accessories mainly made of textile (KLBI 1413), the industry
of textile final finishing (KLBI 1313), the industry of rope and products made of rope
(KLBI 1394), the textile weaving industry (KLBI 1312) and the industry of knitted
and embroideries fabrics (KLBI 1391)
In 2011, the calculation of efficiency based on the assumption of VRS model
shows that there were eight or about 80% of TPT industries with the efficiency of
100%, which means that they were efficient in technical and scale. Eight of the TPT
industries were the other textile industry of YTDL (KLBI 1399), the industry of
knitted and embroidery/ border apparel (KLBI 1430), the industry of tailoring and by
order (KLBI 1412), the industry of textile product manufacture, not apparel (KLBI
1392), the industry of apparel (KLBI 1411) and the industry of processing and
spinning of textile fibers (KLBI 1311), and the textile weaving industry (KBLI 1312).
Meanwhile, two or about the other 20% were inefficient because their efficiency
value was less than 100%, which means; they were inefficient technically. The two
inefficient TPT industries were the industry of rope and products made of rope (KLBI
1394) and the industry of knitted and embroideries fabrics (KLBI 1391)
CONCLUSION AND SUGGESTION Conclusion:
1. In 2010, more than 60% of TPT industries in Central Java could produce the
outputs with a number of existing inputs. Of 10 KBLIs of TPT industries in
Central Java, six KBLIs worked efficiently based on the measurement of CRS
and eight KBLIs worked efficiently based on the measurement of VRS in 2010.
2. In 2011, more than 50% of TPT industries in Central Java could produce the
Central Java, five KBLIs worked efficiently based on the measurement of CRS
and five KBLIs worked efficiently based on the measurement of VRS in 2011.
Suggestion:
1. The TPT industries in Central Java should be able to minimize inefficiencies in
the use of their inputs to be efficient.
REFERENCES
Ali, Jabir, Singh, Surendra P and Ekanem, Enefiok, 2009. Efficiency and Productivity Changes in The Indian Food Processing Industry: Determinants and Policy Implications. International Food and Agribusiness Management Review. Vol.12. Issue 1
Alvarez R and Crespi G. 2003. Determinant of Technical Efficiency in Small Firms, Small Business Economics, Netherlands, No.20, p 233-244
Alviya, Iis , 2011. Efisiensi dan Produktivitas Industri Kayu Olahan Indonesia Periode 2004-2007 Dengan Pendekatan Non Parametrik Data Envelopment Analysis. Jurnal Penelitian Sosial Ekonomi Kehutanan
Atmanti, Hastarini, 2004. Analisis Efisiensi Dan Keunggulan Kompetitif Sektor Industri Manufaktur Di Jawa Tengah Sebelum Dan Selama Krisis. Jurnal Dinamika Pembangunan. Vol. 1. No.1/Juli.
Badan Pusat Statistik. 2012. Statistik Industri Besar Dan Sedang. Semarang.
_________________. 2012. Jawa Tengah Dalam Angka. Semarang
Denizer, A. Cevdet and Dinc Mustafa. 2000. Measurung Banking Efficiency in the pre and Post Liberalization Environment: Evidence from the Turkish Banking System. Policy Research Working Paper Series 2476. The World Bank
Hadad, Muliaman D, dkk. 2003. Pendekatan Parametrik Untuk Efisiensi Perbankan Indonesia. Working Paper. www.bi.go.id//
Jajri, Idris and Ismail, Rahmah, 2006. Technical Efficiency, Technological Change and Total Factor Productivit Growth in Malaysian Manufacturing Sector. Munich Personal REPEC Archive No. 1956, posted 28 February 2007.
http://mpra.ub.uni-muenchen.de/1956//
Kuncoro, Mudrajad, 2007. Ekonomika Industri Indonesia: Menuju Negara Baru Industri Baru 2013?. Andi, Yogyakarta
_________________. 2009. Ekonomika Indonesia: Dinamika Lingkungan Bisnis di Tengah Krisis Global. UPP STIM KPN. Yogyakarta
Rahbar, Farhad and Memarian, Reza. 2010. Productivity Changes of Food
Processing Industries in Provinces of Iran; 1992-2001 a Non Parametric Malmquist Approach. Iranian Economic Review. Vol.15. No.26
Ray, Subhash C and Neogi Chiranjib, 2007. A Non-Radial Measure of Efficiency in Indian Textile Industry. Working Paper 2007-38. http://repec.org//
Ray, Sarbapriya and Ray, Ishita Aditya. 2012. Malmquist Indices of Productivity
Change in India’s Chemical Industry: a Subsector-level Analysis”.
International Journal Economic Policy in Emerging Economies. Vol.5. No.1
Rejekiningsih, Tri Wahyu. 2011. Analisis Produktiwtas Dan Efisiensi Industri Di Propinsi Jawa Tengah. Media Ekonomi Dan Manajemen. Vol 24. No 2 Juli
Rusydiana, Aam Slamet. 2013. Mengukur Tingkat Efisiensi dengan Data Envelopment Analysis (DEA): Teori dan Aplikasi. SMART Publishing. Bogor
Soekartawi .2003. Teori Ekonomi Produksi, dengan pokok bahasan analisis Fungsi Cobb-Douglas. Rajawali Pers. Jakarta
Sudantoko, Djoko. 2010. Model Pemberdayaan Industri Batik Skala Kecil di Jawa Tengah (Studi Kasus di Pekalongan). Disertasi. Program Pascasarjana Universitas Diponegoro Semarang (Tidak dipublikasikan)
Susantun, Indah. 2000. Fungsi Keuntungan Cobb Douglas Dalam Pendugaan Efisiensi Ekonomi Relatif, Jurnal Ekonomi Pembangunan, Vol.5 no.2.