GRID-CONNECTED QUASI-Z-SOURCE
PHOTOVOLTAIC INVERTER WITH
ENERGY STORAGE
ZULHANI BIN RASIN
A thesis submitted to
The University of New South Wales
for the degree of Doctor of Philosophy
School of Electrical Engineering and Telecommunications
ii ORIGINALITY STATEMENT
‘I hereby declare that this submission is my own work and to the best of my knowledge it contains no materials previously published or written by another person, or substantial proportions of material which have been accepted for the award of any other degree or diploma at UNSW or any other educational institution, except where due acknowledgement is made in the thesis. Any contribution made to the research by others, with whom I have worked at UNSW or elsewhere, is explicitly acknowledged in the thesis. I also declare that the intellectual content of this thesis is the product of my own work, except to the extent that assistance from others in the project's design and conception or in style, presentation and linguistic expression is acknowledged.’
Signed ………
iii
Abstract
In a small to medium scale PV inverter system, energy storage functionality such as battery is significant to ensure the energy is efficiently stored, used and delivered to the load. As for the grid-connected system, having a bidirectional power flow in the system is an advantage in case the power from the PV array is insufficient to satisfy the demand from the load. The grid power can also be used to charge the battery storage in case the energy stored is at the critical level and cannot be recovered immediately due to low/zero level of sun irradiation.
In relation to this, the quasi-Z-source inverter (qZSI) topology, apart from offering a single stage DC-DC-AC conversion, offers a flexible way on how the battery storage can be introduced to the system. In this thesis a new method of connection and control method for battery storage is proposed which can be connected to the system easily with minimal modification with main advantage of controlled current for the charging and discharging operation. Apart from this, bidirectional power control between the PV source, battery storage, load and the grid is also investigated.
iv
v
Table of Contents
ORIGINALITY STATEMENT ... ii
Abstract ... iii
Table of Contents ... v
List of Figures... viii
List of Tables ... xvii
List of Symbols ... xviii
Acknowledgements ... xxi
Chapter 1 Introduction ... 1
1.1 Research motivations ... 4
1.2 Research objectives ... 6
1.3 Thesis main contributions... 6
1.4 Thesis outline ... 7
Chapter 2 Background study and literature review ... 9
2.1 Topologies in PV inverter system ... 11
2.2 Z-Source Inverter ... 15
2.3 Quasi-Z-Source Inverter ... 17
2.4 Quasi-Z-Source Inverter in grid-connected PV inverter system ... 17
2.5 Energy storage and power flow management in PV inverter system ... 21
2.6 Energy storage and power flow management in grid-connected qZSI PV inverter system ... 28
2.7 Summary ... 32
Chapter 3 Modelling and System Design ... 35
3.1 PV source emulator ... 37
3.2 Quasi-Z-source network ... 39
3.2.1 Analysis of the qZSI operation ... 40
3.2.2 Small signal model of qZSI network ... 42
3.3 Three phase DC-AC inverter ... 45
3.3.1 Space Vector Pulse Width Modulation (SVPWM) ... 46
3.3.2 Modified Carrier based SVPWM for qZSI ... 48
vi
3.4.1 Charging/discharging model analysis ... 53
3.4.2 Modelling of battery ... 57
3.5 Grid synchronization... 59
3.6 Voltage and current control ... 60
3.6.1 Output voltage control in standalone mode ... 63
3.6.2 Voltage and current control in grid-connected mode ... 66
3.7 Parameters design of grid-connected qZSI PV inverter system ... 70
3.8 Strategy for bidirectional power flow management ... 73
3.9 Summary ... 76
Chapter 4 Simulation Studies ... 79
4.1 Simulation at 5 kW ... 81
4.1.1 MPPT operation of qZSI PV inverter ... 81
4.1.2 Voltage and current control of the inverter ... 83
4.1.3 Grid synchronization ... 84
4.1.4 Operation of the battery storage unit ... 86
4.1.5 Case studies on realization of bidirectional power flow control between PV source, battery storage, load and the grid ... 89
4.1.5.1 Case 1 ... 89
4.1.5.2 Case 2 ... 92
4.1.5.3 Case 3 ... 95
4.1.5.4 Case 4 ... 97
4.2 Simulation at 0.5 kW ... 100
4.2.1 MPPT operation of qZSI PV inverter ... 100
4.2.2 Voltage and current control of the inverter ... 102
4.2.3 Grid synchronization ... 102
4.2.4 Operation of the battery storage unit ... 104
4.2.5 Case studies on realization of bidirectional power flow control between PV source, battery storage, load and the grid ... 106
4.3 Summary ... 106
Chapter 5 Prototype Development & Experiment Setup ... 107
5.1 Issues and limitation ... 107
5.2 PV emulator ... 109
5.3 Battery storage unit ... 111
vii
5.5 Digital processing platform ... 114
5.6 Summary ... 116
Chapter 6 Experimental Studies ... 117
6.1 Verifying the operation of the PV inverter system ... 117
6.1.1 MPPT operation of qZSI PV Inverter ... 117
6.1.2 Inverter voltage and current control, and grid synchronization ... 120
6.1.3 Operation of battery charging and discharging ... 127
6.2 Bidirectional active and reactive power control between PV emulator, battery, load and grid ... 129
6.2.1 Case 1 ... 129
6.2.2 Case 2 ... 134
6.2.3 Case 3 ... 137
6.2.5 Case 4 ... 141
6.3 Summary ... 144
Chapter 7 Conclusion and Future Work ... 147
7.1 Conclusion ... 147
7.2 Future work ... 149
REFERENCES ... 151
APPENDIX A C CODE FOR Dspace1104 CONTROLLER ... 159
APPENDIX B SCHEMATIC DIAGRAMS ... 170
APPENDIX C MATLAB SIMULINK SIMULATION PLATFORM ... 174
viii
List of Figures
Figure 1-1 Accumulated installed PV capacity for 1992-2013 [1]. ... 1
Figure 1-2 Conventional grid-connected PV inverter system. ... 2
Figure 2-1 Power conversion stage (a) with transformer and (b) transformerless with DC-DC converter in grid connected PV system. ... 9
Figure 2-2 Cascaded DC-DC converter with (a) single string and (b) multi strings connection in PV inverter system. ... 11
Figure 2-3 Interleaved DC-DC boost converter for PV inverter system. ... 12
Figure 2-4 Cascaded H-bridge multilevel converter in PV inverter system. ... 12
Figure 2-5 High frequency AC-DC converter. ... 13
Figure 2-6 Topology of Z-source inverter. ... 15
Figure 2-7 Several new topologies developed based on the ZSI; (a) diode assisted boost qZSI (b) switch inductor Z-source inverter (c) Trans-Z-source inverter and (d) Z-H Inverter. ... 16
Figure 2-8 Quasi Z-Source inverter for PV inverter system. ... 17
Figure 2-9 Two stage control method for both (a) voltage output control mode and (b) grid-connected mode for qZSI PV inverter system [42]. ... 19
Figure 2-10 MPPT, voltage and current control in grid-connected single phase qZSI PV system [45]. ... 21
Figure 2-11 Battery connected without charge controller (a) with battery directly connected to PV terminal and (b) with DC-DC converter before the battery in low power standalone PV system. ... 22
Figure 2-12 Battery storage based on bidirectional DC-DC converter. ... 23
Figure 2-13 The use of bidirectional DC-DC converter to realize MPPT in [49]. .. 24
Figure 2-14 Dual inverter based energy storage system for grid-connected PV inverter system [54]. ... 25
Figure 2-15 Two stage inverter for battery energy storage system [55]... 25
Figure 2-16 Hybrid PV/Battery bidirectional converter [56]. ... 26
ix
Figure 2-18 Double loop voltage and current control applied for grid-connected
PV inverter system. ... 27
Figure 2-19 Option 1 : battery connection for the case of qZSI PV inverter system. ... 29
Figure 2-20 Option 2 : battery connection for the case of qZSI PV inverter system. ... 30
Figure 2-21 Control strategy of bidirectional quasi-Z-source inverter. ... 32
Figure 3-1 Overall block diagram of grid-connected qZSI PV inverter system. ... 36
Figure 3-2 DC-DC buck converter based PV emulator. ... 37
Figure 3-3 Equivalent circuit for a PV cell. ... 38
Figure 3-4 Specifications and I-V curve characteristics of MSX 120 from BP Solar [74]. ... 39
Figure 3-5 Equivalent circuit of qZSI during (a) shoot-through and (b) non-shoot-through. ... 40
Figure 3-6 (a) Model of grid-connected qZSI (b) during shoot-through operation and (c) during non-shoot-through operation). ... 42
Figure 3-7 Small signal model of quasi Z-source network. ... 44
Figure 3-8 Basic circuit of 3-phase inverter. ... 45
Figure 3-9 (a) Switching states of inverter using SVPWM (b) abc to stationary dq transformation. ... 48
Figure 3-10 Switching states execution with carrier based SVPWM. ... 52
Figure 3-11 (a) Switching states execution with conventional carrier based SVPWM and (b) shoot-through insertion method in modified carrier based SVPWM. ... 52
Figure 3-12 qZSI with bidirectional battery storage unit. ... 53
Figure 3-13 Equivalent circuit of bidirectional DC-DC converter during (a) charging and (b) discharging. ... 54
Figure 3-14 (a) Open loop and (b) closed loop of bode plot frequency response analysis of the battery current control. ... 57
Figure 3-15 Model for battery as presented by Matlab®Simulink software. ... 58
x
Figure 3-17 Configuration of PLL. ... 60
Figure 3-18 AC side of qZSI inverter. ... 61
Figure 3-19 (a) Voltage control and (b) current control of the AC side. ... 62
Figure 3-20 Block diagram of inverter output voltage control in standalone mode. ... 65
Figure 3-21 Open loop bode plot frequency response analysis for capacitor voltage control during standalone mode. ... 65
Figure 3-22 Block diagram of capacitor voltage and inverter output current control in grid-connected mode. ... 66
Figure 3-23 Flowchart of P&O algorithm used to control the shoot-through duty ratio d... 67
Figure 3-24 Block diagram of inner loop current control. ... 68
Figure 3-25 Open loon bode plot frequency response analysis for inner loop current control during grid-connected mode. ... 68
Figure 3-26 Open loop bode plot frequency response analysis for outer loop capacitor voltage control during grid-connected mode. ... 69
Figure 3-27 Step response analysis of the outer loop voltage control. ... 69
Figure 3-28 Step response of the inner loop current control. ... 70
Figure 3-29 Flowchart of power flow management. ... 74
Figure 3-30 Graphical view of power flow management in each operation mode 1 – 6. ... 75
Figure 3-31 Current control for battery charging/discharging. ... 76
Figure 4-1 I-V curve data at 5 kW configuration based on BP Solar MSX-120 PV panel at 25ºC. ... 81
Figure 4-2 The given insolation level (top) and the changes in the voltage across emulator Vpv (bottom)... 82
Figure 4-3 The output current of the emulator Ipv and the corresponds output power Ppv. ... 82
Figure 4-4 Voltage across VC1 (top) and the voltage produced across the inverter switches Vdc. ... 83
xi
Figure 4-6 The power fed by the emulator Ppv (top) and the control of capacitor voltage VC1 (bottom)... 84 Figure 4-7 The current control of the inverter (top) and the correspond 3-phase
inverter output current (bottom). ... 84 Figure 4-8 3-phase grid voltage Vgrid (top) and the angle θ produced for
synchronization. ... 85 Figure 4-9 The sinusoidal control signal produced (top) and the corresponds
SVPWM reference signal (bottom). ... 85 Figure 4-10 Insertion of shoot-through operation during zero vector in each
cycle... 86 Figure 4-11 Active inverter output phase current of the inverter in-phase with
the grid voltage. ... 86 Figure 4-12 Capacitor voltage VC1 (top) and the battery voltage Vbat (bottom)
during charging operation. ... 87 Figure 4-13 Controlled battery charging current Ibat (top) and power charged
into the battery Pbat (bottom). ... 87 Figure 4-14 Capacitor voltage VC1 (top) and the battery voltage Vbat (bottom)
during discharge operation. ... 88 Figure 4-15 Controlled battery discharge current Ibat (top) and power
discharged from the battery Pbat (bottom). ... 88 Figure 4-16 Power flow control in case 1. ... 89 Figure 4-17 Case 1 : Power produced by the PV emulator Ppv (top), consumed
by the load Pload (mid) and discharged by the batteries Pbat
(bottom). ... 90 Figure 4-18 Case 1 : Capacitor voltage VC1 controlled at 680 V (top) and
current control operation (bottom). ... 90 Figure 4-19 Case 1 : Current discharged by the batteries Ibat (top), inverter
output current Iinv (2nd), load current I
load(3rd) and current at the
grid connection Igrid (bottom). ... 91 Figure 4-20 Case 1 : Phase relation between currents Iinv and Igrid with Vgrid
during reactive (left) and active (right) power control. ... 92 Figure 4-21 Power flow control in case 2. ... 92 Figure 4-22 Case 2 : Power produced by the PV emulator Ppv (top), consumed
by the load Pload (mid) and discharged by the batteries Pbat
xii
Figure 4-23 Case 2 : Capacitor voltage VC1 controlled at 680 V (top) and
current control operation (bottom). ... 94 Figure 4-24 Case 2 : Current discharged by the batteries Ibat (top), inverter
output current Iinv (bottom). ... 94 Figure 4-25 Case 2 : Current consumed at the load Iload (top) and current at the
grid connection Igrid (bottom). ... 95 Figure 4-26 Power flow control in case 3. ... 95 Figure 4-27 Case 3 : Power produced by the PV emulator Ppv (top), consumed
by the load Pload (mid) and recharged to the batteries Pbat
(bottom). ... 96 Figure 4-28 Case 3 : Capacitor voltage VC1 controlled at 680 V (top) and
current control operation (bottom). ... 96 Figure 4-29 Case 3 : Current recharged to the batteries Ibat (top), inverter output
current Iinv (2nd), load current Iload(3rd) and current at the grid
connection Igrid (bottom). ... 97 Figure 4-30 Power flow control in case 4. ... 97 Figure 4-31 Case 4 : Power produced by the PV emulator Ppv (top), consumed
by the load Pload (mid) and recharged to the batteries Pbat
(bottom). ... 98 Figure 4-32 Case 4 : Capacitor voltage VC1 controlled at 680 V (top) and
current control operation (bottom). ... 98 Figure 4-33 Case 4 : Output current from PV Ipv (top), current recharged to the
batteries Ibat (mid), and inverter output current Iinv (bottom). ... 99 Figure 4-34 Case 4 : Current consumed at the load Iload (top) and current at the
grid connection Igrid (bottom). ... 99 Figure 4-35 Case 4 : Phase relation between currents Iinv and Igrid with grid
voltage Vgrid during active (left) and reactive (right) power
control... 100 Figure 4-36 I-V curve data at 0.5 kW configuration based on BP Solar
MSX-120 PV panel at 25ºC. ... 100 Figure 4-37 The control of PV source terminal voltage Vpv (top) and the
corresponds output current Ipv(mid) and the produced power Ppv
(bottom). ... 101 Figure 4-38 The control of capacitor voltage Vc1 at 200V (top) and the
xiii
Figure 4-39 Active and reactive current control corresponds to the MPPT
verification in Figure 4-37. ... 102
Figure 4-40 3-phase grid voltage Vgrid (top) and the angle θ produced for synchronization (bottom). ... 103
Figure 4-41 The sinusoidal control signal produced (top) and the corresponds SVPWM reference signal (bottom). ... 103
Figure 4-42 Active grid phase current in-phase with the grid voltage. ... 103
Figure 4-43 Capacitor voltage control at 200 V (top) and battery voltage Vbat during charging operation (bottom). ... 104
Figure 4-44 Battery current Ibat controlled to reference current Ibat_ref(top) and power flowing into the battery Pbat during charging operation. ... 104
Figure 4-45 Capacitor voltage control at 200 V (top) and battery voltage Vbat during discharging operation (bottom). ... 105
Figure 4-46 Battery current Ibat controlled to reference current Ibat_ref(top) and power flowing out from the battery Pbat during discharging operation. ... 105
Figure 5-1 Overall experiment setup for the grid-connected qZSI PV inverter system with energy storage... 107
Figure 5-2 Experiment setup of DC-DC buck based PV emulator. ... 110
Figure 5-3 Experiment setup of battery storage unit. ... 111
Figure 5-4 Experiment setup of the qZSI inverter. ... 113
Figure 5-5 Experiment setup of ds1104 controller board. ... 115
xiv
Figure 6-5 Variation of inverter output phase current Iinv as insolation is increases and decreases (a) 0.2 to 0.6 kW/m2 (b) 0.6 to 1.0 kW/m2 (c) 1.0 to 0.6 kW/m2 and (d) 0.6 to 0.2 kW/m2. ... 120 Figure 6-6 Voltage across emulator output during standalone mode at 141V. ... 121 Figure 6-7 Voltage across inverter switches Vdc, voltage VD1 and current ID1 of
diode D1 at standalone mode. ... 121 Figure 6-8 Voltage across inverter switches Vdc, voltage (VL1 & VL2) and
current (IL1 & IL2) of inductor L1 & L2 at standalone mode. ... 122 Figure 6-9 Voltage of capacitor C1 (VC1) and C2 (VC2) at standalone mode. ... 122 Figure 6-10 Inverter output phase voltage and current in stand alone mode. ... 123 Figure 6-11 Capacitor voltage and inverter output current control when power
from PV emulator is gradually increased from 300W to 500W in grid-connected mode. ... 124 Figure 6-12 Capacitor voltage and inverter output current control when power
from PV emulator is gradually decreased from 500W to 300W in grid-connected mode. ... 125 Figure 6-13 The line-to-line voltage Vl-lof the gridmeasured by sensor at
103.92Vpk and the produced phase voltage Vphase at60 Vpk. ... 126
Figure 6-14 The theta θ produced by PLL (top), the produced 3-phase
sinusoidal control signal (mid) and the SVPWM reference signal (bottom). ... 126 Figure 6-15 Grid phase voltage (25V/div) at 60 Vpk and current (2A/div) during
grid-connected mode. ... 127 Figure 6-16 VC1 voltage control (top), battery output current Ibat (middle) and
power Pbat flowing to the inverter (bottom) during battery
discharge operation at various current level... 128 Figure 6-17 VC1 voltage control (top), battery input current Ibat (middle) and
power Pbat drawn from the inverter (bottom) during battery
recharge operation at various current level. ... 128 Figure 6-18 Power flow control in case 1. ... 129 Figure 6-19 Case 1 : Results from simulation (top) and experiment (bottom) for
power Ppv produced by the PV source. ... 130 Figure 6-20 Case 1 : Results from simulation (left) and experiment (right) for
xv
Figure 6-21 Case 1 : Results from (a) simulation and (b) experiment for control of active current component Isd and reactive current component Isq
of the inverter output current during stage of drawing power from grid... 131 Figure 6-22 Case 1 : Results from simulation (left) and experiment (right) for
out-phase grid phase voltage and current at power factor 0.89 during stage of drawing current from the grid. Current values at simulation result are 10 times magnified. ... 131 Figure 6-23 Case 1 : Results from (a) simulation and (b) experiment for battery
discharge operation with power difference between Ppv and Pload
(top), output current of battery Ibat (middle) and power produced by the discharged battery Pbat(bottom). ... 132 Figure 6-24 Case 1 : Experiment result of capacitor voltage control (top) and
the control of active current component Isd and reactive current component Isq (bottom) of inverter output current when battery is discharging. ... 133 Figure 6-25 Case 1 : Results from the simulation (left) and experiment (right)
for grid phase voltage and inverter output phase current when Ppv
at 70W, Pload at 219W and battery discharged at 150W. Current values at simulation result are 10 times magnified. ... 133 Figure 6-26 Power flow control in case 2. ... 134 Figure 6-27 Case 2 : Results from simulation (top) and experiment (bottom) for
power delivered by the PV source between 80 – 90 W... 134 Figure 6-28 Case 2 : Results from simulation (left) and experiment (right) for
current across the load varied at 90 W, 219 W and 136 W. ... 135 Figure 6-29 Case 2 : Results from simulation (top) and experiment (bottom)
capacitor voltage VC1 control at 200 V. ... 135 Figure 6-30 Case 2 : Results from (a) simulation and (b) experiment for battery
discharge operation with power difference between Ppv and Pload
(top), output current of battery Ibat (middle) and power produced by the discharged battery Pbat(bottom). ... 136 Figure 6-31 Power flow control in case 3. ... 137 Figure 6-32 Case 3 : Results from experiment (top) and simulation (bottom) for
power delivered by the PV source to the inverter gradually
increasing from 350 W to 520 W. ... 138 Figure 6-33 Case 3 : Results from (a) experiment and (b) simulation for
regulation of capacitor voltage VC1 controlled at 200V and
xvi
Figure 6-34 Case 3 : Results from (a) experiment and (b) simulation for operation of recharging the battery; input current into the battery
Ibat from 0.2 to 1.5 A (top) and the produced power flowing into
the battery Pbat from 15 to 112 W (bottom). ... 139
Figure 6-35 Case 3 : Results from (a) experiment and (b) simulation for current flowing to the grid Igrid, output current of the inverter Iinv and constant current at the load Iload. ... 140
Figure 6-36 Power flow control in case 4. ... 141
Figure 6-37 Case 4 : Results from experiment (top) and simulation (bottom) for PV power Ppv gradually decreasing from 304 W to 142 W. ... 141
Figure 6-38 Case 4 : Results from experiment (top) and simulation (bottom) for battery constantly recharged at 75 W. ... 142
Figure 6-39 Case 4 : Results from experiment (left) and simulation (right) for load current Iload at power level of 136 W and 219 W. ... 142
Figure 6-40 Case 4 : Results from (a) experiment and (b) simulation for active and reactive current control at the inverter. ... 143
Figure 6-41 Case 4 : Results from (a) experiment and (b) simulation for comparison of grid voltage and inverter output current phase during active (left) and reactive (right) current control at the inverter. Current values are 10 times magnified. ... 144
Figure B1-1 Gate driver circuitries based on VLA502 module [87]. ... 171
Figure B1-2 Structure inside the VLA502 module [87]. ... 171
Figure B2- 1 Circuit diagram for voltage sensor. ... 172
Figure B2- 2 Circuit diagram for current sensor. ... 172
Figure B3- 1 Optocoupler circuit to the inverter (part 1). ... 173
Figure B3- 2 Optocoupler circuit to the inverter (part 2). ... 173
Figure C- 1 Matlab Simulink simulation platform – main circuit. ... 174
Figure C- 2 Matlab Simulink simulation platform – (a) PV emulator (b) PLL and (c) battery storage unit. ... 175
xvii
List of Tables
Table 2-1 Operating condition in PV inverter system with energy storage in
grid-connected mode. ... 28 Table 2-2 Operating condition in PV inverter system with energy storage in
standalone mode. ... 28 Table 3-1 Definition of parameters for PV voltage and current. ... 38 Table 3-2 Switching vectors for SVPWM ... 47 Table 3-3 Parameters values for bidirectional DC-DC converter inductor
current control analysis. ... 57 Table 3-4 Definition of parameters for equations (3-36) to (3-37). ... 58 Table 3-5 Parameters values for capacitor voltage control analysis during
standalone mode. ... 65 Table 3-6 Parameters values for capacitor voltage and current control analysis
during grid-connected mode. ... 69 Table 3-7 Relation between modulation index M and shoot-through duty ratio
d based on different boost control method. ... 72 Table 3-8 Summary of relation between capacitor voltage and output peak
phase voltage. ... 73 Table 3-9 Summary of operations during various mode in grid-connected and
standalone mode. ... 74 Table 4-1 Parameters/specification of simulation setup for grid-connected PV
based qZSI with energy storage... 80 Table 5-1 Parameters/specification of experiment setup for grid-connected PV
based qZSI with energy storage... 109 Table 6-1 Summary of power distribution based on changes in Ppv for case 3
xviii
List of Symbols
v instantaneous voltage, V
i instantaneous current, A
V magnitude of AC voltage, or average DC voltage, V
I magnitude of AC current, or average DC current, A
P power, W
d shoot-through duty ratio in ZSI/qZSI inverter
D PWM duty cycle in DC-DC converter
Ppv power from the PV source, W
Pload power consumed at the load, W
Pbat charged/discharged power at the battery, W
λ insolation value, W/m2
θ value of angle, degree
ω angular frequency, radian
Ns Number of PV cell is series
Np Number of PV cell in parallel
P active power, W
Q reactive power, var
T temperature, °C
d, q d and q component of Park’s transformation
Ts switching time or sampling time
T0 shoot-through time
M modulation index
Superscripts
* reference or required value
^ maximum or peak value
xix Subscripts
in input values
o output values
a, b, c phase of the inverter
ab, bc, ca line-to-line output voltage
ref reference value
bat value of voltage or current at the battery
g value of voltage or current at the grid
pv value of voltage or current at the PV source
C value of voltage or current at the capacitor
L value of voltage or current at the inductor
mpp value of maximum power point of valotage or current at the PV source
min, mid, max minimum, middle and maximum value of voltage or current
- negative magnitude of the value
pk peak value of voltage or current
Abbreviations
AC alternate current
ADC analog to digital converter DAC digital to analog converter
DC direct current
DCM discontinuous conduction mode DSP digital signal processing
IEEE Institute of Electrical & Electronics Engineers IGBT insulated gate bipolar transistor
I/O input/output
L-C Inductor – Capacitor
MOSFET metal-oxide semiconductor field-effect transistor MPPT maximum power point tracking
xx
PLL phase-locked loop
PV photovoltaic
PWM pulse width modulation qZSI quasi-Z-source inverter
SoC state of charge
SPWM sinusoidal pulse width modulation SVPWM space vector pulse width modulation VSI voltage source inverter
xxi
Acknowledgements
Firstly, I would like to express my deepest appreciation to my supervisor Profesor Muhammed Fazlur Rahman, whose experience, generous guidance and understanding made it possible for me to finish my study.
A special thanks for Dr. Dan Xiao and all the other laboratory staffs, for the dedicated support given for the experiment setup. The same goes to the colleagues and friends in the Energy Systems Research Group for all the invaluable sharing of ideas and discussions.
I also gratefully acknowledge the Ministry of Education Malaysia and Universiti Teknikal Malaysia Melaka for the financial sponsorship given for the last four years.
1
Chapter 1
Introduction
As the world is increasingly aware of the potential of renewable energy to reduce the dependence on fossil fuels and to decrease the emission of climate changing greenhouse gases and other pollutants, photovoltaic (PV) distributed generation system has become very significant in the recent years. This is evidenced by the data shown in Figure 1-1 from the International Energy Agency (IEA) which shows that up to 2013 total accumulated capacity of installed PV reaches about 133 GWp among the reporting countries with 36 GWp alone for 2013 [1]. This must have been supported by the continuous research around the world on many aspects of solar PV conversion system, resulting in a cheaper system installation and better efficiency in the conversion system.
Cumulative Capacity – IEA PVPS Reporting Countries
Cumulative Capacity – Other Major Countries (Est.)
Evolution of Total Installed PV Capacity (MWp)
Figure 1-1 Accumulated installed PV capacity for 1992-2013 [1].
Chapter 1 Introduction
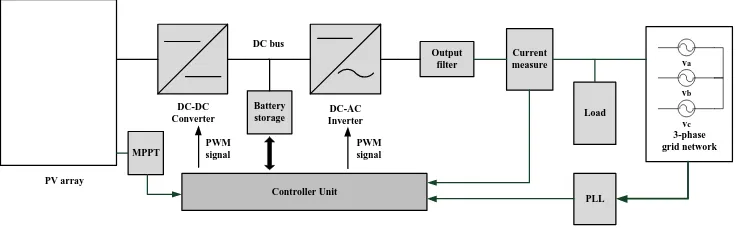
2
(AC) form and this is done by the DC-AC inverter. A DC bus exists between the two stages to ensure a balance of power transfer between the source and the loads including the energy storage if available, where the energy harvested from the source is kept temporarily before used.
Figure 1-2 Conventional grid-connected PV inverter system.
In grid-connected PV inverter system, the following criteria in its design and configuration are desired. Firstly, the system must be able to deliver power to the grid efficiently, where it refers to the ability of the system to ensure the amount of energy captured from the source is transformed to a usable form at its load at highest possible rate. This can be done through reduction in conversion stages, the use of a fewer number of components and the lower voltage and current stress on the components which relates to losses in the system. It is a fact that the longer and more stages the energy needs in order to get through to the load, the more it is prone to power losses, noise and distortion.
Chapter 1 Introduction
3
charging/discharging capability as well as power flow management within the inverter system. Not only power is supplied to the grid and load from the PV source or battery, but the grid can also be used to provide power back to the load or charging the battery when power from the PV source is limited or totally not available.
Lastly, it is important to make sure that the power delivered by the converter system complies with the utility grid connection standard, for example in term of its harmonic contents and the power factor. Among the standards available as a reference are the AS4447 Grid Connection of Energy Systems via Inverters and the IEEE 1547 Standard for Interconnecting Distributed Resources with Electric Power Systems.
This thesis focuses on two aspects from the above criteria; which are the energy storage and the ability to realize the bidirectional power flow management. Energy storage for PV inverter system traditionally is applied in the stand alone off-grid system considering the sunlight is only available during the day and energy storage system like the battery is used to temporarily store the extra energy from the solar PV to provide energy when there is no/low sunlight. As for the grid-connected system, especially for the residential consumer, battery storage is not really necessary considering the grid as a limitless battery bank that can provide electricity continuously apart from the costing reason the consumer need to invest.