UNIVERSITI TEKNIKAL MALAYSIA MELAKA
FACULTY OF ELECTRICAL ENGINEERING
FINAL YEAR PROJECT REPORT
EMG CLASSIFICATION BASED ON FEATURES REDUCTION USING FUZZY C-MEANS CLUSTERING TECHNIQUE
PREPARED BY:
NURUL ILLIYYANA EMIRA BT JUSOH
B011110146
BACHELOR OF ELECTRICAL ENGINEERING
i
“I hereby declare that I have read through this report entitle “EMG Classification Based On Features Reduction using Fuzzy C-Means Clustering Technique” and found that it has comply the partial fulfilment for awarding the degree of Bachelor of Electrical Engineering (Control, Instrumentation and Automation)”.
Signature :………
Supervisor Name :………
ii
I declare that this report entitle “EMG Classification Based On Features Reduction using Fuzzy C-Means Clustering Technique” is the result of my own research except as cited in the references. The report has not been accepted for any degree and is not concurrently submitted in candidature of any other degree.
Signature :………
Name :………
iii
EMG CLASSIFICATION BASED ON FEATURES REDUCTION USING FUZZY C-MEANS CLUSTERING TECHNIQUE
NURUL ILLIYYANA EMIRA BINTI JUSOH
A report submitted in partial fulfillment of the requirements for the degree of Bachelor of Electrical Engineering (Control, Instrumentation and Automation)
Faculty of Electrical Engineering
UNIVERSITI TEKNIKAL MALAYSIA MELAKA
iv
ACKNOWLEDGEMENT
In performing my research project, it is a successful one I had. The help and guideline of some respected person. First of all, I am grateful to Allah who gives me a good health to accomplish this final year project properly.
I would like to appreciate to my project’s supervisor lecturer, Mr Mohd Hafiz bin Jali. He is the person who guidance me in all the time to complete this project. He always gives me the motivation and also shares the knowledge about this research.
Moreover, I would like to express my sincere gratitude to my parents; family and my fiancé for always support me in completing my final year report. I could not have imagined, without their helps and support for completing this project.
Besides, I would like to thanks to my classmate because of their help and share ideas with me that can be included into this report. Without their helps, my research would have been possible for completing this project.
v
ABSTRACT
vi
ABSTRAK
vii
2.4 The Location of the Electrode
2.5 The Signal Features Extraction of Electromyography 2.6 Fuzzy C-Means Clustering Techniques
2.7 Review of Previous Related Works
2.8 Table of Summarize For Literature Review 2.9 Summary and Discussion of the Review
viii
3 METHODOLOGY 23
3.1 Experiment Protocol 23 3.2 Subject Criteria 23 3.3 Experimental Guideline 23-25 3.4 Data Acquisation Setup 25-26 3.5 The Procedure 26 3.5.1 The Electrode 26-27 3.5.2 Skin Preparation 28 3.5.3 The Placement of Electrode 28-29 3.5.4 Time Domain Features Extraction 29-30 3.5.5 Classification Method 31 3.6 Experimental Procedure
3.6.1 Flow Chart of Methodology
32
4.1 Analysis of Variance or ANOVA Test 4.2 EMG Classification Using FCM
4.3 The Analysis to Prove the FCM Can Reduce the Features That Can be classify the pattern
36-37 38-39 39-42
5 CONCLUSION AND RECOMMENDATION 43
5.1 Conclusion and Recommendation 43
REFERENCES 44-45
APPENDIX A 46
APPENDIX B 47-48
APPENDIX C 49
ix
The Criteria of The Subject
The Condition of the Skin Impedance
The Typical EMG Classification Accuracy Rate The Table of Summarise for Literature Review Gantt Chart
Summary of the Project Key Miles Stones ANOVA Table
The Data Features Extraction for Each Pattern
x
Disposable Ag/AgCl Electrodes And The Active Surface Electrode
The Location of The Electrode in 1cm
Signal Processing For Pattern Classification In Typical Application
The Forearm Muscle Sites at Which The EMG Sensors Were Positioned
Flow Chart of the Experiment Graph of ANOVA
1
CHAPTER 1
INTRODUCTION
This chapter will give a brief explanation about the project background, problem statement, objectives and the scopes of this thesis. Then, the objective was set to get the goal of this project. Lastly, project scopes will ensure the limitations will always be on the track.
1.1 Background
Research on EMG classification is essential in the field of medical research and human technology interaction. It required a strong foundation of the neuromuscular system, impact of the tools used during signal acquisition in order to collect meaningful data and signal processing technique. One of the commonly application related to this study is prosthetic device
2
doing the experiment [6]. Then, for the passive electrode [7], there have no built-in the amplifier and filter but this electrode has the electrode gel. While, the surface of non-invasive electrode is the surface just only to apply on the skin and not inserted to the skin. So, the signal show is less accurate compared to the signal when using the invasive electrode.
To detect the muscle activities, the traditional EMG uses a fine needle while the surface EMG is using the surface electrode [5]. The main point of the EMG is to optimise the signal to ratio of noise [10]. The noises that exist while performing the experiment the raw EMG signal Electromyography can be divided into two types which are ambient noise and transducer noise. The ambient noise is the noise that produces from the computers and power line [10]. The performance of signal classification in time domain features are chosen compared to frequency domain and time- frequency domain because low noise environments and their lower computational complexity [8]. The time domain also has the disadvantages that are the data will assumed in stationary state for the non-stationary properties of the electromyography (EMG) signal that the raw EMG signal not in time domain of the featured of the extraction [9] [11].
1.2 Problem Statement
There are several problems based on the Electromyography (EMG) classification based on features reduction using fuzzy c-means clustering technique. First of all, EMG classification is not an easy task due to the signal contains a lot of uncertainties that leads to a high dimensional feature vector because it controlled by the nervous system and depends on the movement of the upper limb muscle. Based on the result of the EMG signal is the important way to detect the condition of the nerves or muscle.
3
1.3 Objectives
The objectives as shown below:
i. To extract the time domain features from the EMG signal. ii. To perform the features reduction technique
iii. To classify the EMG signal based on different pattern using Fuzzy C-Means (FCM).
1.4 Scope of Research
The scopes of this research are:
i. Data acquisation device for Electromyography signal used is NI myRIO and muscle V3 as a preamplifier.
ii. LabVIEW myRIO toolkit is for data display and recorder
iii. The feature extracted signal using the time domain which are root mean square (RMS), mean absolute value (MAV), standard deviation (STD) and variance (VAR).
iv. The muscle that is concentrated on forearm muscle only.
v. The criteria of target subject are male or female that is used right hand as a dominant and without previous illness record.
vi. Investigate for the five different of pattern.
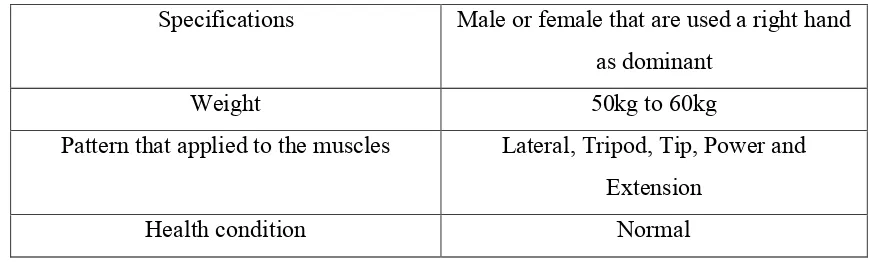
vii. There are 5 subjects based on criteria in Table 1.1:
Table 1.1: The Criteria of Target Subject
Specifications Male or female that are used a right hand as dominant
Weight 50kg to 60kg
Pattern that applied to the muscles Lateral, Tripod, Tip, Power and Extension
4
1.5 Motivation and Significance
For the motivation and significance in this research, the motivation is to classify the Electromyography (EMG) signal. The signal is come from the human muscle. Then, the signal must be classify into several type of pattern. The EMG signal must be extract into time domain features which are Root Mean Square (RMS), Mean Absolute Value (MAV), Standard Deviation (STD) and Variance (VAR).
The technique used in the research is Fuzzy C-Means Clustering Technique (FCM). The technique used to classify the signal for every pattern.
1.6 Report Outline
In this report will go through into 5 chapters:
Chapter 1:
In this chapter, discuss about the project background which is explain about the project. Then, the problem statement of this project and the scope of the research also will be discussed.
Chapter 2:
In this chapter, reviews of the previous researches project that are related with this project will be discussed. The information will be become additional source for the project in to be able more successful. To have a brief understanding of the researches related to the project, a few literature reviews had been done. This chapter will describe the related to the literature reviews.
Chapter 3:
5
Chapter 4:
In this part, the discussion of the project and the result will show. The analysis of the result also discussed in this chapter.
Chapter 5:
6
CHAPTER 2
LITERATURE REVIEW
2.1 Electromyography (EMG)
7
that will affect the data. The main point of the EMG is to optimise the signal to ratio of noise [10].
2.2 Noise in Electromyography
The noises that exist while performing the experiment the raw EMG signal Electromyography can be divided into two types which are ambient noise and transducer noise. The ambient noise is the noise that produces from the computers and power line [10]. Then, the transducer noise is from the ionic to an electronic. The types of noise in transducer are D/C and A/C voltage Potential [10]. The noise that is caused by differences in the impedance between the skin and the electrode is D/C (Direct Current) Voltage Potential. For the noise that is generated by fluctuations in impedance between the conductive the skin and transducer is A/C (Alternating Current) Voltage Potential. The effective ways to overcome the noise between the conductive transducer and the skin is use the silver/silver chloride (Ag-AgCl) electrode that are consists a thin layer of silver chloride material and silver metal surface plated.
2.3 The Electrode
8
Figure 2.1: Disposable Ag/AgCl electrodes and the active surface electrode
2.4 The Location of the electrode
The surface electrode is placed at the forearm muscle. The experiment is using one input channel and three of the electrode. The three of electrode are two positive electrode and one ground electrode. The reference electrode which is the ground electrode that will locate at the bone and the other two electrodes must be near in 1cm only that is shown in figure 2.2. For the step of the experiment, firstly the subject‟s skin surface must be cleaned on forearm muscle. It is to reduce the skin impedance. Then, the skin in impedance will be measured. When the skin gets a light red colour, it shows good skin impedance condition [2]. Table 2.1 below shows the impedance ranges that are recommended.
9
Table 2.1: The Condition of the Skin Impedance
Impedance Range(KOhm) Recommendation
1-5 Very good
5-10 Good
10-30 Acceptable 30-50 Less good
>50 Should be avoid
2.5 The Signal Features Extraction of Electromyography (EMG)
10
Figure 2.3: Signal Processing For Pattern Classification in Typical Application
2.6 Fuzzy C-Means features reduction clustering technique
From the thesis [11], it says that compared to Neural Network, the fuzzy logic system give more consistent classification results. Besides that, fuzzy logic also has incentive to over-training. The accuracy rate EMG classification is given below:
Table 2.2: The Typical EMG Classification Accuracy Rate
The Typical EMG Classification Accuracy Rate
11
In biomedical, fuzzy logic system can be used for EMG signal classification [11]. To emulate human decision making more closely, fuzzy logic is more preferable than ANN [11]. In this thesis, the fuzzy C- Means Clustering (FCM) is used. To identify the grouping from the large data is the objective of clustering to make the data briefly. This method as an improvement on earlier clusters methods.FCM shows the clustering technique of the group data points into a specific number of data point in the dataset in a different clusters. When the data point that too close to the centre of the cluster it will have a high degree of membership function while the data point that is far away from the centre of the cluster will have a low membership function. Fuzzy Logic Toolbox command line function fcm performs FCM clustering starts with an initial guess for the cluster centers, which are intended to mark the mean location of each cluster. The initial guess for these cluster centers is most likely incorrect. Then, fcm assigns every data point a membership grade for each cluster. By iteratively updating the cluster centers and the membership grades for each data point, fcm iteratively moves the cluster centers to the right location within a data set. This iteration is based on minimizing an objective function that represents the distance from any given data point to a cluster center weighted by that data point's membership grade. The information by fcm to help to create the fuzzy inference system by creating the membership functions to represent the fuzzy classification for each cluster.
2.7 Review of Previous Related Works
non-12
invasive electrode. The invasive electrode is by using needle in electrode that are inserted in the muscle while non-invasive is the skin surface electrode that only work on skin surface of human body. There are many electrical noises that are affecting the data of EMG signal. There are inherent noise in electronics equipment, ambient noise, motion artefact and inherent instability of signal. There are some artificial intelligent techniques that are used for processing the EMG signal in the paper. The valuable information regarding the nerve system is carrying by EMG signal. The objective of this paper is to brief the information about the EMG and reveal the various methods to analyze the signal. There are discussing about the advantage and disadvantage about their technique for detection, decomposition, classification and process.
13
research, the EMG data was measured during lifting their hand without load and with a dumbbell for 3kg and 5 kg. The amplitudes are directly proportional to the load. That means, the higher the loads, the higher the EMG signal. The ideal feature can be obtain by calculate the percentage error for each feature.
Based on “A Practical Introduction to Kinesiological Electromyography” paper [4], by Peter Konrad, the research is about Electromyography (EMG). EMG means technique to develop record and analyze the myoelectric signals. The EMG also known as the study of muscle function through the inquiry of the electrical signal the muscles emanate. The EMG signal is widely used for applied research, sport training, interaction of human body and rehabilitation. There are many benefits of EMG. For example, the EMG allows to directly looking into the muscle. Besides that, it can helps in decision making before and after surgery. Then, it can allow the analysis to improve sport activities for human sport. Next, the EMG also helps patients to train their muscle in biomedical system. It will detect the muscle response in ergonomic studies to improve the knowledge about it. The „raw‟ EMG signal is unfiltered signal that are detected at the muscle. The factors that influence the EMG signal. There are tissue characteristics, external noise and electrode and amplifiers. The procedure for skin preparation is removing the hair. This is important to improve the adhesion of the electrodes of sweaty skin types. Second procedure is cleaning the skin. The reference electrode must be paste at joints or boney area. When the skin preparation is complete, the skin impedance must be test. The impedance ranges that are recommended are 1 to 5 (KOhm). The impedance range greater than 50 that should be avoids and requires cleaning for the second time.