CHAPTER II
THEORITICAL BACKGROUND
2.1 Review of the Literature 2.1.1 Investor Sentiment
Investor sentiment is defined as an aggregate measure of investors’ attitude toward market conditions and is generally categorized
as bullish, bearish or neutral. The literature on investor sentiment generally examines investors’ perceptions and effect on the market
independent of risk considerations. Often nested within literature discussing the effects of “noise traders” or irrational investors, investor
sentiment studies generally either supports of refute whether non risk related measures have the ability to change some fundamental aspect of a security such as price.
stocks exhibit higher returns. The studies of Fama and French (1992) and Lakonishok et al. (1994) support the result that low market-to-book ratio stocks have bigger expected return that high market-to-book ratio stocks. Such phenomena show that investors usually make investment decision based on their beliefs. Variables easy to measure can be defined in order to describe investor’s behavior.
Furthermore, optimism is another psychological behavior that can have effects on the formation of stock price. The optimists believe that they have the ability to predict stock prices and to make decision depending on their intuition. In addition, optimistic beliefs cause investor underestimate risk.
Moreover, the existence of common factors in the behavior of mutual fund investor has recently motivated researchers to capture market sentiment by mutual fund flows variations and since a couple of years this has become a very popular research field. Goetzmann et al. (1999) were among the first to empirically assess the role played by behavioral factors, such as market sentiment, in the variation of mutual fund flows. The documented negative correlation between daily flows to equity mutual funds, money market funds, and precious metal funds suggesting that a significant amount of trade may be explained by investor’s continuously rebalancing between cash and equity – their
2.1.2 Measurement of Sentiment Indicator
Several financial variables have been used to measure investor sentiment. Brown and Cliff (2004, 2005) for example, scrutinize various presumed indirect and direct indicators. For direct indicators, Lee et al. (2002) use the sentiment index provided by Investors’ Intelligence of
New Rochelle in New York as a proxy for investor sentiment. Investors’
Intelligence takes a poll of 135 investments advisory service every week and produces there numbers – bullish, bearish, and correction. Bullish is the percentage of investment advisor recommending investors to buy stocks. Bearish is the percentage of those predicting a bear market. Correction is the percentage of expecting a market correction.
Indirect sentiment indicators are determined by looking at objective variables that implicitly indicate investor sentiment. Although the theoretical link to investor is weaker, they circumvent the lack sample size and statistical representativeness (which and how many subject participate in surveys) of the direct measurement. In addition, measure of indirect sentiment can often be obtained at higher (e.g. daily) frequencies.
spreads. He also finds that close-end fund discounts are not able to predict returns on larger companies. His findings therefore confirm the hypothesis of Lee et al., (1991), which states that individual investors are major shareholders only in small firms and closed-end funds. The fluctuating discount should therefore reflect the irrational sentiment of individual investors and can forecast small firm returns. However, because closed-end fund discounts seem to be correlated with expectation of future earnings growth and expected inflation, Swaminathan (1996) suggests that closed-end fund discounts reflect investors’ rational expectations, rather than irrational sentiment.
Contrasting Swaminathan (1996), Elton et al. (1998) find opposing evidence for Lee et al.’s (1991) hypothesis. They show that an
index of closed-fund discounts enters the return-generating process of small firms not more often than expected by chance and even less than purely non-fundamental industry-indices consisting of large, institutionally held firms.
indicator increases the explanatory power for small stocks, value stocks, stock with low prices and stock with low institutional ownership. This means that when investors are bullish, these stocks show higher excess returns.
Kaniel et al. (2004) analyze individual investors’ orders
executed on the NYSE. They find that the trading of individuals is a market wide predictor of stock returns. Stocks return for which individuals show an increased interest for one week show an average excess return of 1.4 per cent for the following 20 days. However, the effect seems to be asymmetric, stocks excessively sold by individual investor do not perform worse than average in the following 20 days.
2.1.3 Indonesian Mutual Fund
The first reksa dana introduced in Indonesia was “Sertifikat Danareksa” at 1978 that was issued by PT. Danareksa which was
established at December 28th, 1976. The company was once announce as the best local issuer by the ASIAMONEY. The company has the research division which called Danareksa Research Institute (DRI) that given a routine result of the fundamental analysis, technical analysis, and also sectored analysis.
At the year of 2010 according to the data from Bapepam for December 2010 total fund collected from the mutual fund was Rp 144.70 billion and 31.53% or Rp 45.63 billion was the equity mutual fund. And for the year 2014, the equity mutual fund was collected for 43.65% or Rp 105.45 billion from total Rp 241.47 billion raised up to December 2014. From this data the researcher can take conclusion thet the equity mutual funds which serve at high risk and high income are still the most favorable investments in Indonesia as the investors in Indonesia are the type of risk seeking.
According to Infovesta (Infovesta.co.id, 2015) and Investopedia (Investopedia.com, 2015), there are various types of Indonesia mutual fund:
a. Money Market Fund
A money market fund’s portfolio is comprised of short-term
and monetary instruments. Investors can purchase shares of money market funds through mutual funds, brokerage firms and banks.
A money market fund's purpose is to provide investors with a safe place to invest easily accessible, cash-equivalent assets. It is a type of mutual fund characterized as a low-risk, low-return investment.
b. Fixed Income Fund
Income funds are named appropriately: their purpose is to provide current income on a steady basis. When referring to mutual funds, the terms "fixed-income," "bond," and "income" are synonymous. These terms denote funds that invest primarily in government and corporate debt. While fund holdings may appreciate in value, the primary objective of these funds is to provide a steady cash flow to investors. As such, the audience for these funds consists of conservative investors and retirees.
Bond funds are likely to pay higher returns than certificates of deposit and money market investments, but bond funds aren't without risk.
c. Equity Fund
to bonds, notes, or other securities. This may be a mutual fund or exchange-traded fund. The objective of an equity fund is long-term growth through capital gains, although historically dividends have also been an important source of total return. Specific equity funds may focus on a certain sector of the market or may be geared toward a certain level of risk.
The development of equity funds in Indonesia from 2011 to 2014 continues to increase, despite a decline in 2013 amounted to 62.31% in September and increased by almost 2-fold in the next month making equity funds are still believed to be one of promising alternative investments. Growth of equity mutual funds from 2011 through 2014 could surpass the performance of JKSE, where throughout the period, equity funds were able to grow by 25.39% compared to JKSE which only grew by 12.50%. The development of mutual funds are still influenced by the strengthening of the stock price index conditions, volatility of global economic conditions, and the presidential election that occurred in 2014. The researcher uses equity mutual fund as an indicator for investor sentiment because it still becomes an atlternative way for investors to reach high return and high income.
d. Balance Fund
funds is to invest in a combination of fixed income and equities. A typical balanced fund might have a weighting of 60% equity and 40% fixed income. The weighting might also be restricted to a spesified maximum or minimum for each asset class.
e. Protected Fund
Protected Fund is a type of mutual fund that guarantees an investor at least the initial investment, plus any capital gains, if it is held for the contractual term.The initial investment is protected by an insurance policy in case the fund is unable to pay the investor back his or her principal. The initial investment can only be paid back after the guarantee period is over; if the investor sells before this period, he/she is subject to the current value of the fund and any losses that may arise. This type of fund tends to have higher expense ratios than other types of mutual funds.
f. Index Fund
This type of mutual fund replicates the performance of a broad market index such as the S&P 500 or Dow Jones Industrial Average (DJIA). An investor in an index fund figures that most managers can't beat the market. An index fund merely replicates the market return and benefits investors in the form of low fees.
g. Exchange Traded Fund (ETF)
an index fund. Unlike mutual funds, an ETF trades like a common stock on a stock exchange. ETFs experience price changes throughout the day as they are bought and sold. ETFs typically have higher daily liquidity and lower fees than mutual fund shares, making them an attractive alternative for individual investors. Because it trades like a stock, an ETF does not have its net asset value (NAV) calculated once at the end of every day like a mutual fund does.
2.1.4 Net Asset Value (NAV)
Chay andnTrzcinka (1999) explore the possibility that discounts reflect the rational pricing of future expected NAV performance. For a sample of 94 stock funds in the U.S. market up to December 1993, and in contrast to previous research, they find a significant and positive correlation between the premium and subsequent NAV returns at horizons up to a year. They find no such correlation in a sample of 22 bond funds. They conclude that discounts on stock funds incorporate perceptions of managers’ abilities, which under rational expectations would emerge in future NAV returns.
capital gains. As a result, changes in NAV are not the best gauge of mutual fund performance, which is best measured by annual total return (Samsul, 2006).
ࡾൌ ሺࡺࢂ࢚െ ࡺࢂ࢚ିሻȀࡺࢂ࢚ି
Where:
ܴ = Return of Equity Mutual Fund
ܰܣܸ௧ = Net Asset Value present time
ܰܣܸ௧ିଵ = Net Asset Value previous time
2.1.5 Excess Stock Return
Stock return is the gain or loss of a security in a particular period. The return consists of the income and the capital gains relative on an investment. It is usually quoted as a percentage. Investment returns from a security or portfolio that exceed a benchmark or index with a similar level of risk is called excess return. It is widely used as a measure of the value added by the portfolio or investment manager, or the manager's ability to "beat the market." It is also known as alpha. Mathematically speaking, excess return is the rate of return that exceeds what was expected or predicted by models like the capital asset pricing model (CAPM). To understand how it works, consider the CAPM formula (Investopedia, 2015):
r = Rf + beta * (Rm - Rf ) + excess return Where:
Rf = the risk-free rate of return
beta = the security's or portfolio's price volatility relative to the overall market
Rm = the market return
The bulk of the CAPM formula (everything but the excess-return factor) calculates what the rate of excess-return on a certain security or portfolio ought to be under certain market conditions. Note that two similar portfolios might carry the same amount of risk (same beta) but because of differences in excess return, one might generate higher returns than the other. This is a fundamental quandary for investors, who always want the highest return for the least amount of risk. Why it matters? Excess return is a measurable way to determine whether a manager's skill has added value to a portfolio on a risk-adjusted basis. This is why it is the holy grail of investing to some.
Critics of mutual funds and other actively-managed portfolios contend that it is next to impossible to generate excess returns on a consistent basis over the long-term, as a result of which, most fund managers underperform the benchmark index over time. This has led to the tremendous popularity of index funds and exchange-traded funds. 2.1.6 Volatility
Volatility refers to the amount of uncertainty or risk about the size of changes in a security's value. A higher volatility means that a security's value can potentially be spread out over a larger range of values. This means that the price of the security can change dramatically over a short time period in either direction. A lower volatility means that a security's value does not fluctuate dramatically, but changes in value at a steady pace over a period of time.
2.2 Review on Related Study
2.2.1 Relationship on Investor Sentiment affects Returns and Volatility
a. Directional Impact Sentiment
The first relationship considers the direct impact of investor sentiment on excess market returns. The directional impact sentiment has on these excess returns follows from two effect suggested by the De Long et al. (1990), the “hold more” effect and the “price
pressure” effect. The first effect relates to the hypothesis that noise
traders hold proportionately more of the risky asset that the sophisticated fundamentalists, when bullish on average. Since noise traders bear more of the risk in the market, they also expect a higher return. On the other hand when average sentiment is bearish, noise traders hold less of the risky asset and therefore require a lower expected return. If this hypothesis holds, we expect to see a positive relationship between excess return and investor sentiment.
The second effect, the “price pressure” effect, has moderating
increases expected return. The latter effect therefore expects a negative relationship between sentiment and excess returns.
b. Conditional Volatility
The second relationship considers how the conditional volatility affects the excess returns of the market indices, where the conditional volatility is affected by the variance in investor sentiment. The first effect has become known as the “Friedman”
effect, which refers to the notion that noise trader’s trade at the worst time possible, i.e. they buy high and sell low. This effect increases the volatility in the market and decreases the return to noise traders.
The second effect, known as the “create space” effect, relates
to the notion that noise traders increase risk by their own trading and are rewarded for the risk. The effect entails that when the variability in noise traders’ belief increases, this increases the volatility of the
market. This increased the variability in noise traders’ beliefs scares away sophisticated traders in the market and therefore increases the expected return to the noise traders.
2.2.2 Previous Research Study about Relationship on Investor Sentiment affects Returns and Volatility
evidence for the “hold more” effect, which states that when noise traders
hold more of the asset, they also see their returns increase, and the “create space” effect, which states that noise traders are rewarded for
additional risk they generate themselves.
Aydogan et al. (2014) used long run dynamic relationship is examined by using cointegration tests, short-run dynamic causal relationship through vector error correction model. The results of cointegration test show that there is cointegrating relationship among each category of mutual fund flows and stock index. Moreover, the statistical evidence indicates that there is bidirectional causality between all categories of mutual fund flows and stock returns. Thus, the empirical findings will prove to be extremely useful information for investors who need to understand these dynamic interactions.
Brown et al. (2005) found evidence that is consistent with the hypothesis that daily mutual fund flows may be instruments for investor sentiment about the stock market. They used this finding to construct a new index of investor sentiment, and validate this index using data from both the United States and Japan. In both markets exposure to this factor is priced, and in the Japanese case, they documented evidence of negative correlations between flows of “Bull” and “Bear” domestic funds. The
is a foreign vs. domestic sentiment factor in Japan that does not appear in the contemporaneous U.S. data. By contrast, U.S. mutual fund investors appear to regard domestic and foreign equity mutual funds as economiccomplements. They also presented supporting evidence using monthly data and conduct a crosscountry analysis.
Sayim et al. (2013) used The American Association of Individual Investors Index (AAII) is used as a proxy for US individual investor sentiment. The U.S. market fundamentals are regressed on investor sentiment in order to capture the effect of macroeconomic risk factors on investor sentiment. Then impulse response functions (IRFs) are generated from a VAR model to investigate the effect of unanticipated movements in US investor sentiment on both industry-specific stock return and volatility. The results show a significant impact of investor sentiment on stock return and volatility in all the industries. The researcher found that the positive rational component of US individual investor sentiment tends to increase the stock return in these industries. The researcher also documented that unanticipated increase in the rational component of US individual investor sentiment has a significant negative impact only on the industry volatilities of U.S. auto and finance industries.
effects of noise trader demand shocks on returns and volatility. EGARCH model is used to determine whether earning shocks have more influence on the conditional volatility in high sentiment periods weakening the mean–variance relation. This paper takes an international approach using weekly market index returns of U.S., Japan, Hong Kong, U.K., France, Germany, and Turkey.Weekly trading volumes of these indexes are regressed against a group of macroeconomic variables and the residuals are used as proxies for investor sentiment and significant evidence is found that there is asymmetric volatility in these market indexes and earning shocks have more influence on conditional volatility when the sentiment is high.
relate to market data better than those of individual investors. In behavioral models, it is believed that investors' widespread optimism and pessimism can cause prices to deviate from their fundamental values, leading to temporary price corrections in the form of mean-reverting behavior when those expectations are not met. Using periodic realized market returns as anchors, he found a positive (negative) insignificant (significant) relationship between daily index returns and bullish (bearish) sentiment. These effects are stronger when the state of implied volatility is controlled as low, moderate, and high state.
Prince and Bacon (2007) analyzed the small cap growth stock sector of the mutual fund industry against risk-free and market returns over the ten years 1997-2006. Results are tested against a toolkit of performance benchmarks to see if expected performance closely corresponds to the actual results. Development of various performance benchmarks has allowed investors to quantitatively assess various portfolio alternatives and has established that diversification can reduce systematic risk. The results indicate that some excess returns have been generated; however, beyond a handful of the funds, it is impossible to rely upon a single benchmark as a reliable indicator of even past performance. A “portfolio approach” of combining the benchmarks does
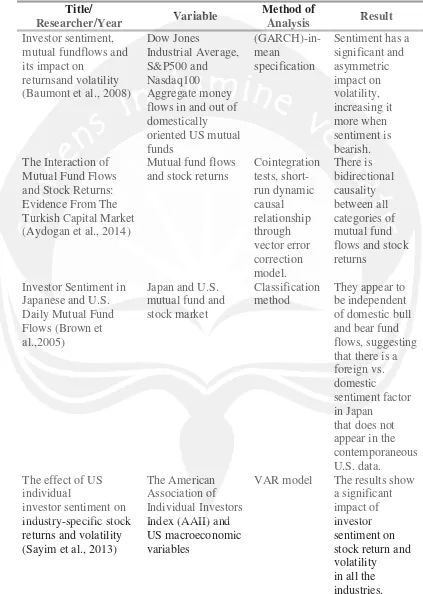
Table 2. 1
Summary of Previous Research
Title/
Researcher/Year Variable
Method of
Analysis Result Investor sentiment,
mutual fundflows and its impact on
returnsand volatility (Baumont et al., 2008)
Dow Jones
Industrial Average, S&P500 and Nasdaq100 Aggregate money flows in and out of domestically oriented US mutual funds
(GARCH)-in-mean
specification
Sentiment has a significant and asymmetric impact on volatility, increasing it more when sentiment is bearish. The Interaction of
Mutual Fund Flows and Stock Returns: Evidence From The Turkish Capital Market (Aydogan et al., 2014)
Mutual fund flows and stock returns
Cointegration tests, short-run dynamic causal relationship through vector error correction model. There is bidirectional causality between all categories of mutual fund flows and stock returns
Investor Sentiment in Japanese and U.S. Daily Mutual Fund Flows (Brown et al.,2005)
Japan and U.S. mutual fund and stock market
Classification method
They appear to be independent of domestic bull and bear fund flows, suggesting that there is a foreign vs. domestic
sentiment factor in Japan
that does not appear in the contemporaneous U.S. data.
The effect of US individual
investor sentiment on industry-specific stock returns and volatility (Sayim et al., 2013)
The American Association of Individual Investors Index (AAII) and US macroeconomic variables
The impacts of investor sentiment on returns and
conditional volatility of international stock markets (Uygur and Tas, 2013)
XU100, SPX, DOW, NASDAQ, DAX, CAC, FTSE, HANG, NIKKEI.
EGARCH There is asymmetric volatility in these market indexes and earning shocks have more influence on conditional volatility when the sentiment is high
Modeling Market Sentiment and Conditional
Distribution of Stock Index Returns under GARCH Process (Arik, 2011)
Survey-based measures of both individual and institutional investor sentiment, along with a set of macroeconomic variables
GARCH Negative relation between stock returns and implied volatility, positive and statistically significant relationship between changes in the sentiment Bull Ratio of both institutional and individual investors and S&P 500 excess returns in the following month, positive (negative) insignificant (significant) relationship between daily index returns and bullish (bearish) sentiment. Analyzing Mutual Fund Performance Against Established Performance
Benchmarks: A Test of Market Efficiency (Prince and Bacon,
Small cap growth stock sector of the mutual fund industry and risk-free and market returns. Quantitatively assess various portfolio alternatives Some excess returns have been generated;
however, beyond a handful of the funds,
2007) rely upon a single benchmark as a reliable indicator of even past
performance. Source : Beamont et al. (2008), Aydogan et al. (2014), Brown et al. (2005), Sayim
et al. (2013), Uygur and Tas (2013), Arik (2011), Prince and Bacon (2007).
2.3 Hypothesis Development
Based upon findings of Goetzmann et al. (1999), Brown et al. (2005) and Beamont et al. (2008), equity mutual fund can be used to measure significantly investor sentiment on excess market and volatility. The impact on excess return will be divided into two relationships, “hold more” and
“price pressure” effects. In determining conditional volatility, it will be
categorize into two effects, “Friedman” and “create space” effects to know
which one is more important for the Jakarta Composite Index (JCI). The hypothesis raised in this research is as follow: