Development of Customized Distribution
Automation System (DAS) for Secure Fault
Isolation in Low Voltage Distribution System
M. M. Ahmed, W.L. Soo, M. A. M. Hanafiah and M. R. A. Ghani
University Technical Malaysia Melaka (UTeM)
Malaysia
1. Introduction
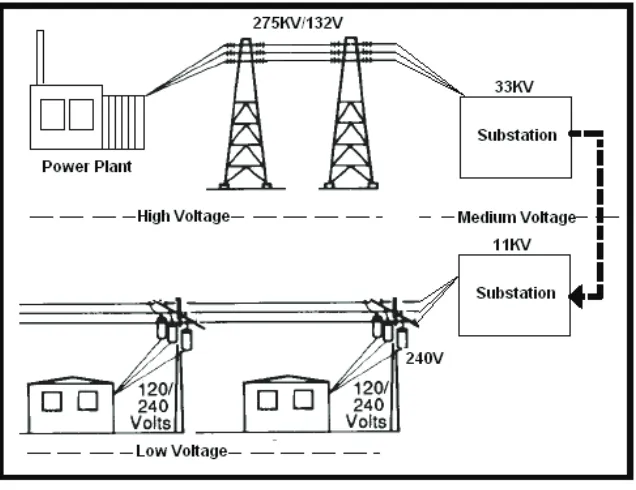
In general, an electric power system includes a generating subsystem, a transmission subsystem and a distribution subsystem. Electric power systems may have minor differences between countries due to geographical factors, demand variances, regions and other reasons. The voltages and frequencies for consumers around the world are depending on their regions. The power grids typically transmit electricity in three levels of voltage which are HV (100,000 Volts upwards), MV (1000 Volts to 100,000 Volts) and LV (1 to 1000 Volts). Fig. 1 shows the typical power production and distribution process.
Programmable Logic Controller 132
The electricity production process begins with its generation in power plants. The generated electric power is supplied through step-up transformers to raise the voltage to HV of transmission voltage before it is transmitted by transmission lines to transformer substations.
The substations reduce the transmission voltage via power transformer in Main Intake Distribution Substation (MIDS). MIDS is a node for terminating and reconfiguring transformers that step down the HV transmission voltage to Primary Distribution Voltage Level (PDVL).
The power is distributed from the transformer substations to the electric distribution network via Main Switch Station (MSS). Basically MSS is a node for terminating and reconfiguring the PDVL line of many feeders consisting of substations. In areas where power needs to be delivered to consumers, the power transformers in the substation are used to convert or step down the HV into a much lower voltage. Each feeder of MSS consists of a few substations that stepped down to consumer voltage. Basically, the network configuration for the distribution system is a loop circuit arrangement and each feeder consists of substations separated into two parts by the NOP.
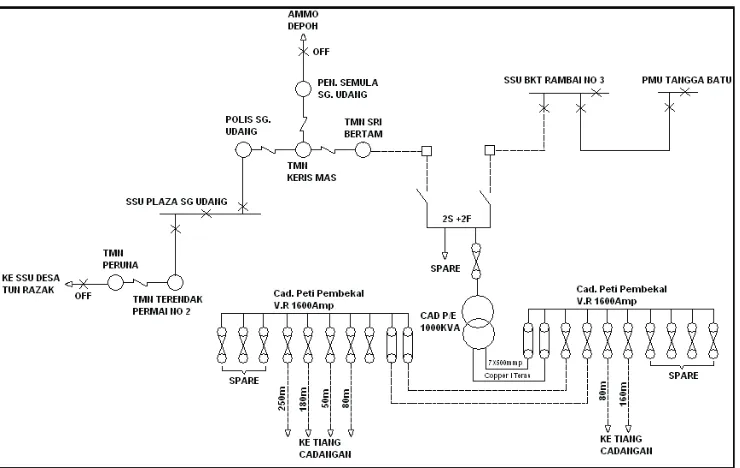
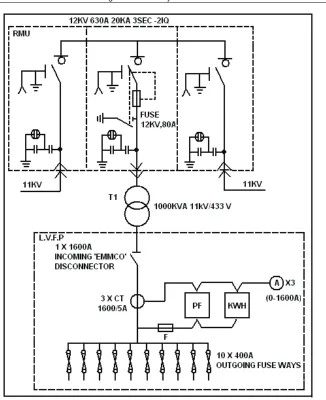
Fig. 2. An Example of Distribution Substation 11/0.415 kV
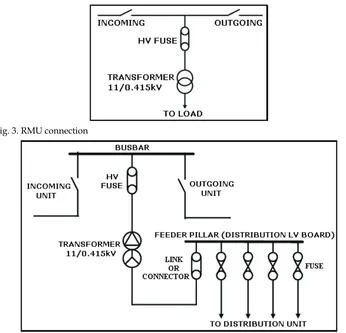
Fig. 3. RMU connection
Fig. 4. Distribution Substation 11/0.415 kV
Substations serve as sources of energy supply for the local areas of distribution in which they are located. Their main functions are to receive energy transmitted at HV from the transmission lines, acted as nodal point from which the power or electricity can be changed or distributed from it to the other substations or consumers and provide facilities for switching. Substations are accessed by their incoming and outgoing switches connected by other substations and allow the fault point due to the substation which affects in the system that be isolated with switching method and the electricity remain supplied via other back up supply. They provide points where safety devices may be installed to disconnect circuits or equipment in the event of trouble. Some substations are equipped with EFI in order to locate the fault point either from upstream or downstream.
2. Low voltage distribution system
Programmable Logic Controller 134
The application of Automation system is one of the best solutions to those problems. In this book, an application of automation system has been proposed and described applied into practical LV systems for the solution of these problems.
However, the distribution systems have grown in an unplanned manner resulting in high system losses in addition to poor quality of supply. The other reasons are the lack of use of efficient tools for operational planning and advanced methodology for quick detection of fault, isolation of the faulty section and service restoration. Currently, fault detection, isolation and service restoration takes a long time causing the interruption of supply for a longer duration.
SCADA can be used to handle the tasks which are currently handled by the people and can reduce frequency of periodic visit of technical personal substantially. SCADA is a process control system that enables a site operator to monitor and control processes that are distributed among various remote sites. The control functions are related to switching operations, such as switching a capacitor, or reconfiguring feeders. Once the fault location has been analyzed, the automatic function for fault isolation and supply restoration is executed. When the faulty line section is encountered, it is isolated, and the remaining sections are energized. This function directly impacts the customers as well as the system reliability.
This research is to develop a state of the art technology which targets all types of LV systems and could be extended to lower voltage, medium voltage as well as higher voltage applications in electrical, electronic, communication and mechatronics engineering.
In the early stage of introduction, distribution control technologies have lagged behind if compared with advances in generation and transmission controls.
In Korea, the general structure of 154kV distribution substations using GIS standard. One distribution substation is composed of fixed devices such as a few transmission lines, 154kV double buses, two to four of 154kV/22.9kV main transformers, 22.9kV double structured distribution bus, many distribution lines, and switching devices like CBs and line switches (Lee & Park, 1996).
The fault point isolation is also based on the operation of corresponding relays and CBs but the switching operation is done manually by the operators. KEPCO has suggested four step processes to their operators. Step1 is to isolate the fault section using switches or CBs. Step 2 is to isolate black-out distribution line or transformers. Step 3 is to restore CBs one by one. The system uses radial operation and load transfer is allowed up to 90% of capacity of each transformer.
Bretas and Phadke (2003) proposed restoration scheme which composed of several Island Restoration Schemes(IRS). Each IRS is composed of two ANNs and a switching sequence program (SSP). The first ANN of each IRS is responsible for an island restoration load forecast. The input of this ANN will be a normalized vector composed of the pre-disturbance load. The second ANN of each IRS is responsible for the determination of the final island configuration and the associated forecast restoration load pick up percentage that will generate a feasible operational condition.
Huang C.M (2003) addressed multi objective service restoration problem (SRP) with a fuzzy cause-effect network for minimizing a set of criteria, including the load not supplied and the number of switching operations. All of them are converted into a single objective function by giving relative weighting values for each criterion.
Hsiao et al (2000) proposed a reconfiguration for service restoration in a distribution system using a combination of fuzzy logic and genetic algorithms. The objectives of the proposed reconfiguration methodology were to maximize the load restored in the system and minimize the switching operations for the reconfiguration. However, the methodology proposed in this work is only applicable to radial power system.
3. Distribution automation system
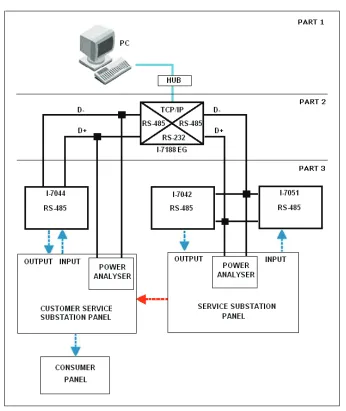
The system architecture for this research is divided into three parts as shown in Fig. 5. The first part involves investigation of SCADA equipment or HMI. PC is equipped with GUI that runs under the Microsoft Windows XP platform using InduSoft software. The GUI provides monitoring for service substation and customer service substation, real-time data, data trending, data archiving, display and recoding alarm messages, show communication status of the system and control execution. Systems operations personnel use this equipment to control and monitor the I/O remotely.
Level 2 consists of I-7188EG embedded Ethernet. The control program is downloaded into the controller. The logic programming for service substation and customer service substation is almost identical. The logic programming is configured by using IsaGRAF software manufactured by ICPDAS. I-7188EG is responsible for communicating with the SCADA equipment using TCP/IP protocol. I-7188EG also acts as converter to link the SCADA equipment to the I-7044 module, I-7051 module and I-7042 module using RS485 protocol. The controller also receives data from power analyzer by using RS-485 protocol. Controller I-7188EG can handle control functions without the PC in real time.
Level 3 consists of I/O modules and three panels. The I/O modules are I-7044 module which is an 8 channel digital output and 4 channel digital input module, I-7051 which is a 16 channel digital input and I-7042 which is a 13 channel digital output. I-7044 module receives signal from ELCB in the customer service substation panel. It then converts the signal into RS485 standard signal and transfers to RS485 network. This signal is received by I-7188EG controller. I-7044 module receives signal from the controller to trigger certain actions to the relays as output devices. I-7051 and I-7042 are responsible to receive and send signals to I/O of service panel. Power analyzer is a power measurement metering device that displays volts, amps, watt, vars and etc. It sends data directly to the controllers to be displayed at the monitor.
In actual practice, service substation panel is connected to more than one customer service substation panel. In this research, service substation panel is only connected to one customer service substation panel. Customer service substation panel is connected to the consumer panel. In this case, the consumer panel consists of lights as the control loads.
Programmable Logic Controller 136
Fig. 5. System Architecture
Fig. 6. Substation Installed By Schneider
5. HMI screen architecture
In Fig.8, the user interface starts with login screen. The default user name is “Guest”. The user needs to login before being able to use the toolbar described in Fig.9. The current user name will be displayed at the top right of the screen.
Programmable Logic Controller 138
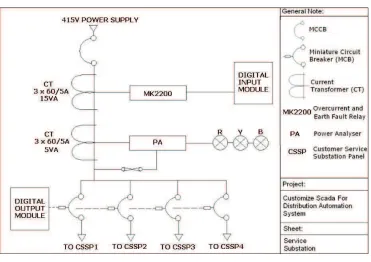
Fig. 7. Schematic Diagram of Service Substation
Fig. 8. Screen Architecture
Fig. 9. Log on Dialog Box
The body section consists of symbols of I/O, control button, communication status, values of voltages and currents.
The footer section consists of alarm display screen that is located at the bottom of the main screen. Besides that the alarm display button is selected for filtering the alarm. Selection field is used to filter alarm messages by the selection text which is defined by the user. Priority field is used to filter alarm messages based on priority level. Total alarms will indicate the total alarm displayed. By pressing “Ack Top” button, the alarm on top of the alarm list will be acknowledged. Operation personnel can acknowledge all alarms by pressing on “Ack All”. All the alarms displayed will be printed out once the print button is pressed. Operation personnel can press the “beep” button to disable the alarm’s sound. Fig. 10 shows the main screen of the SCADA Distribution Automation System. Main screen displays both panels which are service substation panel and customer service substation panel.
Programmable Logic Controller 140
Fig. 10. The Main Screen
Some tags are configured to the alarm parameters such as priority, selection, message, type and limit. Priority is to indicate the priority within the alarm group. Tags with a higher priority must have a higher priority value. Selection is used to filter in the alarm summary objects. The message part of the alarm screen is used to message the associated alarm that will be displayed on the Alarm/Event Control object. The type refers to the type of alarm such as Hi, Lo, HiHi and LoLo. Limit is the limit value associated to the alarm.
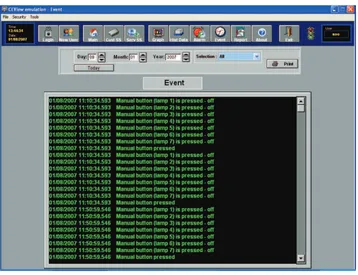
Event screen displays the list of event triggered by the operation personnel. For example, the event of pressing the reset button will be captured and displayed in event screen. Operation personnel can set specific date of event to be displayed or clicked on “today” button to display event that happened today. Fig.12 shows the event screen.
Fig. 12. Event Screen
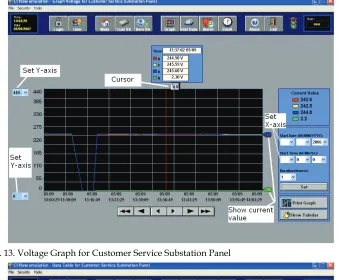
The graph will provide on-line data of voltage and current from the power analyzer. Cursor button located at the top of the graph can be dragged to know the value along a certain position of the graph. X-axis and Y-axis can be adjusted to the user preferences. A combo box on the left side of the graph is used to change the property of X-axis and Y-axis. Start Date, Start Time and duration are used to set the X-axis. Fig.13 describes the trending screen for the customer service substation panel to display voltage values.
Programmable Logic Controller 142
Fig. 13. Voltage Graph for Customer Service Substation Panel
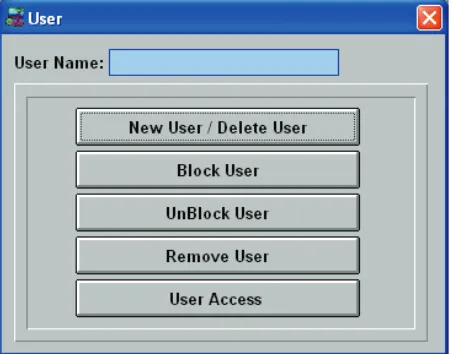
User dialog box is to create new user, delete user, block and unblock user. Fig.15 shows the user dialog box. When “New User/Delete User” button is pressed, the screen shown in Fig.16 will be displayed. User can be blocked from accessing the application by clicking on “Block User” button. “Unblock User” button will undo the block user action. User can be removed by clicking on “Remove User”. “User Access” is to set which screens that are allowed to be accessed under certain user group. Fig.21 illustrates the user access dialog box.
Fig. 15. User Dialog Box
Fig. 16. User Account Dialog Box
Programmable Logic Controller 144
Fig. 19. New User Account Dialog Box
Fig. 20. Setting Dialog Box
6. HMI screen architecture
6.1 System operation and experimental
The system can be set to manual mode or automatic mode. The two operations which are the Operation Without Fault and Operation With Fault are described below.
6.2 Operation Without Fault
After success login to the system, control screen to be displayed is chosen from the toolbar. An example is shown in Fig.21, when “Serv SS” button is pressed, the service substation screen will be displayed. Currently all outputs are in healthy conditions. The communication status shows no communication error with the modules as well as the power analyzer. Fig.22 shows the values of counters during normal conditions. Loads will be turned in sequence and ‘count_L_cur_c’ will be increased by one.
Fig. 21. Healthy Condition at the Service Substation Panel
6.3 Operation With Fault
Programmable Logic Controller 146
Fig. 22. Counters for OLUC and OLDC
Fig. 24. Fault has occurred at Load 2
If the system is operated under automatic mode, the controller will automatically reset the ELCB using a delay timer and the power input will be turned on again. OLUC will execute where each load will be turned on in sequence starting from main MCCB or load 0. Trip will occur once the faulty load is turned on and the ‘count_L_cur_sv’ indicates this faulty load which is described in Fig.24.
Fig. 25. Fault Point has been Isolated
The ELCB is reset and electricity power supply is supply to the system. OLUC will be executed once again and will turn on main MCCB and Zone1. However Zone2, Zone3 and zone4 are still remained off. Then the OLDC will be executed. The OLDC will turn on Zone 3 and Zone 4. Fig.26 shows Zone 2 which is the fault zone will remain off.
Programmable Logic Controller 148
Fig. 26. Fault Isolation at the Service Substation Panel
7. Conclusion
In this research project, a Customized SCADA based RTU for service substation and customer service substation is developed by using the open loop concept for the distribution networks. Currently, the SCADA system in the low distribution system implemented by TNB only focuses on alarm monitoring. SSO has to operate the control functions at the HMI side. The operator needs to analyze the situation and to make appropriate actions.
In this research, a Customized SCADA is built to provide automatic fault isolation for low distribution system. The objective of the research is to provide an HMI for SCADA that is capable to build interfaces with I/O devices and fault isolation method. The contribution of this research includes developing a complete fault isolation algorithm based on an open loop distribution system. Service Substation Panel, Customer Service Substation Panel and Customer Panel have been built to validate the proposed methodology. In this chapter, the proposed methodology is summarized with the experimental results and conclusion based on the results is also highlighted.
the power analyzer. The SCADA software used in this research is propriety software shared by the same protocol with the embedded Ethernet controller which makes the communication possible by using modbus TCP protocol. The HMI can be monitored at different sites as the controller equipped with TCP/IP features. Whenever the system detects fault, an alarm message will be displayed at the HMI side to acknowledge the operator. The status of communication between the controller, digital I/O modules, power analyzer with the HMI helps to acknowledge the operator if there is a communication breakdown. This feature improves the reliability of the SCADA system in sending or receiving data from the devices.
Based on the experimental results, the system correctly locates the fault point, isolates the fault point and reenergizes the un-faulted loads. However, during the fault isolation operation, the system has to detect the fault point by simply switching on the fault load. After the system acknowledges the fault point, the appropriate switching functions are executed. The developed system has a potential in reducing the outage time while comparing to the manual operation by the technicians and engineers.
The SCADA system provides GUI, alarm system, data logging and report management facilities for the operator to interact with the equipment in the service substation and the customer service substation. The usage of RTU allows for future expansion. New technologies such as GSM and satellite communication are becoming available and will allow for new low cost automation system solutions.
8. Future research
This research project is a step towards developing customized DAS for LV distribution system and much more work lies ahead in evaluating new DAS technology and in developing new DAS applications. However, the outcome of this research as first effort has been very encouraging and bringing beneficial to the DAS research development in the future.
a. Using web based application as GUI supported by IP-based computer networks and
internet connectivity as communication network to remote sites.
b. Improving the data communication system for distribution automation such as Global System for Mobile (GSM), Code Division Multiple Access (CDMA) and Wireless in Local Loop (WLL), Distribution Line Carrier Communication (DLCC) and Radio Communication.
9. References
Lee, H.J. & Park, Y.M. (1996). A Restoration Aid Expert System for Distribution Substations. IEEE Transactions on Power Delivery, Vol. 11, pp.1765 -1769
Bretas, A.S & Phadke, A.G. (2003). Artificial Neural Networks in Power System Restoration. IEEE Transactions on Power Delivery, Vol.18, No.4 , pp.1181 -1186.
Hsu, Y.Y & Huang, H.M. (1995). Distribution System Service Restoration using the Artificial Neural Network Approach and Pattern Recognition Method. IEEE Proceeding Generation Transmission Distribution, Vol. 142, No.3, pp.251-256.
Programmable Logic Controller 150
Edited by Luiz Affonso Guedes
ISBN 978-953-7619-63-3 Hard cover, 170 pages
Publisher InTech
Published online 01, January, 2010
Published in print edition January, 2010
InTech Europe
Unit 405, Office Block, Hotel Equatorial Shanghai No.65, Yan An Road (West), Shanghai, 200040, China
Phone: +86-21-62489820 Fax: +86-21-62489821
Despite the great technological advancement experienced in recent years, Programmable Logic Controllers (PLC) are still used in many applications from the real world and still play a central role in infrastructure of industrial automation. PLC operate in the factory-floor level and are responsible typically for implementing logical control, regulatory control strategies, such as PID and fuzzy-based algorithms, and safety logics. Usually PLC are interconnected with the supervision level through communication network, such as Ethernet networks, in order to work in an integrated form. In this context, this book was written by professionals that work and research in automation area and it has two major objectives. The first objective is present some advances in methodologies and techniques for development of industrial programs based on PLC. The second objective is present some PLC-based real applications from various areas such as manufacturing system, robotics, power system, communication system, and education.
How to reference
In order to correctly reference this scholarly work, feel free to copy and paste the following:
M. M. Ahmed, W.L. Soo, M. A. M. Hanafiah and M. R. A. Ghani (2010). Development of Customized Distribution Automation System (DAS) for Secure Fault Isolation in Low Voltage Distribution System,