Effect of Conducting Materials on UV-Vis Spectral
Response Characteristics
Norazhar Abu Bakar
1,2,*, A.Abu-Siada
1, Narottam Das
1, Syed Islam
11
Department of Electrical and Computer Engineering, Curtin University, Perth WA 6845, Australia
2
Faculty of Electrical Engineering, Universiti Teknikal Malaysia Melaka, 76100 Melaka, Malaysia *Corresponding Author: [email protected]
Copyright © 2013 Horizon Research Publishing All rights reserved.
Abstract
Spectroscopic analysis is recently being employed to measure furan concentration in transformer oil. Light absorbance and spectral bandwidth are used as indicators to estimate furan concentration level in transformer oil. However, the possibility of dust and other conducting materials that might exist in transformer oil sample need to be considered as it may influence the spectroscopic performance. In this paper, series of tests are carried out to investigate the impact of dust on the transformer oil spectral response characteristics. Oil sample with various furan concentrations along with certain amount of copper powder are examined. Experimental results show that the spectral response characteristics only affected by dust at the beginning of mix process. However, the characteristic returns to the original one within a few minutes.Keywords
UV-Vis Spectroscopic, Transformer Insulation Oil, Furan Analysis1. Introduction
Power transformers are a vital link in any electrical transmission or distribution network. Unexpected failure of transformers would lead to a catastrophic electricity shortage either to industrial or residential consumers. With appropriate monitoring and diagnostic techniques for incipient fault detection, the catastrophic failures could be avoided and an efficient predictive maintenance can be provided in order to improve the reliability of the equipment [1]. The insulation system within power transformers consists of paper insulation immersed in insulating oil [2, 3]. Often, power transformer operational life is referred to the remaining life of the solid insulation (paper), hence samples of transformer oil and paper insulation are essential sources to detect incipient and fast developing faults.
Paper insulation consists of cellulose, hemi-cellulose, lignin and some mineral substances. The amount of these
substances varies regarding the types of the Kraft paper used. According to [4], paper insulation is composed of approximately 90% of cellulose, 6-7% hemi-cellulose and 3-4% of lignin. Cellulose is a linear polymer of glucose molecules, which are connected together via glycosidic bond [5]. When degradation of paper insulation occurs, hydrogen bonds are tending to breakdown making the cellulose molecular chain to get shorter. As results, some chemical products such as CO, CO2 and furan derivatives are formed and dissolve in the oil.
Furfural content analysis is widely used to determine the health condition of paper insulation and to estimate the remaining life of power transformer, since there is strong correlation between furan concentration and degree of polymerization (DP) of the paper insulation [6-8]. De Pablo reported the following relation between DP and furfural concentration based on viscosity which also considering the operating condition effects [7]:
1
where 2FAL is the furfural concentration in mg/kg of oil. Currently, the most common techniques used to measure furan concentration are either High-Performance Liquid Chromatography (HPLC) or Gas Chromatography-Mass Spectrometry (GC/MS) based on American Society for Testing and Materials (ASTM D5837, Standard Test Method for Furanic Compounds in Electrical Insulating Liquids by HPLC) [9]. Both analysis methods are capable to provide accurate and reliable results for furan concentration in transformer oil. However, due to complexity and time required by both methods, another instant method to measure furan concentration using spectroscopy is introduced [4,10].
2. Spectroscopy History
Inspired by electromagnetic radiation wave theory discovered by Maxwell in 1864, which afterward led to the quantum theory, several spectroscopic diagnostic tools are developed based on different spectrum regions and its applications. Various spectroscopy from low electromagnetic radiation such as radio wave, up to high energy like gamma ray are introduced for particular application and diagnoses regarding their quantum transition types and interaction effects. For example, infrared radiation is used to measure molecular rotation and vibration, while ultraviolet to visible radiation is used to measure electronic transition (valence electrons). Alternatively gamma rays radiation is the best to measure nuclear transition [11].
In 1999, Shenton et al. [12] implemented a spectroscopy technique to study the degradation and life prediction of polymer which later on extended to assess the condition and predict the lifetime of paper and oil used in transformer insulation. In 1998, Percherancier and Vuarchex [13] employed Fourier Transform Infrared (FTIR) spectrometry to detect additives and contaminants in insulating oil. Koreh et al. [14] applied the same spectrometry (FTIR) to study water clusters in insulating oil. Hamada et al. [15] also applied infrared absorbance technique to detect oxidation products in mineral oil. Ali et al. [16] used the spectroscopic (FTIR and near-infrared (NIR)) to examine the ageing of cellulose paper and concluded that vibration spectroscopy is potentially to be used in monitoring cellulosic material. This supports an early conclusion done by Liu et al. [17] on an Australian cotton cellulose fibers. Based on successful laboratory results achieved in [13, 14, 16], Baird et al. [18-20] developed a portable spectroscopic probe system that capable to analyze insulating oil in power transformer by using visible to near infrared range. Bouaichal et al. [21] also employed FTIR spectroscopy to investigate the influence of relative amount of cellulosic materials on aged mineral oil products.
Instead of using vibrational spectroscopy method (IR to NIR), Arshad et al. [22] proposed UV-Spectrophotometry technique for oil contamination level detection as an alternative with an existing oil conductivity assessment. Abu Siada et al. [4, 10, 23-25] introduced a new application of Ultraviolet-Visible spectroscopy (UV-Vis) to estimate furan concentration in transformer oil. In this technique, the
absorbance effects of various furan concentrations are observed and the correlation between absorbance level and furan concentration is formed [26]. According to Workman [27], majority of organic compounds are transparent in the UV-Vis spectra, and their absorbance in this region give a significant information towards quantitative analysis or compounds identification.
3. UV-Vis Spectral Response
UV-Vis spectroscopy is used to investigate contaminations in the transformer oil by using light absorbing properties of a sample [28]. Light transmitted is being absorbed due to various contaminations in the oil sample, and can be calculated as:
UV-Vis spectroscopy experimental set up for measuring the spectral response of transformer oil is demonstrated in Fig.1. A beam is transmitted from light source to the oil sample in the cuvette via input fiber. Then, the light interacts with the sample, and the passing light is carried by output fiber to the spectrometer, which is connected with the computer to display the results.
According to Abu Siada et al., light absorbance method of UV-Vis spectral response is capable to distinguish various furan concentrations in transformer oil as shown in Fig. 2 [28]. Absorbance level and wavelength can be used as indicator for furan concentration in oil sample. However, there is possibility of dust or crumb of conducting material that might present in the oil sample taken from the in-service power transformer. Therefore, further test is essential to validate the reliability and accuracy of spectral response method. This paper is aimed to investigate the effect of conducting material in the oil sample on the light absorbance level and the wavelength.
Figure 2. UV-Vis spectral response for various furan concentrations [10]
4. Experimental Test
Series of tests were performed on in-service transformer oil collected from different types of power transformer with various furan concentrations using UV-Vis spectroscopy. The objective of this experiment is to study the effects of conducting material existed in transformer oil on the spectral response characteristics of transformer oil.
Transformer oil with specific furan concentration is scanned and analyzed by using UV-Vis Spectroscopy. About 2.1 gram weight of each oil sample is placed into a cuvette for scanning purpose. The absorbance level and the bandwidth of oil spectral response are recorded as references. Next, 10mg of copper powder is added and dissolved into each oil sample which were rescanned and analyzed, immediately after the stir process. The oil spectral response is observed and analyzed every 5 minutes for one hour. Previous steps are repeated with 20mg, 30mg, 40mg, 50mg, 60mg, 80mg and 100mg amount of conducting material dissolved in oil sample.
5. Results
An original oil sample with furan concentration of 1.75 ppm without any additional conducting material shows that the absorbance wavelength is 477.83nm with a maximum absorbance level less than 2 as shown in Fig. 3. When an amount of conducting material is added to the oil sample, the instantaneous spectral response shows an increase in both wave length and maximum absorbance. As shown in Fig. 4 (a), the increment in both parameters is proportional with the amount of conducting material added to the oil sample. Fig. 4(a) shows that the maximum absorbance level exceeds 2.5 after 100mg of copper powder are added into the oil sample.
Figure 3. UV-Vis spectral response for 1.75ppm of furan concentration without additional conducting material.
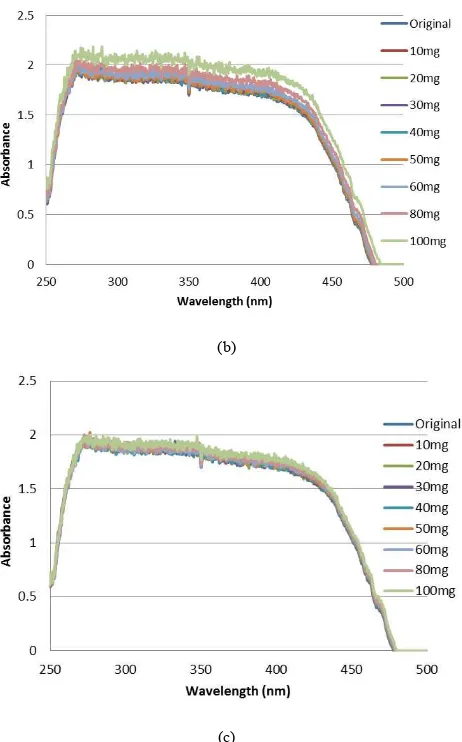
After 5 minutes of adding the copper powder to the oil sample, the wave length and maximum absorbance for all oil samples are significantly reduced, and become close to the original oil sample without additional conducting material as shown in Fig 4(b). Five minutes later, spectral response for all samples almost coincides with the spectral response of the original oil sample result as shown in Fig 4(c). Fig. 5 that shows a zoomed area of Fig. 4(c) reveals that the wavelength is slightly increased due to the present of conducting materials within transformer oil sample.
(b)
(c)
Figure 4. UV-Vis spectral response with additional conducting material for a) instantaneous effects (b) after 5 minutes, and (c) after 10 minutes.
Fig. 6 shows the relationships between the amount of conducting material within the oil sample and the amount of light absorbance at a wavelength of 477.83 nm (where absorbance level drops to zero for original oil sample without additional conducting material). Results in Fig. 6 show a linear correlation between the absorbance level and the amount of conducting material in the oil sample regardless the time that the characteristic was measured at. It is also noticed that the slope of linear correlation is reduced with the increase of time delay as shown in Fig. 6. The correlation between wavelength and the amount of conducting material dissolved in oil sample is shown in Fig. 7 which reveals that, the bandwidth is not affected by the additional conducting material less than 30mg (which equivalent to 1.25% of the weight of oil sample). However, beyond this amount, the wavelength is significantly increased when the characteristic is immediately measured after the addition of the conducting material. When the absorbance characteristic is measured after 5 or 10 minutes, the increment in the wavelength is trivial as shown in Fig. 7. This is attributed to the fact that conducting material is settled down at the bottom of the cuvette within 5 minutes and its impact on the spectral response will be negligible.
Figure 5. Spectral bandwidth expansion with the increments of additional conducting material after 10 minutes.
Figure 6. Correlation between absorbance level and amount of conducting material in the oil sample at wavelength 477.83nm.
Figure 7. Variation of wavelength when absorbance level “zero” for additional conducting material in oil sample.
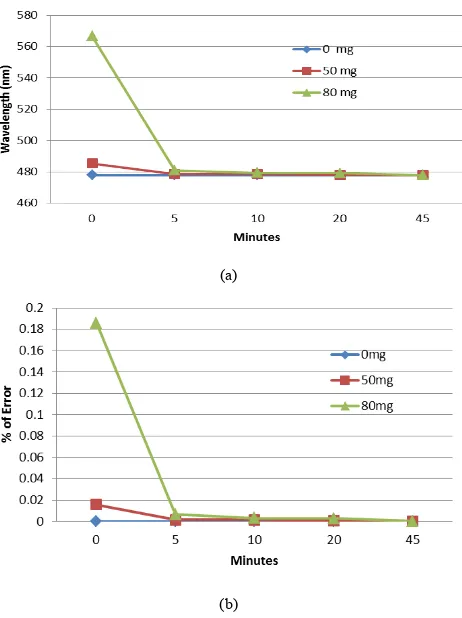
Theoretically, the conducting material will settle down at the bottom of the oil sample after a while, hence the spectral response is expected to be similar to the characteristic of oil sample without any additional conducting material inside. To prove this, the absorbance characteristic is measured for oil sample containing 50 mg and 80 mg of copper powder at five time intervals (0, 5, 10, 20 and 45 minutes). The change in wavelength is monitored and analyzed.
Spectroscopy method is not affected by the dust or conducting materials present in the transformer oil samples.
(a)
(b)
Figure 8. Relationship between (a) wavelength, and (b) percentage of bandwidth error, with time for original oil sample and additional conducting material.
7. Conclusion
The absorbance wavelength for oil sample with furan concentration of 1.75ppm is 477.83nm, while the maximum absorbance is less than 2. Experimental results show that conducting material present in transformer oil samples may affect the spectral response of the oil sample if the response is measured straight away after collecting the sample from in-service transformer. However, if the spectral characteristic is measured in about 5 minutes after collecting oil sample, the impact of the conducting material on the spectral response is less than 0.01%, and is negligible after 10 minutes. As this technique is so far offline, it is expected that the test will not be conducted instantly and hence the measured spectral response for the collected transformer oil sample is unaffected by any conducting or solid substances that may preset in the transformer oil.
Acknowledgements
This research is supported by the Faculty of Science and Enginering, Curtin University, and the Coperative Research Centre for Infrastructure and Engineering Asset
Management (CIEAM), Australia. The authors would like to acknowlwdge Western Power for providing transformwer oil sampels for this experiment, and to UTeM Malaysia for their financial support.
REFERENCES
[1] A. E. B. Abu-Elanien and M. M. A. Salama, "Survey on the Transformer Condition Monitoring," in Power Engineering, 2007 Large Engineering Systems Conference on, 2007, pp. 187-191.
[2] D. J. Woodcock and J. C. Wright, "Power transformer design enhancements made to increase operational life," in Sixty-Sixth Annual International Conference of Doble Clients, 1999.
[3] Y. Shirasaka, H. Murase, S. Okabe, and H. Okubo, "Cross-sectional comparison of insulation degradation mechanisms and lifetime evaluation of power transmission equipment," Dielectrics and Electrical Insulation, IEEE Transactions on, vol. 16, pp. 560-573, 2009.
[4] A. Abu-Siada, P. Lai Sin, and S. Islam, "Remnant life estimation of power transformer using oil UV-Vis spectral response," in Power Systems Conference and Exposition, 2009. PSCE '09. IEEE/PES, 2009, pp. 1-5.
[5] T. K. Saha and P. Purkait, "Understanding the impacts of moisture and thermal ageing on transformer's insulation by dielectric response and molecular weight measurements," Dielectrics and Electrical Insulation, IEEE Transactions on, vol. 15, pp. 568-582, 2008.
[6] L. Rui-jin, T. Chao, Y. Li-jun, and S. Grzybowski, "Thermal aging micro-scale analysis of power transformer pressboard," Dielectrics and Electrical Insulation, IEEE Transactions on, vol. 15, pp. 1281-1287, 2008.
[7] A. de Pablo, "Furfural and ageing: how are they related," in Insulating Liquids (Ref. No. 1999/119), IEE Colloquium on, 1999, pp. 5/1-5/4.
[8] H.-X. Wang, Q.-P. Yang, and Q.-M. Zheng, "Artificial neural network for transformer insulation aging diagnosis," in Electric Utility Deregulation and Restructuring and Power Technologies, 2008. DRPT 2008. Third International Conference on, 2008, pp. 2233-2238.
[9] ASTM, "Standard Test Method for Furanic Compounds in Electrical Insulating Liquids by High-Performance Liquid Chromatography (HPLC)," ASTM D5837-12, 2012.
[10] A. Abu-Siada, S. P. Lai, and S. M. Islam, "A Novel Fuzzy-Logic Approach for Furan Estimation in Transformer Oil," Power Delivery, IEEE Transactions on, vol. 27, pp. 469-474, 2012.
[11] H. Kaur, Spectroscopy. Meerut, IND: Global Media, 2009. [12] M. J. Shenton, H. Herman, R. J. Heywood, and G. C.
346-351.
[13] J. P. Percherancier and P. J. Vuarchex, "Fourier transform infrared (FT-IR) spectrometry to detect additives and contaminants in insulating oils," Electrical Insulation Magazine, IEEE, vol. 14, pp. 23-29, 1998.
[14] O. Koreh, K. Torkos, M. Bashir Mahara, J. Boressay, and V. Izvekov, "Study of water clusters in insulating oils by Fourier transform infrared spectroscopy," Dielectrics and Electrical Insulation, IEEE Transactions on, vol. 5, pp. 896-902, 1998.
[15] M. M. Hamada, M. A. A. Wahab, A. G. Zeitoun, and G. Ismail, "Infrared spectroscopy and ferrographic analysis of deposits in oil," in High Voltage Engineering, 1999. Eleventh International Symposium on (Conf. Publ. No. 467), 1999, pp. 356-359 vol.3.
[16] M. Ali, A. M. Emsley, H. Herman, and R. J. Heywood, "Spectroscopic studies of the ageing of cellulosic paper," Polymer, vol. 42, pp. 2893-2900, 2001.
[17] Y. Liu, "Vibrational spectroscopic investigation of Australian cotton cellulose fibres: Part 1. A Fourier transform Raman study," Analyst, vol. 123, pp. 633-636, 1998.
[18] H. H. Patrick J. Baird, Gary C. Stevens, "On-Site Analysis of Transformer Paper Insulation Using Portable Spectroscopy for Chemometric Prediction of Aged Condition," IEEE Transactions on Dielectrics and Electrical Insulation, vol. 15, p. 1089, 2008.
[19] P. J. Baird, H. Herman, G. C. Stevens, and P. N. Jarman, "Spectroscopic measurement and analysis of water and oil in transformer insulating paper," Dielectrics and Electrical Insulation, IEEE Transactions on, vol. 13, pp. 293-308,
2006.
[20] P. J. S. Baird, H. Herman, and G. C. Stevens, "Non-destructive and in-situ analysis of insulating materials in high-voltage power transformers," in Solid Dielectrics, 2004. ICSD 2004. Proceedings of the 2004 IEEE International Conference on, 2004, pp. 719-722 Vol.2. [21] A. Bouaïchal, I. Fofana, and M. Farzaneh, "Influence of the
relative amount of paper on aged mineral oil decay products," 2008, pp. 91-94.
[22] M. Arshad and S. M. Islam, "Power transformer condition assessment using oil UV - spectrophotometry," in Electrical Insulation and Dielectric Phenomena, 2007. CEIDP 2007. Annual Report - Conference on, 2007, pp. 611-614.
[23] A. Abu Siada, "A Novel Fuzzy-Logic Approach for Furan Estimation in Transformer Oil," IEEE Transactions on Power Delivery, vol. 27, p. 469, 2012.
[24] A. Abu-Siada, "Correlation of furan concentration and spectral response of transformer oil-using expert systems," Science, Measurement & Technology, IET, vol. 5, pp. 183-188, 2011.
[25] A. A.-S. Narottam Das, Syed Islam,, "New Approach to Estimate Furan Contents in Transformer Oil Using Spectroscopic Analysis."
[26] S. P. Lai, A. Abu-Siada, S. M. Islam, and G. Lenco, "Correlation between UV-Vis spectral response and furan measurement of transformer oil," in Condition Monitoring and Diagnosis, 2008. CMD 2008. International Conference on, 2008, pp. 659-662.
![Figure 1. Lab set up for measuring the spectral response of transformer oil [10]](https://thumb-ap.123doks.com/thumbv2/123dok/531812.61555/2.595.135.476.588.741/figure-lab-set-measuring-spectral-response-transformer-oil.webp)
![Figure 2. UV-Vis spectral response for various furan concentrations [10]](https://thumb-ap.123doks.com/thumbv2/123dok/531812.61555/3.595.141.477.77.284/figure-uv-vis-spectral-response-various-furan-concentrations.webp)