Mathematical and Computer Modelling 44 (2006) 535–552
www.elsevier.com/locate/mcm
Simulating forest plantation co-management with
a multi-agent system
Herry Purnomo
a,b,∗, Philippe Guizol
caCIFOR, Center for International Forestry Research, Bogor, Indonesia
bDepartment of Forest Management, Faculty of Forestry, Bogor Agricultural University, Bogor, Indonesia cCIRAD, Centre de coop´eration Internationale en recherche agronomique pour le d´eveloppement, Bogor, Indonesia
Received 6 December 2004; accepted 11 February 2005
Abstract
Co-management of forest resources is a process of governance that enables all relevant stakeholders to participate in the decision-making processes. Illegal logging and forest degradation are currently increasing, and logging bans are ineffective in reducing forest degradation. At the same time interest in forest plantations and concern about poverty problems of neighboring people whose livelihoods depend on forest services and products continue to increase rapidly. Governments have identified the development of small forest plantations as an opportunity to provide wood supplies to forest industries and to reduce poverty. However, the development of small plantations is very slow due to an imbalance of power and suspicion between communities and large companies. This paper proposes a framework for linking social, economic and biophysical dynamics to create multi-agent simulations and explore scenarios of collaboration for plantations. Multi-agent simulation is a branch of artificial intelligence that offers a promising approach to dealing with multi-stakeholder management systems, such as common pool resources. It provides a framework which allows analysis of stakeholders’ (or agents’) interactions and decision making. Each stakeholder has explicit communication capacities, behaviors and rationales from which emerge specific actions. The purpose of this modeling is to create a common dynamic representation to facilitate negotiations for growing trees. A system of governance involving multi-stakeholders, especially local communities and wood based industries appearing to offer the most promising pathway to accelerating plantation development, local community poverty alleviation and forest landscape improvement.
c
2005 Elsevier Ltd. All rights reserved.
Keywords:Governances; Forest plantation; Multi-agent; Simulation; Stakeholder
1. Introduction
Principle 22 of the 1992 Rio Declaration on Environment and Development highlights the importance of local people and their participation in sustainable development. In forest plantations, this applies to local communities living in or near forest plantations.
∗Corresponding author. Fax: +62 251 622 100.
E-mail addresses:[email protected](H. Purnomo),[email protected](P. Guizol). 0895-7177/$ - see front matter c2005 Elsevier Ltd. All rights reserved.
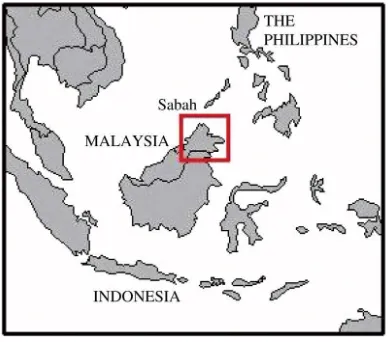
Fig. 1. Sabah location map.
1.1. Site description
Malaysia is situated right in the heart of South East Asia and is divided into two geographical sections: Peninsular Malaysia and the East Malaysian states of Sabah and Sarawak in North Borneo. Sabah lies between 5◦and 7◦north of the equator. Sabah is bordered by Sarawak on its south-western side, and Kalimantan (Indonesian Borneo) to the south. Sabah has a coastline of approximately 800–900 miles of the South China Sea in the west and north, the Sulu Sea in the northeast and the Celebes Sea in the east.Fig. 1shows a map of Sabah.
Sabah is settled by Malay and Mongoloid peoples. The largest indigenous group in Sabah is the Kadazandusun group, followed by the Bajau and Muruts groups. Another big group is the Chinese. The Chinese have intermarried with the local population, mainly with the Kadazandusun group. Centuries of migration, mixed marriages, pirate raids, isolation and trade have produced a profusion of ethnic groups that defy simple classification. There are at least 30 distinct ethnic/linguistic indigenous groups in Sabah, speaking different languages and close to 100 dialects. Sabah is a melting pot of many indigenous and immigrant groups.
1.2. The stakeholders
The Sabah Forestry Development Authority (SAFODA) was established when Enactment No. 20 of 1976 was passed by the Sabah Legislative Assembly. This enactment was replaced by Enactment No. 24 of 1981 to make better provisions with respect to the constitution, administrative procedures, functions and finance of SAFODA. Its mission is to develop highly productive forest plantations for long-term supply of wood resources and the improvement of the socio-economic status of the state and country on a sustainable basis [1].
Currently SAFODA manages about 100,000 ha of land in Sabah located mostly in the Bengkoka, Marudu and Keningau districts. The forest area amounts to 31,000 ha. The planted species areAcacia mangium(28,000 ha) and rattan (2100 ha). SAFODA and Sabah Forest Industries (SFI) encourage small landowners, adjacent to their forest plantation areas, to grow trees. Currently these smallholder plantations amount to 3000 ha and 1900 ha, respectively, supervised by SAFODA and SFI.
The Sabah forest plantation stakeholders believe that many opportunities are met for smallholder forest plantation development. A lot of logged land is available for plantation. The Sabah natives have the opportunity to obtain security over land and the rural people have the will to invest in forest plantations (to secure their ownership of land, to rehabilitate the landscape, to rehabilitate wildlife resources for hunting, and to invest for themselves and the coming generations).
1.3. Problems
H. Purnomo, P. Guizol / Mathematical and Computer Modelling 44 (2006) 535–552 537
of plantation forests and downstream industries that use plantation wood. On the one hand, investors will consider investments in downstream industries for plantation wood if mature plantations are available. They might also defer such investments as long as faster returns from natural forest logging exist. On the other hand, smallholders will not invest in plantations as long as they lack the guarantee of better prices. Currently SAFODA have to export, at low price, fast growing wood produced on their own plantations, as the existing paper mill in Sabah (Sabah Forest Industries) is too far away from SAFODA plantations.
Sabah State has already invested a lot in smallholders’ plantations and SAFODA Estates. However, this development is in crisis, as SAFODA is facing problems in self-financing its development in the current context of low wood prices. It looks like more coordination is needed between the Sabah policy of plantation and smallholder development and wood processing development.
The local government perceives the development of forest plantations in this part of Sabah as a means to improve the landscape. Today most of the land which has been logged and is unused is highly fire prone (many areas are covered withImperata cylindrica, and large stocks of remaining dead wood). The development of smallholder plantations, backed by different small-scale wood processing industries (sawmills), could produce a variety of plantation systems. These plantations will reduce the areas’ proneness to fire and would involve the local population in fire control. This research explores such scenarios of co-development of smallholder plantations and wood processing industries.
1.4. Research purpose
The goal of the model developed in this research is to explore scenarios for improving land use and incomes of different stakeholders, at a regional level. This paper observes sustainable forest plantations under a multi-stakeholder or multi-actor context, where actions and reactions of each stakeholder are examined in conjunction with the behaviors of other stakeholders. Hence, the purpose of this paper is to describe a multi-agent simulation of a multi-stakeholder forest plantation.
This research used CORMAS (Common Pool Resources and Multi-Agent System), a multi-agent simulation platform specifically designed for renewable resource management systems. It provides a framework for developing simulation models of the interactions between individuals and groups that jointly exploit common resources. CORMAS facilitates the construction of a model by offering predefined elements, which the user can customize to a wide range of specific applications [2].
2. Multi-agent systems and natural resource governance
Policy makers should be able to assess the very long term impacts of their decisions, such as the establishment of plantations or wood processing industries. Some major impacts might occur beyond the normal periods of monitoring. Simulation is one way to address this question, and may be the only viable alternative if the system is large or complex. “Simulation” means making a simplified representation of a real-world situation, and animating it so that stakeholders might envision what the future situation might be. Multi-agent simulation (MAS) is a promising way to examine natural resource and environmental management issues [3]. The hallmark of MAS is the recognition of “agents”, which are entities with defined goals, actions, and domain knowledge. Agents operate and exist in an environment. The environment might be open or closed, and it might or might not contain other agents. If it contains other agents, it can be seen as a society of agents or MAS.
Simulating the stakeholders’ activities and interactions requires a tool that is able to represent the individual’s knowledge, beliefs, communication and behavior. MAS has been applied to the modeling of natural resource management. One of the first applications was to a common property management regime that is frequent among developing nations, particularly with agriculture and forest-related resources. In this context, much of the initial development and application of MAS was done by Bousquet [4]. Several authors have since applied MAS to a number of cases and studies: irrigation systems [5], resource sharing regimes [6], natural resource management [7], game management [8], economic and social development [9], and environmental management [3,10].
and regulations [12]. Governance is the process by which individuals, and institutions, public and private, manage their common concerns in an increasingly complex world [13,14].
Governance issues encompass global–local links, sector–sector links, and values’ divergences. Policy and legal and institutional conditions affecting forests derive from the local level (e.g. community rules and social norms regarding forest use), the national level (e.g. legal rights to forest land and resources, and policies affecting the relative profitability of different forest uses), and the global level (e.g. multilateral environmental agreements affecting forests, trade rules, and the policies of multinational companies and investors) [15]. Good governance is characterized by participation, transparency, accountability, rule of law, effectiveness, and equity in both decision-making processes and their outcomes. Co-management of forest plantation is a form of good forest governance. Co-management is ‘a situation in which two or more social actors negotiate, define and guarantee amongst themselves a fair sharing of the management functions, entitlements and responsibilities for a given territory, area or set of natural resources’[14].
3. The simulation
3.1. Methods
Stakeholders were identified according to the following criteria: proximity to the forest, legal or traditional rights over the forest, dependency on the forest, and knowledge of forest management [16]. Stakeholder characteristics were recognized through field visits and group discussions [17]. Researchers facilitated the discussions to establish stakeholder identities, their rationale, and their behavior and actions. These characteristics formed the basis for the MAS model developed subsequently. Other data were obtained from SAFODA and related literature.
There are four key phases in the development of a model [18]: i.e. (a)Forming a conceptual modelis to state the model’s objectives, bound the system of interest, categorize its components, identify relationships, and to describe the expected patterns of the model‘s behavior; (b) Specifying the model is to identify the functional forms of the model’s equations, estimate the parameters, and to represent it in CORMAS; (c)Evaluating the modelis to re-assess the logic underpinning the model, and compare model predictions with expectations; (d)Using the modelis to develop scenarios.
3.2. Model development and results
At the current stage we emphasize the development of a general model of multi-stakeholder forest plantation. We used a spatial plantation situation that commonly occurs in the world of forest plantations. Thus, the model is more a general model rather than a site-specific model.
3.2.1. Forming a conceptual model
The agent’s ability to communicate is critical. An agent might engage in economic behavior. To model this specific behavior, we use the added-value chain theory. Agents in the model anticipate the outcome of their decisions during the decision process. They evaluate this outcome against their goals.
The value chain is a short-lived alliance among a variety of stakeholders to produce goods from forests. This concept allows us to integrate different decision levels and forces us to describe the communication patterns among stakeholders and the perceptions and goals that govern each stakeholder’s behavior. Usually, the value chain is reduced to the supply chain perspective of an industry, which tries to secure its supplies. Here, we look at it in another way, from the forest; the value chain concept helps to anticipate, before harvest, the use of the wood and benefits that wood products will produce, what stakeholders in the forestry sector are doing, consciously or intuitively, in the real world. This system of alliances is the result of negotiation among stakeholders who try to reach their own goals by communicating with other stakeholders. It is a snap alliance, as it can change over time according to stakeholders’ changing perceptions of the environment and relationships. This allows us to represent the interaction between forest dynamics and social issues, as it links these changing alliances directly to the rate of harvesting, which affects the forest dynamics.
H. Purnomo, P. Guizol / Mathematical and Computer Modelling 44 (2006) 535–552 539
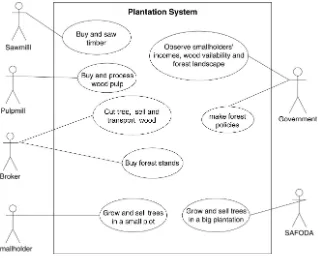
Fig. 2. The unified modelling language use case diagram of the plantation system.
The price breakdown structure of standing wood, while analyzed at each forest-plot level of a map, shows in many cases some difference according to the forest-plot location. This bridges economic issues to spatial structure. Negotiations take place on each patch of the map, revealing links between economics and space.
3.2.2. Identifying stakeholders
The stakeholders identified, based on the criteria mentioned previously, are SAFODA, smallholders, brokers (for pulp and sawmill), and the government.Fig. 2describes the use case diagram of the stakeholders. The diagram shows the major role of the stakeholders in the plantation system. SAFODA and the smallholders grow Acacia in their plantations. They then negotiate with a buyer to sell their timber. The brokers sell the wood to mills. The government observes the impacts of stakeholder interactions on the incomes of smallholders, wood availability and landscape.
Table 1describes the goals and strategies of the above stakeholders. As SAFODA is currently facing financial problems, improving income by attempting to reduce its costs and to increase its returns is its current goal.
The smallholders are trying to improve their well-being. They currently hold small plantations for pulp and sawn timber. They behave with economic rationality regarding their plantations. We did not find any significant non-economic values associated with their plantations. Since the beginning they have perceived plantations as a way to improve their incomes. They actively search for a better price for their existing wood stock. If the wood price is high enough, they will expand their plantations for pulp or timber depending on the profit margin they can make. If their wood pulp plantations are not commercially viable, they will convert them to timber wood plantations if this is commercially feasible. If the timber plantations are not feasible to plant then they will convert them to other uses or will just leave them unmanaged. This means decreasing the forest coverage and wood supply.
Wood brokers also behave with economic rationality. They will buy wood from SAFODA and the smallholders if they can draw profits from it. The brokers carry out logging and take care of the transportation costs. Their profit margin is about 20%. The brokers calculate the costs of logging and transportation based on the distance of the plantations to the harbor or sawmill and on the quality of the road network.
Table 1
The selected stakeholders, their goals and strategies
Stakeholder Goal Strategy
SAFODA To improve its returns To reduce its costs and to increase its revenue.
Smallholders To improve their well-being To expand their plantations for pulp or timber if the wood price is high enough. To convert their wood pulp plantations to timber wood plantation or other uses if these wood pulp plantations are not commercially viable.
Buyers To improve their profits To mediate wood producers and consumers for obtaining their profit margin of 20% or more. They take care of logging and transportation costs. The buyers take into account the mill location to calculate the log price.
Government To achieve forest sustainability To formulate and execute policies and regulations in order to have more smallholders, more wood resources and forested landscape.
Sawmill To be supplied with wood for sawn timber To inform the wood producers about the sawn wood price.
Harbor/pulp mill To be supplied with cheap pulp wood To inform the wood producers about pulp wood price.
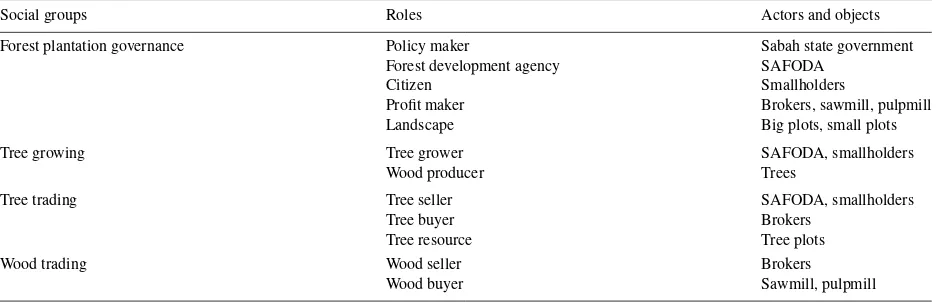
Table 2
Social groups, roles and agents in the model
Social groups Roles Actors and objects
Forest plantation governance Policy maker Sabah state government
Forest development agency SAFODA
Citizen Smallholders
Profit maker Brokers, sawmill, pulpmill
Landscape Big plots, small plots
Tree growing Tree grower SAFODA, smallholders
Wood producer Trees
Tree trading Tree seller SAFODA, smallholders
Tree buyer Brokers
Tree resource Tree plots
Wood trading Wood seller Brokers
Wood buyer Sawmill, pulpmill
Currently the wood for pulp is transported to the harbor for export. There is no sawmill or pulpmill that is near the areas of plantation. In the model we created virtual stakeholders, i.e. sawmills and pulpmills, to generate possible future scenarios.
3.2.3. Specifying the model
To increase the modularity of the model we used organization centered MAS (OCMAS) instead of agent centered MAS (ACMAS) to construct the model. OCMAS separates organization description from agent description. The organization provides a framework for activity and interaction through the definition of roles, behavioral expectation and authority relationships, such as control. We view an organization as a collection of roles, which stand in certain relationships to one another, and take part in systematic institutionalized patterns of interactions with other roles. An individual agent may play multiple roles depending on the social groups in which it is participating. An agent may be a member of several social groups. Two agents can interact and communicate only if they are members of the same social group [19].
H. Purnomo, P. Guizol / Mathematical and Computer Modelling 44 (2006) 535–552 541
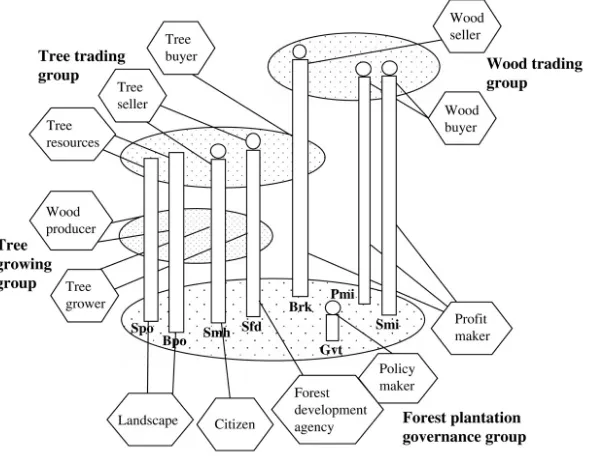
Fig. 3. The organization level of the forest plantation model.
The Sabah state government takes the role ofpolicy makerin developing regulations to accelerate the development of the plantation, to improve the livelihood of their citizens and to rehabilitate the landscape. The role of theforest developmentagency is played by a state-owned company, namely SAFODA, which performs a major role in executing the government’s policy while maintaining its own financial sustainability. The smallholders, who are usually not rich and live in the countryside of Sabah, play the role ofcitizenorinhabitant.
The smallholders and SAFODA play roles oftree grower andtree seller as they grow Acacia and sell it. The brokers buy wood from thetree growerand sell it to thewood buyers; they play the roles oftree buyerandwood seller. Pulpmills and sawmills play the role ofwood buyer, and process the wood in their factories. The mills are the end consumers of the trees in the simulation.
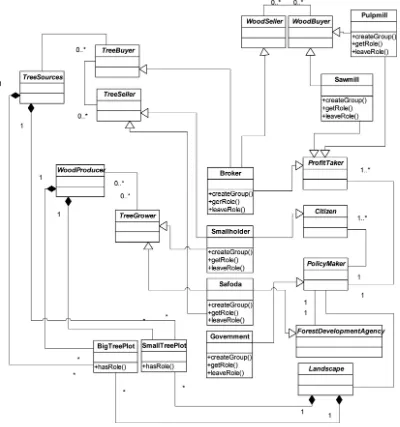
The organization level of the model can be represented by a class diagram. The class diagram shows the static structure of the model, with the elements that exist (such as classes and types), the internal structure of the elements, and their relationships to one another. The unified modeling language (UML) class diagram of the model (Fig. 4) represents classes connected by static relationships which are aggregation/composition (a line connecting two classes with a diamond symbol), generalization/specification (a line connecting two classes with an arrow symbol) and association (a line connecting two classes and showing its cardinality or multiplicity). A class is represented as a box with three parts: class name, class attribute(s) and class method(s). A class name in italics means an abstract class. An abstract class is a class that cannot be instantiated1into agents or objects. It exists only to allow subclasses to inherit its attributes, methods and associations.
We treat the relation between an agent and its role(s) like a ‘generalization link’ between a class and an abstract class. For example, inFig. 4, smallholders and SAFODA are classes that can be instantiated and inherit all properties of the abstract class of tree grower and tree seller. If an agent is assigned a certain role, it will have all properties within that role. An agent can take on or abandon roles during the simulation. An agent may also create a social group where several agents with various roles interact. Therefore, every instantiated class has at least three possible actions, which are:createGroup,getRoleandleaveRole.
Fig. 4. The unified modelling language class diagram of the model.
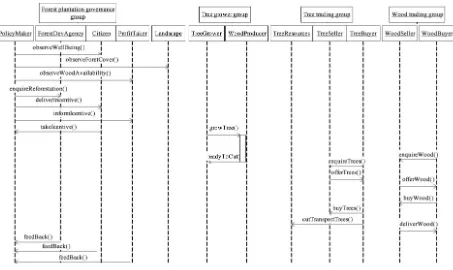
If a class diagram represents the static structure of the model, a sequence diagram represents the dynamic interaction of the model. The sequence diagram shows the actors or objects participating in an interaction and the events they generate arranged in a time sequence. It describes the flow of information of a single possible scenario. Instead of actors or objects we use roles of agents or objects to illustrate the interactions of participants in a possible scenario, as a sequence diagram of UML (Fig. 5).
To improve the conditions of thecitizen,landscapeandprofit maker, thepolicy makercreates incentives to grow trees for theircitizen. The incentive is distributing 15–30 hectares of the state land to those who grow trees. Thepolicy makeralso encourages theforest development agencyto establish tree plantations.
H. Purnomo, P. Guizol / Mathematical and Computer Modelling 44 (2006) 535–552 543
Fig. 5. The unified modelling language sequence diagram of the model.
signed by both parties. Then thetree buyersends a message to thetree sellerto buy and harvest the trees. Thewood sellerdelivers the wood to thewood buyer.
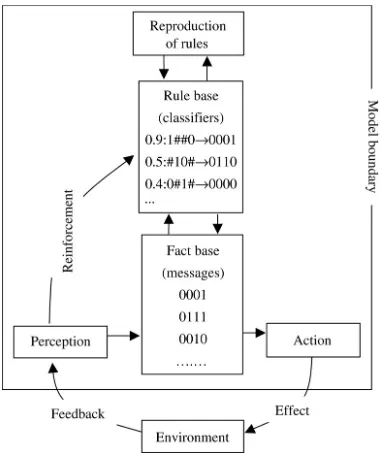
The internal agent’s reasoning and learning, through its role(s), is represented using simplified classifiers of the genetic algorithm architecture as illustrated inFig. 6. It is a rule based system that is able to learn by adjusting rule strength from environmental feedback and by discovering better rules using genetic algorithms [20]. The genetic algorithm reproduces the rules for its survival and its improved performance in the society of agents.
Inputs of information from the environment are perceived by an agent asperceptions.Perceptionsare coded into a binary format of a certain number of digits in thefact base. The Rule base will work to transform the perception codes into action codes. The action codes are decoded into actions in thefact base. The agent’s actions will take place to influence the environment. These consecutive steps happen in the absence of any learning processes. Theperceptions
can reinforce the strength of each rule in therule base. The rule strength represents the priority of the rules to be used to transform the perceptions into actions. A rule that produces benefit feedback will strengthen, a rule that produces a drawback will weaken, and a rule that produces trivial feedback will remain at the same strength.
Genetic algorithm based rule reproduction is guided by the genetic-like principle that rules that increase an agent’s fitness in its societies will continue to exist in the next period; otherwise they will not. Some rules randomly continue or discontinue existence regardless of their strength in the next period. Rules that are never used and weaken all the time are subject to disappearance in the next period. For each time period the previous rules are inherited with adaptation based on the fitness of the rules for surviving in the society.
Fig. 6. The internal agent architecture of the model.
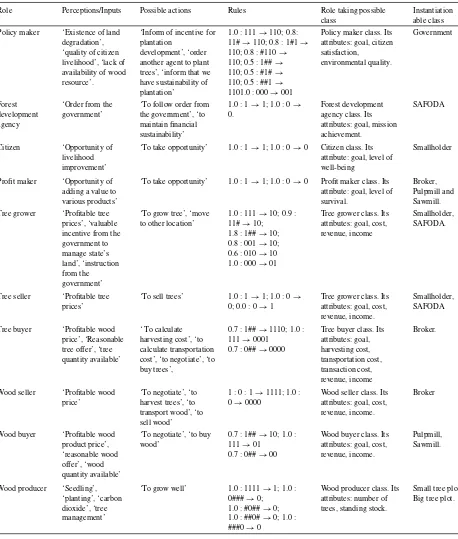
The reinforcement process is formulated as strengthening or weakening the rules by 0.1.Table 3shows the way an agent, in its role, reasons and learns. We have only provided brief descriptions of them, to keep them easy to follow. All roles of actors have the same reinforcement rule.
Table 4shows the dynamics of pulpwood growth volume, which is used in the simulation; it is obtained from different sources. At 10 years mean annual increment growth it is 14 m3/ha. At 11 and 12 years the annual volume
is 15 m3/ha, and there is no volume increment afterward. In the simulation the growth of smallholder and SAFODA
pulp plantations is the same.
For the initial conditions, a simulated map represents the forest landscape, including explicit locations of roads, vegetation and forest management plots. Each pixel represents an area of 25 ha.Fig. 7shows a virtual map of the forest landscape where agents of SAFODA, smallholders and the pulp mill are located. Small triangles represent smallholders. Large plots marked 1 are SAFODA forest management plots. The different gray values relate to the plot wood stock, while black illustrates that the plot is ready to be cut. The black areas at the bottom of the map represent the sea (5) and the harbor (7) from which wood is exported. In the top right, the large area marked (5) is the pristine forest. The white areas represent land devoted to agriculture, to which access for forest development is forbidden. The Y shaped lines are roads, with different gray shades relating to road qualities and subsequently to different transportation costs.
Objects and agents instantiate most classes of the model. For example, the pulp plantation object instantiates the
big tree plotclass, whereas pulp and sawn timber plantation objects instantiate thesmall tree plotclass. These classes compose the abstract classes oflandscape,wood producerandtree sources. The objects take the roles landscape, wood producer and tree sources.
The broker that takes the role of tree buyer computes transportation costs, which are linked to the distance between the plots and mills, by considering the existence of the roads and their quality. The transportation cost becomes an attribute of each cell. If there is a road then the transportation cost is lower than if there is no road. Similarly, the better the road quality, the lower the transportation cost. The algorithm seeks the path where the transportation cost is the lowest. This is done by looking at the transportation cost that is represented in eight cells surrounding the cell where the wood is located. If these eight cells have exactly the same transportation cost attribute, then the algorithm looks at the cells surrounding those eight cells, and so forth. The different distances, between plots, to the road network and to the mills, will create different production costs.
H. Purnomo, P. Guizol / Mathematical and Computer Modelling 44 (2006) 535–552 545
Table 3
The internal reasoning of the agents
Role Perceptions/Inputs Possible actions Rules Role taking possible class
Table 4
Wood growth for pulpwood plantations
Year 1 2 3 4 5 6 7 8 9 10 11 12 13
Volume (m3/ha) 0 5 15 25 35 50 70 100 120 140 155 170 170
Annual volume increment –a 5 10 10 10 15 20 30 20 20 15 15 0
aNo increment for the first year. The increment is the difference between two subsequent years after planting.
Fig. 7. Representation of forest landscape. Small triangles represent smallholders located in their forest plots at the beginning.
The present model was evaluated using two criteria: the logic of the model and its outcomes, and the similarity between predictions and expectations. The model passed these criteria. The assessment that the model was reasonable was based on systematic checking of all the relationships within the model, from the simplest sub-model (forest plantation growth), to the more complex sub-models (e.g. the agents’ communications). Finally, overall model performance was assessed. This assessment led to the conclusion that the model complied with the patterns we expected a priori. The model has been found to be useful, particularly for developing scenarios and observing the likely impacts of each scenario on the forest landscape and on the incomes of smallholders.
3.2.5. Learning from the model
This section examines some of the insights gained from the process of constructing the model and examining its outputs. Simulation outputs from the model are also used to illustrate that the development of a sawmill leads to sustainable forest management through better added value chains of tree plantation.
In the current situation (the baseline simulation) the negotiations take place among the various agents, as described inFig. 8. Some smallholders interact, negotiate and sell their trees to the broker when their plots are ready to be cut and the broker wants to buy. The profit margins that the smallholders obtain from the deal will feed back into future actions. As a result planting the plot may not be a good choice any longer. If the margins are high enough then they will replant the plots. If the plots are not profitable they will abandon the existing plots for the next planting period. Some smallholders may learn that other smallholders who have pulp plots closer to the road are offered a higher price for their trees by the broker.
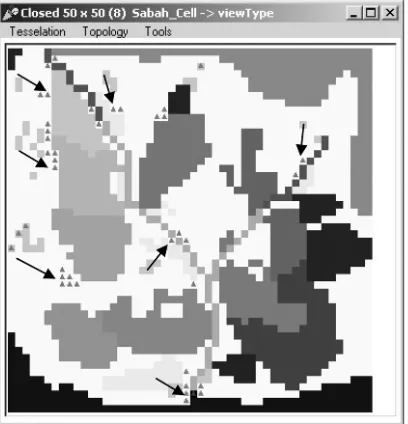
After 10 years, most smallholders move to the sites close to the road network to maximize their benefits in relation to transportation costs (Fig. 9). These sites are degraded forest owned by the government. They do not re-plant the existing pulp plantation. This means that the existing pulp plots are not sustainable. Fig. 10shows the resulting reduction, in the pulp plantation area, for the different generated random values.
H. Purnomo, P. Guizol / Mathematical and Computer Modelling 44 (2006) 535–552 547
Fig. 8. The interaction among agents. Small triangles numbered 1–40 represent the smallholders.
Fig. 9. Smallholders leave their plantations. They leave their plots as indicated by arrows, and look for new accessible plots closer to the main road.
Fig. 11. Decreasing the initial existing smallholder plantation area (number of simulation repetitions=10).
Fig. 12. Yearly dynamic of smallholder revenue (number of simulation repetitions=10).
knowledge is written on a “blackboard”. Each smallholder’s experiences with planting, in particular with regard to their knowledge of whether planting is profitable or not, are also written on the “blackboard”.Fig. 10shows the group’s collective knowledge during the simulation. This combination of feedback from his/her own experiences, the other smallholders and random values will reproduce the rule strengths that are then used for future action. In this experiment our objective was to examine behaviors after the first wood harvests; we did not explore how behaviors might change in the long term. This is how the simplified classifiers of the genetic algorithm work in the model. We use the term ‘simplified’ to express this limitation.
The plots tend to be unsustainable (Fig. 11) with some degree of variance. This will decrease the available wood for pulp and will not increase smallholder incomes. This disturbs the landscape because the logged area is not maintained or cared for. The average revenue received by the smallholder is illustrated inFig. 12. The smallholders are paid when their plantations reach maturity. Since the age of the plantation is random, they receive payment in the year they sell the plantation. They can expect to get a higher price if their plots are close to the road network, rather than away from the network. The pattern of this payment is random. The average payment is approximately RM 142.4, which is not enough to make them re-plant the plantation. They need to receive at least RM 200 before they will consider re-planting the plantation; otherwise they will leave/abandon these plots.
SAFODA continue to implement the plant–cut–replant strategy regardless of the feedback they obtain from the selling of trees. This strategy succeeds in maintaining the area of pulp plantation but the financial revenue is lower than they expect (Fig. 13).Table 5 illustrates an example of negotiation between SAFODA and the pulp broker. SAFODA cannot move to other sites like the smallholders. The feedback from the trading cannot weaken the rule of plant–cut–replant, unless the government agrees to do so.
H. Purnomo, P. Guizol / Mathematical and Computer Modelling 44 (2006) 535–552 549
Fig. 13. Yearly dynamic of SAFODA revenue (plant–cut–replant strategy).
Table 5
An example of the negotiation process between SAFODA and the broker of plot no. 10 (number of pixel is 109, the plot extent is 2725 ha)
Negotiation
16.7 2,340.7 58,516.7 987,267.0 1,312,500.0 87,500
21.0 31.1 Not agreed
0.0 2.0 50.0 889,500.0 1,732,500.0 231,000
Not agreed
Total 109 pixels 1,766,367.0 3,517,500.0 381,500
Note: Wood stock per ha for mature trees is 140 m3; Logging cost is 15 RM per m3; Price of wood pulp at harbor is 75 RM per m3.
We placed a sawmill in the area. The impact of this scenario after 10 years is illustrated inFig. 14. Under this scenario the smallholders convert most their wood pulp plots into sawn timber plantations. These sawn timber plots are commercially sustainable (Fig. 15) and give more income to the smallholders. The smallholders leave several plots which are far away from the road network. The sawmill establishment scenario results in a larger area of smallholder plantation than in the scenario where it does not exist (Fig. 11). This will produce greater forest cover in the landscape.
4. Discussion
Fig. 14. Impact of a sawmill establishment scenario. A is a sawmill, L example areas where the smallholders left, C example areas converted into sawn timber plots.
Fig. 15. The existing smallholder plantation area is quite stable (number of simulation repetitions=10).
case, MAS, through one of its tools, namely CORMAS, can be used to examine the long term impact of possible scenarios. The primary goal of modeling is not to give solutions but to learn about the situation.
Simulation experiments with the model showed that the present situation, where the smallholders mainly depend on the brokers and there is no sawmill, cannot sustain the existing plantations. SAFODA’s strategy of plant–cut–replant cannot produce its expected revenue. This situation is apparent in landscape, wood supply, and financial problems for smallholders and SAFODA. None of them are able to solve the problem by themselves in this value chain of wood products. To increase its revenue, SAFODA depends on the interaction with the government of Sabah State. The smallholders need to organize themselves or to widen their perspective on international markets of certified products in order to improve their welfare.
H. Purnomo, P. Guizol / Mathematical and Computer Modelling 44 (2006) 535–552 551
SAFODA may ask the government what its primary mission is. If the agency takes responsibility for self-financing, the government should allow the agency to implement different strategies to maintain its financial sustainability. This involves implementing a patch assessment strategy in order to plant, or not to plant, pulp or timber plantations. The government should inform the agency of this flexibility; otherwise the agency’s financial crisis will continue.
The stakeholders can interact to solve the global problems of decreasing plantation area, as well as wood pulp supply, the failure of an improvement in the smallholders’ welfare and the financial crisis of SAFODA. We use the term ‘global problems’ to distinguish them from local problems which include problems of individual stakeholders. The global problems emerge from the stakeholder interactions.
The way SAFODA behaves is primarily a result of the interaction between SAFODA and the government. This happens because SAFODA belongs to the government, and therefore SAFODA follows the government’s instructions. SAFODA implements the strategy of plant–cut–replant. The rule of implementing what the government orders is always stronger that other rules. The feedback of the interaction cannot make the other rules stronger than the government’s order. Therefore, the key to change is the government’s behavior. If the government gives SAFODA more flexibility to plant pulp plantations, then SAFODA may achieve better financial performance.
The government interacts with all the other agents. The government pays great attention to public interests, which are the global problems in this case. If the interactions can change the internal rules of the government in such a way that it is more adaptive to the situation then appropriate action may occur. Its rules can change through the reinforcement and reproduction rule mechanisms. Feedback from the citizens and companies plays a major role in making the government more adaptive.
Smallholders, who are taking the role of citizen, hope for a better price for their wood. Analysis of the value chains of the wood pulp reveals that there is no way to increase its price for the smallholders unless there is better price at the harbor for export. The smallholders need to interact with international markets, which are traditionally not connected with them. In the model we did not represent a social group of international trading, in which smallholders and importers from various countries such as China and Indonesia are members. Demand for pulp wood is rising in China due to the development of a giant pulp and paper industry. Asia pulp and paper, one of the largest pulp and paper industries in the world and located in Indonesia, also has an enormous demand for pulp wood.
Connecting the smallholders directly to international markets means shortening the value chains of wood pulp. The role of the brokers is always important. However, if the smallholders have a better perspective on their product market, it will enforce the distribution of the profits. This also applies to SAFODA. In our model, SAFODA receives a net revenue about million RM 1.8 while the pulp broker receives million RM 3.5. The broker receives about twice as much money as SAFODA does. Meanwhile, the smallholders’ net revenue is only several hundred RM.
As in the top-down scenario, sawmill establishment can increase the sustainability of the plantations. The smallholders, when taking the role of citizen, can suggest that government make the situation more conducive to private company investment in establishing a sawmill in the area. They can also form a cooperative to jointly establish a sawmill. Collective action by the smallholders can solve their problems. More interaction among them is necessary to have a collective plan and collective action.
The smallholders, in the role of citizen, can campaign for awareness of environmental problems. Illegal logging, which has spread all over the island of Borneo, has decreased the price of wood in general. The use of certified forest products is in the preliminary stages. Wood coming from the smallholders is certain to achieve easy certification because it is the result of a community based effort to plant trees. Reducing illegal logging and using certified forest products will increase the wood price, and will also increase the welfare of the smallholders.
The way the model is organized gives us an insight that can be used anywhere in the world for forest plantations like those in Indonesia. Thus, the model also acts as a general model from which a site-specific model can be derived through calibration and adaptation. At the micro-level we observe the interaction of agents with various roles. At the macro-level we observe the global problems that emerge from the stakeholders’ interactions.
5. Conclusion
The research concludes that MAS can be used to envision scenarios of forest plantation development over the long term involving multi-stakeholders. Although, we need a deeper study, the current results already show that setting up a sawmill adapted for processing small logs from plantations would be a huge incentive for smallholders to develop plantations, including areas far from roads. The sawmills would increase the wood’s value. The outcome, besides improved landscape management, is also increased income for smallholders. This is because without a sawmill, smallholders move to sites close to roads and leave their remote plots; as a result, wood supply to industries, smallholder incomes and forest areas are all reduced.
References
[1] SAFODA, Sabah Forestry Development Authority, (n.d.),http://www.sabah.gov.my/kpsp/safo index.htm(accessed 25.02.03).
[2] CIRAD, Natural resources and multi-agent simulations. Centre de Coop´eration Internationale en Recherche Agronomique pour le D´eveloppement.http://cormas.cirad.fr/en/outil/outil.htm, 2001 (accessed 25.02.02).
[3] F. Bousquet, O. Barreteau, C. Le Page, C. Mullon, An environmental modeling approach: The use of multi-agent simulations, in: F. Blasco, A. Weill (Eds.), Advances in Environmental and Ecological Modelling, Elsevier, Paris, 1999.
[4] F. Bousquet, I. Bakam, H. Proton, C. Le Page, CORMAS: Common-pool resources and multi-agent systems, Lecture Notes in Artificial Intelligence 1416 (1998) 826–838.
[5] O. Barreteau, F. Bousquet, SHADOC: A multi-agent model to tackle variability of irrigated systems, Annals of Operations Research 94 (2000) 139–162.
[6] O. Thebaud, B. Locatelli, Modeling the emergence of resource sharing conventions: an agent-based approach, The Journal of Artificial Societies and Social Simulation 4 (2) (2001).http://www.soc.surrey.ac.uk/JASS/4/2/3.html(accessed 25.02.03).
[7] J. Rouchier, F. Bousquet, O. Barreteau, C. Le Page, J.L. Bonnefoy, Multi-agent modelling and renewable resources issues: the relevance of shared representations for interacting agents, in: S. Moss, P. Davidsson (Eds.), Lecture Notes in Artificial Intelligence 1979, 2000, pp. 181–197.
[8] F. Bousquet, C. Le Page, I. Bakam, A. Takforyan, Multi-agent simulations of hunting wild meat in a village in eastern Cameroon, Ecological Modelling 138 (2001) 331–346.
[9] J. Rouchier, F. Bousquet, M. Requier-Dejardins, M. Antona, A multi-agent model for transhumance in North Cameroon, Journal of Economic Dynamics and Control (2001) 527–559.
[10] P. d’Aquino, C. Le Page, F. Bousquet, A. Bah, A novel mediating participatory modelling: The self-design process toaccompanycollective decision making, International Journal Agricultural Resources, Governance and Ecology 12 (1) (2002) 59–74.
[11] D. Brown, K. Schreckenberg, G. Shepherd, A. Wells, Forestry as an entry point for governance reform, ODI Forestry Briefing 1 (2002). [12] D. Kaimowitz, The political economy of environmental policy reform in Latin America, Development and Change 27 (3) (1996) 433–452. [13] T. Plumptre, J. Graham, Governance and Good Governance: International and Aboriginal Perspectives, Institute On Governance, 1999. [14] G. Borrini-Feyerabend, M.T. Farvar, J.C. Nguinguiri, V.A. Ndangang, Co-management of Natural Resources: Organising, Negotiating and
Learning-by-doing, GTZ and IUCN, Kasparek Verlag. Heidelberg, Germany, 2000.
[15] J. Mayers, S. Bass, D. Macqueen, The Pyramid: A diagnostic and planning tool for good forest governance, IIED (2002).
[16] C.J.P. Colfer, M.A. Brocklesby, C. Diaw, P. Etuge, M. G¨unter, E. Harwell, C. McDougall, N.M. Porro, R. Prabhu, A. Salim, M.A. Sardjono, B. Tchikangwa, A.M. Tiani, R. Wadley, J. Woelfel, E. Wollenberg, The BAG: basic assessment guide for human well-being, in: Criteria and Indicators, in: Toolbox Series, No 5, CIFOR, Bogor, 1999.
[17] H.R. Bernard, Research Methods in Anthropology: Qualitative and Quantitative Approaches, Sage, Thousand Oaks, CA, 1994.
[18] J.W. Grant, E.K. Pedersen, S.L. Marin, Ecology and Natural Resource Management, in: System Analysis and Simulation, Addison-Wesley, Reading, MA, 1997.
[19] J.P. Muller, MAS in the field of computer science, in: Asia IT@C Lecture Notes, CIRAD, Bangkok, 2004.
[20] S. Sen, G. Weiss, Learning in multiagent systems, in: G. Weiss (Ed.), MultiAgent Systems: A Modern Approach to Distributed Artificial Intelligence, MIT Press, Cambridge, 1999.
[21] O. Barreteau, F. Bousquet, J. Attonaty, Role-playing games for opening the black box of multi-agent systems: Method and lessons of its application to Senegal River Valley irrigated systems, Journal of Artificial Societies and Social Simulation 4 (2) (2001).