DOI: 10.12928/TELKOMNIKA.v14i3A.4403 244
Unsupervised Classification of Fully Polarimetric SAR
Image Based on Polarimetric Features and Spatial
Features
Xiaorong Xue*1, Liping Di2, Liying Guo3, Li Lin4
1
The School of Computer and Information Engineering, Anyang Normal University, Anyang, Henan, 455000, P. R. China
2,4
Center for Spatial Information Science and Systems, George Mason University, Fairfax, VA , 22030, USA
3
Institute of Natural Resources and Regional Planning, Chinese Academy of Agricultural Sciences, Beijing, 100081, P. R. China
*Corresponding author, e-mail:[email protected]
Abstract
Polarimetric SAR (PolSAR) has played more and more important roles in earth observation. Polarimetric SAR image classification is one of the key problems in the PolSAR image interpretation. In this paper, based on the scattering properties of fully polarimetric SAR data, combing the statistical characteristics and neighborhood information, an efficient unsupervised method of fully polarimetric SAR image classification is proposed. In the method, polarimetric scattering characteristics of fully polarimetric SAR image is used, and in the denoised total power image of polarimetric SAR, SPAN (the total polarimetric power), the texture features of gray level co–occurrence matrix are extracted at the same time. Finally, the polarimetric information and texture information are combined for fully polarimetric SAR Image classification with clustering algorithm. The experimental results show that better classification results can be obtained in the Radarsat-2 data with the proposed method.
Keywords: Polarimetric SAR, polarimetric feature, gray level co–occurrence matrix, image classification
Copyright © 2016 Universitas Ahmad Dahlan. All rights reserved.
1. Introduction
Synthetic Aperture Radar (SAR) can be used to acquire high-resolution images of ground targets during night as well as day or in good weather as well as inclement weather, and it also has strong penetration ability on some targets, so it plays an important role in the national economy(such as Agriculture, Disaster monitoring and prevention. etc.) and defense. SAR image classification is a complex and key step in SAR image interpretation, which is the basis for automatic processing of SAR image. SAR, especially polarimetric SAR, by measuring the scattering properties of each resolution cell at polarization combinations of different transceivers, records more complete target backscatter information, and provides good data support for a detailed analysis of the target scattering characteristics. Polarimetric SAR image classification map can be used as an intermediate result to provide supplementary information for target detection and recognition, etc., and also be as a final result which is directly output to users. Therefore, carrying out research of effective polarimetric SAR image classification is very important for improving the application level of polarimetric SAR system [1-11].
based on different characteristics of polarimetric data. The number of classes in these algorithms is often unknown in advance, and it is determined by the classifier. The methods used are usually iterative, and based on the distance or pseudo-distance; the best classification results are gradually gotten. Since these types of algorithms don’t require priori knowledge, they have great advantages, and have been concerned greatly.
Some classification methods of polarimetric SAR image are studied based on features of polarimetric SAR at home and abroad. According to the characteristics of fully polarimetric SAR data, extracting features containing polarimetric information based on the data distribution characteristics or scattering mechanism, classification methods are designed to complete the terrain classification. This kind of methods can be probably subdivided into the following kinds of classification methods, the first kind of methods are those which are based on the statistical characteristics of polarimetric SAR, and the second kind of methods are those which are based on the polarimetric SAR scattering mechanism. In fully polarimetric SAR image classification based on statistical distribution and scattering mechanism, the typical polarimetric SAR image classification methods include, the multi-polarization SAR image classification method based on Wishart distribution, the unsupervised SAR image classification method based on H/α target decomposition, and the unsupervised polarimetric SAR image classification method based on Freeman decomposition,etc. In the study of specific polarimetric SAR image classification, some methods are proposed. Combined with H/α/A and maximum likelihood estimation based on complex Wishart disrtribution, Pottier proposed the Wishart-H/α/A unsupervised classification method [1], which is currently the most widely used in fully polarimetric SAR data classification at present. Lamei Zhang, etc., on the basis of the sparse characteristics of the features for PolSAR image classification, proposed a supervised PolSAR image classification method based on sparse representation. First, the effective features are extracted to describe the distinction of each class. Then, the feature vectors of the training samples construct an over-complete dictionary and obtain the corresponding sparse coefficients; meanwhile, the residual error of the pending pixel with respect to each atom is evaluated and considered as the criteria for classification, and the ultimate class results can be obtained according to the atoms with the least residual error. In addition, a Simplified Matching Pursuit (SMP) algorithm is proposed to solve the optimization problem of sparse representation of PolSAR images. The verification tests are implemented using Danish EMISAR L-band fully polarimetric SAR data of Foulum area, Denmark. The preliminary experimental results confirm that the proposed method outputs an excellent result and moreover the classification process is simpler and less time consuming [9]. In solving the problem about classification of polarimetric SAR image, Stefan Uhlmann, etc., extract powerful color features from pseudocolor images corresponding to Polarimetric synthetic aperture radar (PolSAR) data so as to provide additional data for a superior terrain classification. They introduce and perform in-depth investigation of the application of color features over the Pauli color-coded images besides SAR and texture features. The classification results show that the additional color features introduce a new level of discrimination and provide noteworthy improvement in classification performance (compared with the traditionally employed PolSAR and texture features) within the application of land use and land cover classification [10]. Serkan Kiranyaz, etc., proposed a collective network of (evolutionary) binary classifier (CNBC) framework for achieving high classification performance of polarimetric SAR image. The CNBC framework adapts a “Divide and Conquer” type approach by allocating several NBCs to discriminate each class and performs evolutionary search to find the optimal BC in each NBC. In such an (incremental) evolution session, the CNBC body can further dynamically adapt itself with each new incoming class/feature set without a full-scale retraining or reconfiguration. Both visual and numerical performance evaluations of the proposed framework over two benchmark SAR images demonstrate its superiority and a significant performance gap against several major classifiers in this field [11].
Although there have been some good results of the polarimetric SAR image classification based on only polarimetric characteristics, the function of that kind of classification methods is still very limited. In some cases, the polarimetric characteristics of some non-similar targets may be very similar; however, the polarimetric characteristics of some similar targets may also be very different. Therefore, just with the polarimetric characteristics, the accuracy of polarimetric SAR image classification is very limited.
data, but also combines the statistical characteristics and neighborhood information, and keeps the scattering properties to some extent. In the method, according to polarimetric scattering characteristics of fully polarimetric SAR image, some polarimetric features are calculated, and in the denoised total power image of polarimetric SAR, SPAN, the texture features of gray level co–occurrence matrix are extracted at the same time. Finally, the polarimetric information and texture information are combined for fully polarimetric SAR image classification by clustering algorithm. The experimental results show that, compared with the traditional multi-polarization SAR image classification methods, better classification results can be obtained in the Radarsat-2 data with the proposed method.
2. Polarimetric Feartures of Polarimetric SAR
Target data in fully polarimetric SAR measurement can be represented as Sinclair scattering matrix (S) matrix, the matrix is
vv vh
hv hh
S
S
S
S
S
(1)In fully polarimetric SAR imaging system, the four complex data can be obtained. General spaceborne polarimetric SAR is a single station form, which means that in receiving and transmitting radar signal, the same antenna is used. Under the condition of satisfying the reciprocity,
S
hv
S
vh. According to the knowledge of the group theory, Pauli is chosen to vectorize the basic scattering matrix to get k,
hhS
vvS
hhS
vvS
hv
k
S
2
2
1
(2)Considering that the vast majority of terrain targets will be randomly distributed targets, they has multiple scattering centers, and the total signal is gotten by coherent superposition, so spatial statistical average processing is often used to smooth the coherence of electromagnetic wave. Polarimetric coherent matrix is often represented as the following,
Ni
H i i H
k
k
N
k
k
T
1
1
(3)
Where, N is the number of looks, ki is the scattering vector of look i, and superscript H expresses conjugate transpose. According to the knowledge of matrix theory, coherence matrix T is 3 x 3 half positive definite Hermite matrix, and it can be decomposed into the sum of three separate coherent matrixes. T has real nonnegative eigenvalues and orthogonal eigenvectors, and it can be expressed as the following form,
31 3
1 1
i
H i i i i
i
i
T
u
u
U
U
T
(4)and HH. The third eigenvalue gives the depolarimetric effect aroused by the medium. The general form of the ui is given by Cloude.
In 1996, Cloude and others gave the entropy H and scattering Angle α of target on the basis of characteristics decomposition of the polarimetric coherent matrix T[3]. H and α can be respectively defined as the follows:
31
3
log
i
i
i
P
P
H
(5)
31 i
i i
P
(6)Where ,
31 i
i i i
P
, and
1
3
1
i i
P
.According to information theory, the scattering entropy (0≤H≤1) expresses randomness of scattering medium from isotropic scattering (H = 0) to a completely random scattering (H =1). If the value of H is very low, this is that the difference of three eigenvalues is bigger. For that, it can be thought that a depolarimetric characteristic of target is weak, the dominant scattering matrix part of target is the eigenvector corresponding to the maximum eigenvalue, and other eigenvectors is ignored. If H = 0, it is indicated the target is pure scattering one, and the rank of coherent matrix is 1. If the value of H is very high, this is that the size of three eigenvalues is very close. For that, it can be thought that depolarimetric characteristics of target is very strong, which means the target scattering presents high randomness, which is in that target scattering is mainly composed of body scattering of target. What is able to identify scattering component information is α, α has the characteristics of rotation invariance along radar wave beam direction, and associates with physical mechanism in the process of scattering, corresponding to the change of scattering from the surface scattering (α= 0 °), to body scattering (α= 45 °) , and to the dihedral angle scattering (α= 90 °). So the H-α plane is often used for unsupervised classification, or the initial classification is done based on H-plane, etc. Cloude and Pottier used H and α to form a two dimensional feature space. Cloude, etc., gave the category boundary of the plane of the H-α on the basis of a large number of experiments. With the H-α plane, fully polarimetric SAR data can be divided into eight categories.
There is a case in which scattering mechanism can’t distinguish the two parameters, polarimetric entropy H and scattering angle α, which is that influence of λ2 can't be ignored according to the size difference between λ2 and λ1. In that condition , the relative relationship of
λ2 and λ3 should be considered, therefore, Pottier proposed a new parameter in 1998, the degree of anisotropy, as the supplement of H-α plane, the definition of the anisotropic degree is the following,
3 2
3 2
A
(7)Anisotropy degree A expresses anisotropy degree of target scattering. When polarimetric entropy H is larger (H>0.7), A can characterize the influence degree of the two scattering mechanism that don’t dominate to the scattering result [7]. The second larger value A indicates that only the second scattering mechanism has significant effect on scattering results. The smaller value A indicates that the influence of the third kind of scattering mechanism should be also considered. H, α, and A form the three dimensional feature space. Through the three dimensional feature space, the classification of the fully polarimetric SAR data also increases to 16 classes.
scattering mechanism among the pixels is very effective for keeping image detail structure and image resolution, and the detailed structure and resolution of the image will directly affect the performance of the classifier. Considering that the total polarimetric power SPAN is effective parameter of characterizing scattering mechanism intensity information among the pixels, SPAN is introduced into initialization in this paper, and its expression formula is as the following,
3 2 1 2 2 2 2
)
(
H hh hv vh vvS
S
S
S
SS
Tr
SPAN
(8)What SPAN describes is the size of the scattering intensity corresponding to the pixels, it contains the more detailed structure of the image. In general, pixels whose scattering intensity are bigger may correspond to the secondary scattering, and pixels whose scattering intensity is smaller may correspond to the first scattering. Therefore, SPAN can be used to further distinguish three different scattering mechanisms: (1) the larger SPAN value corresponds to the strong scattering, such as construction, forest; (2) the medium SPAN value corresponds to the mixed scattering mechanism, such as crop area; (3) the smaller SPAN value corresponds to the strong scattering, such as water, flat surface.
3. Gray-level Co-occurrence Matrix
Many mathematical methods can be used to measure fine texture; an efficient one of them is the gray level co-occurrence matrix method. For the measure of moderate texture, texture frequency spectrum is better. The gray level co-occurrence matrix can be defined as the following:
Supposing that some area of image has N gray level values, the gray level co-occurrence matrix corresponding with the area is N N stairs matrix, in which, the element in the place (i, j) (1,…,i, …N; 1,…,j, …,N;) is the probability of this merotropy that the gray level of the image pixel departing with stationary place relation (DX,DY) from the image pixel whose gray level is i is j , is called displacement. In practical application, the features used in texture classification are some statistics calculated with the upper gray level co-occurrence matrix. Haralick proposed fourteen statistics calculated with the gray level co-occurrence matrix. With many experiments [12], Baraldi thought that the following statistics are the best for SAR image [13]:
Angle second moment: (ASM)=
N i N j j i P 1 1 2 ) , ( (9)
Entropy: (ENT) =
N i N j j i P j i P 1 1 ) , ( log ) , ( (10) Homogeneity area:(HOM) =
N i N j j i j i P 1 1 2] ) ( 1 [ ) , ( (11)No-similarity: (DIS) =
N i N j j i P j i 1 1 ) , ( || (12)
4. The Main Steps of the Proposed Polarimetric SAR Image Classification Method
The proposed unsupervised classification method of polarimetric SAR image is based on polarimetric features and spatial features, and its main steps are as the follows,
(1) By preprocessing the PolSAR data (speckle filtering on PolSAR data), polarimetric coherent matrix T is gotten.
(2) Feature decomposition is done on T and eigenvectors are gotten based on the formula (4).Through formulas (5) to (8), H, α, A, and SPAN are calculated.
(3) In the image of SPAN, the four gray-level co-occurrence features are calculated. (4) The polarimetric features in step 2 and the gray-level co-occurrence features in step 3 are combined as the feature vector of a pixel.
(5). K-average value clustering method is used to cluster the feature vectors of all pixels, and the classification result is gotten.
5. Results and Analysis
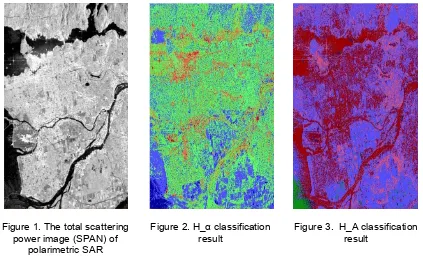
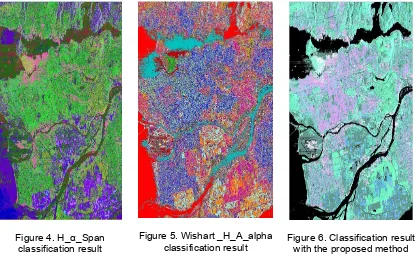
In order to verify the effectiveness of the proposed method in this paper, the fully polarimetric data from Radarsat-2 in Vancouver, 2008, is used to do classification experiments, the data size is 5810 pixels * 3332 pixels. Firstly, with the improved Lee filter algorithm, 3 x3 filter processing on fully PolSAR data is done to reduce speckle. The experimental data is decomposed with Pauli base. The total scattering power image (SPAN) of the original PolSAR data is shown in the Figure 1. Figure 2, Figure 3, Figure 4 and Figure 5 are respectively the H_α classification result, the H_A classification result, the H_α_SPAN classification result, the wishart_H_A_alpha classification result [15].
[image:6.595.87.510.461.733.2]Based on the polarimetric features and the gray-level co-occurrence features of polarimetric SAR, the proposed classification method has some advantages than the traditional classification methods. The classification result with the proposed method is shown in Figure 6. Compared with Figure 2, Figure 3, Figure 4, and Figure 5, some typical targets in PolSAR image, such as mountain area, river, sea and city building are classified better. It can be seen from Figure 6 that the classification result with the proposed method reflects the basic features of ground objects. Compared with the actual objects, the main target categories are recognized.
Figure 1. The total scattering power image (SPAN) of
polarimetric SAR
Figure 2. H_α classification result
Figure 4. H_α_Span classification result
[image:7.595.92.507.95.363.2]Figure 5. Wishart _H_A_alpha classification result
Figure 6. Classification result with the proposed method
6. Conclusions
To make full use of the information of polarimetric SAR image to improve classification accuracy, a new unsupervised classification method of fully polarimetric SAR data based on polarimetric features, and statistical characteristics and neighborhood information is proposed in this paper. In the method, the polarimetric features, H, α, A, and SPAN are calculated, the spatial statistical features, the four gray-level co-occurrence features, are also calculated. The polarimetric features and the spatial statistical features are combined to classify polarimetric SAR image. The Experiments show that the proposed algorithm can better keep the texture and details of polarimetric SAR image, and its classification result is superior to the results with the traditional classification methods of fully polarimetric SAR image.
Acknowledgements
This work was supported by (1) the National Natural Science Foundation Project of China (U1204402), (2) the Foundation Project for Innovation (supported by Digital China Research Institute of Peking University and the twenty-first century Aerospace technology Co., Ltd., China), (3) the Science and Technology project (122102210462) supported by the Department of Science and Technology in Henan province, China,(4) the Fund project for young teachers of universities in Henan province, China, (5) The Natural Science Research Program Project (14A520039) supported by the Department of Education in Henan Province, China.
References
[1] JS Lee, E Pottier. Polarimetric Radar Imaging. USA: CRC Press. 2008: 1-28.
[2] SR Cloude, E Pottier. An Entropy Based on Classification Scheme for Land Applications of Polarimetric SAR. IEEE Transactions on Geoscience and Remote Sensing. 1997; 35(1): 68-78. [3] SR Cloude, E Pottier. A Review of Target Decomposition Theorems in Radar Polarimetry. IEEE
Transactions on Geoscience and Remote Sensing. 1996; 34(2): 498- 518.
[4] Zhang De-xiang.Fusion of Multi-band SAR Images Based on Directionlet Transform. TELKOMNIKA Indonesian Journal of Electrical Engineering. 2014; 12(1): 506-513.
[5] YQ Jin, F Xu. Polarimetric Scattering and SAR Information Retrieval. USA: Wiley-IEEE Press. 2013. [6] Bhargavi VR, Senapati RK. Bright Lesion Detection in Color Fundus Images Based on Texture
[7] Murali Mohan Babu Y, Subramanyam MV, Giri Prasad MN. A New Approach for SAR Image Denoising. International Journal of Electrical and Computer Engineering (IJECE). 2015; 5(5): 984-991.
[8] L Bombrun, G Vasile, M Gay, F Totir. Hierarchical Segmentation of Polarimetric SAR Images Using Heterogeneous Clutter Models. IEEE Transactions on Geoscience and Remote Sensing. 2011; 49(2): 2011.
[9] LM Zhang, LJ Sun, B Zou, WM Moon. Fully Polarimetric SAR Image Classification via Sparse Representation and Polarimetric Features. IEEE Journal of Selected Topics in Applied Earth Observations and Remote Sensing. 2015; 8(8): 3923-3932.
[10] Sun Q, Zhang J. Parallel Research and Implementation of SAR Image Registration Based on Optimized SIFT. TELKOMNIKA Indonesian Journal of Electrical Engineering. 2014; 12(2): 1125-1131.
[11] S Uhlmann, S Kiranyaz. Integrating Color Features in Polarimetric SAR Image Classification. IEEE Transactions on Geoscience and Remote Sensing. 2014; 52(4): 2197-2216.
[12] S Kiranyaz, T Ince, S Uhlmann, M Gabbouj. Collective Network of Binary Classifier Framework for Polarimetric SAR Image Classification An Evolutionary Approach.IEEE Transactions on Systems, Man, and Cybernetics-Part B: Cybernetics. 2012; 42(4): 1169-1186.
[13] RM Haralick. Statistical and Structural Approaches to Texture.In: Proceeding of IEEE. 1975; 67(5): 786-804.
[14] Cheng L, Bao W. Remote sensing image classification based on optimized support vector machine.
TELKOMNIKA Indonesian Journal of Electrical Engineering. 2014; 12(2): 1037-1045.