ANTIOXIDANT ACTIVITY OF WATERLEAF
(Talinum triangulare (
Jacq.
)
Willd) CULTIVATED WITH
ORGANIC FERTILIZERS DURING THE RAINY SEASON
STELLA ALINNESHIA
DEPARTMENT OF FOOD SCIENCE AND TECHNOLOGY
FACULTY OF AGRICULTURAL ENGINEERING AND TECHNOLOGY BOGOR AGRICULTURAL UNIVERSITY
STATEMENT LETTER OF MANUSCRIPT AND SOURCES OF
INFORMATION*
Hereby I genuinely stated that the manuscript entitled Antioxidant Activity of Waterleaf (Talinum triangulare (Jacq.) Willd) Cultivated with Organic Fertilizers during the Rainy Season is an authentic work of mine under the supervision of academic counselors and has never been presented in any forms and universities. All the information taken and quoted from published or unpublished works of the writters has been mentioned in texts and attached in the bibliography at the end of this manuscript.
Hereby I bestow the copyright of my manuscript to the Bogor Agricultural university.
Bogor, September 2014
Stella Alinneshia
ABSTRACT
STELLA ALINNESHIA. Antioxidant Activity of Waterleaf (Talinum triangulare
(Jacq.) Willd) Cultivated with Organic Fertilizers during the Rainy Season. Supervised by PROF. DR. IR. RIZAL SYARIEF, DESS and DR. IR. DIDAH NUR FARIDAH, M.Si.
Talinum triangulare (Jacq.) Willd, known as ginseng Jawa or kolesom Jawa
in Indonesia, is one of tropical plants that has been widely used as traditional herbal medicine and consumed as vegetable in Indonesia. The leaf from the plant contains bioactive compound identified as flavonoid which can function as antioxidant. The objective of this research was to measure the antioxidant activity and total phenolic compound of waterleaf in five different treatments of organic fertilization. Extraction of the leaf was carried out with the method of ultrasound assisted extraction/UAE (sample:MeOH=1:10 b/v, t=20 minutes, cold extraction room temperature). The present research resulted that the different organic fertilizer treatments significantly influenced the secondary metabolites content e.g. phenolic content of Talinum triangulare (Jacq.) Willd (p<0.05). High total phenolic content did not always exhibit high antioxidant activity as the highest total phenolic content group (PK+RP: 10.76 mg GAE/g dry sample) had weaker antioxidant activity (DPPH: 1.73 ± 0.01 mg AEAC/g GAE) than thus lower in phenolic content. Organic fertilizer RP+AS (rock phosphate and husk ash) treatment (7.36 ± 0.00 g GAE/g dry sample) exhibited the highest antioxidant activity in scavenging DPPH free radicals and strongest reducing power among all groups (2.06 ± 0.01 mg AEAC/g GAE; 0.022 ± 0.000 mg AEAC/g GAE respectively). Organic fertilizer influenced the secondary metabolite produced by the waterleaf.
Keywords: antioxidant activity, DPPH, organic fertilization, Talinum triangulare
Manuscript
submitted as a partial fulfillment of the requirement for the degree of Bachelor of Agricultural Engineering and Technology
at the Department of Food Science and Technology
ANTIOXIDANT ACTIVITY OF WATERLEAF
(Talinum triangulare (
Jacq.
)
Willd) CULTIVATED WITH
ORGANIC FERTILIZERS DURING THE RAINY SEASON
DEPARTMENT OF FOOD SCIENCE AND TECHNOLOGY
FACULTY OF AGRICULTURAL ENGINEERING AND TECHNOLOGY BOGOR AGRICULTURAL UNIVERSITY
BOGOR 2014
PREFACE
I could not forget the day where eleven months ago I got this antioxidant as my undergraduate thesis research project which at first I thought that it somehow would not be this hard and long albeit I battled almost every day with sweat and blood against those beautiful colors of reaction yet nerve-wrecking chemical reagents: the chemistry that always energizes me. All the hard work is paid off on this limited pages of paper that cannot fully show all the enjoyments I spent in the lab hoping for good, logical, and explainable result and the tiredness also sorrow when for the 4th times I failed the same experiment. I thought at that time “Do I need to drink my waterleaf antioxidant extract to lessen my oxidative stress?” Doing laboratory research was like riding a roller coaster to me: I could scream out madly after succeeding in figuring out the reasoning behind every deed I did even sometimes it took me days long. But, mostly I could not get this thesis done without the abundant grace from the Lord Jesus Christ: thank you Lord for trusting me to do the work. My heart is sincere for these people:
1. Precious mom, dad, Jesslyn, and Yoshe, I thank you for all the prayers, support, and unconditional love to me.
2. Pak Rizal Syarief, the advisor I admire so much, thank you for sharing all the stories, supporting me, and becoming such a great academic advisor during my years in FST; Ibu Didah Nur Faridah, a mom-like to me, thank you for lots of help, input, and consideration in completion of this thesis and research.
3. Ibu Nancy Dewi Yuliana as the examiner, thank you for the time, input, corrections, and help also advised my paper during whole “DSDC IFT 2014” process.
4. FST IPB lecturers, staffs, all the laboratory workers, thank you for leaving me with bunches of good, happy, bad, weird, and incredible moments in FST IPB.
5. My besties: Irene, Irena, Silvie, Tania, Gideon, Michael, Florentina, Irma, Steven thank you for 4 years of ‘un-rewinding-able’ university life. 6. Vicario Reinaldo, thank you for becoming the part of God’s plan for me,
for all the ups and downs; Kelvin Timotius, who has been truly a best friend of mine in the good and bad times.
7. ‘Family House’ (Tante, Om, Ce Sandra, Ce Grace, Agnes, Ce Erni, and other 45 people I could not mention) that always be my family.
8. ITP 47 “Doa Ibu”, IAAS LC-IPB Family, PMK IPB 47, P4 FST 47, SUIJI family, YLI wave 6 fellas, Mawapres Nasional 2014 family.
It would be pages long if I mentioned those people out. But, readers, my happiness dashes out as logarithmic function as you go through pages reading this undergraduate thesis. I do hope that this can inspire you to carry on other researches which can contribute for the betterment of our world.
Bogor, September 2014
TABLE OF CONTENT
LIST OF TABLE x
LIST OF FIGURE x
LIST OF APPENDIX x
INTRODUCTION 1
Background 1
Research Objective 3
Research Benefit 3
RESEARCH METHOD 4
Materials 4
Instrument 4
Research Phases 4
Method of Analysis 5
RESULT AND DISCUSSION 7
Preparation of Sample 7
Sample Extraction 9
Analysis of Total Phenolic Compound and Antioxidant Activity 10
CONCLUSION AND RECOMMENDATION 16
Conclusion 16
Recommendation 16
REFERENCES 16
APPENDICES 20
LIST OF TABLE
Table 1 Combination of organic fertilizer treatments ... 5
Table 2 Nutrient content of soil and tissue of waterleaf in first planting season ... 8
Table 3 Soil pH and C/N ratio before and after planting ... 8
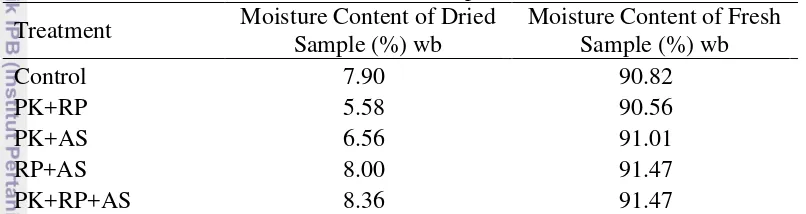
Table 4 Moisture content of fresh and dried sample of waterleaf ... 9
Table 5 Total phenolic and antioxidant activity ... 12
Table 6 Total flavonoid of the waterleaf in different organic fertilizers ... 13
LIST OF FIGURE
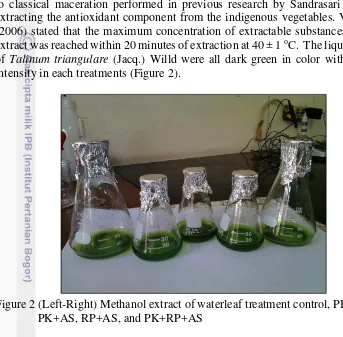
Figure 1 Ultrasound bath used for extraction ... 6Figure 2 (Left-Right) Methanol extract of waterleaf treatment control, PK+RP, PK+AS, RP+AS, and PK+RP+AS ... 10
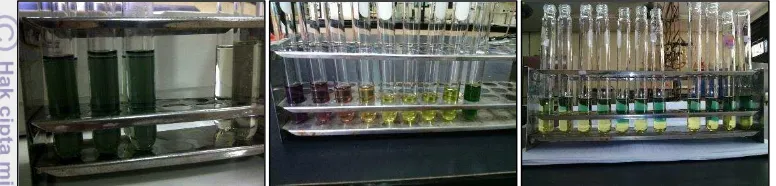
Figure 3 (Left-right) Total phenolic assay, DPPH assay, and ferric reducing assay ... 11
LIST OF APPENDIX
Appendix 1 Moisture content of waterleaf in five different treatment of organic fertilizer ... 20Appendix 2 Preparation of standard reference solution ... 21
Appendix 3 Preparation of chemical reagent ... 22
Appendix 4 Total phenolic content ... 23
Appendix 5 Gallic acid standard curve ... 24
Appendix 6 Ascorbic acid standard curve for DPPH ... 25
Appendix 7 Antioxidant activity by DPPH Control group ... 26
Appendix 8 Antioxidant activity by DPPH PK+RP group ... 28
Appendix 9 Antioxidant activity by DPPH PK+AS group... 29
Appendix 10 Antioxidant activity by DPPH RP+AS group ... 30
Appendix 11 Antioxidant activity by DPPH PK+RP+AS group ... 31
Appendix 12 Antioxidant activity by DPPH AEAC ... 32
Appendix 13 Antioxidant activity by Ferric Reducing Assay AEAC ... 33
Appendix 14 One Way ANOVA Total Phenolic Content ... 34
Appendix 15 One Way ANOVA DPPH IC50 ... 35
Appendix 16 One Way ANOVA DPPH AEAC ... 36
Appendix 17 One Way ANOVA DPPH/Total Phenolic ... 37
Appendix 18 One Way ANOVA Ferric Reducing Power ... 38
INTRODUCTION
Background
Within last few decades, the idea of inventing food that promoted health for human had rapidly evolved. Scientists used to investigate the main role of the food only as the source of energy and body-forming substances. However, the investigation has gone beyond recently discovering varies of biologically active food components benefiting human health and promoting wellness, in accordance with the emerging of many degenerative disease e.g. cancer and cardiovascular diseases. The term of functional food then introduced as the food, part of the daily life, that demonstrated the health benefits and can reduce the risk of chronic diseases beyond its basic nutrition. Functional foods can be grouped to several groups: (1) conventional foods containing naturally occurring bioactive substances e.g. dietary fiber, (2) foods enriched with bioactive substance e.g. probiotics and antioxidant, and (3) synthesized food ingredient introduced to traditional foods e.g. prebiotics. Functional components frequently mentioned among those are probiotics and prebiotics, soluble fiber, omega-3-polyunsaturated fatty acid, conjugated linoleic acid, plant antioxidants, vitamins and minerals, some proteins, peptides and amino acids, also phospholipid (Grajek et al. 2005; IFT 2005).
Vegetables has many significant benefits for body health and is suggested to be consumed routinely as a part of daily diet. Vegetables contains vitamins, minerals, and functional bioactive components e.g. antioxidant that correlated positively with human health. The trend in consuming vegetables in Indonesia has shown significant increase. National consumption of vegetables per capita during the period of 2006-2008 grew 38.8 %. This resulted as people become more aware about the importance of consuming healthy food as part of the diet to prevent the chronic disease caused by free radicals. As antioxidant can be supplemented from outside of the body through the diet, consumption of natural antioxidant through vegetables has been studied to lower the incident of cardiovascular disease and cancer. Natural antioxidant commonly found in vegetables as phenolic compounds e.g. tocopherol, flavonoid, and phenolic acid, nitrogen compound (alkaloid, chlorophyll, and amino acid), or carotenoid (Apak et al 2007; Apak et al. 2013; Ditjen PPHP 2010).
2
during the rainy season were higher than dry season. However, the soluble dietary fiber (SDF) content was higher in dry season cultivation (Prabekti 2012, Fadhilatunnur 2013). Oligosaccharide possessed by waterleaf also has significant benefit for human health influencing the growth of gut flora in GI-tract, reducing the colon cancer risk, and enhancing the absorption of minerals e.g. calcium, magnesium, and iron. Harianja (2014) studied the mono- and oligosaccharide profile of waterleaf cultivated with different organic fertilizers during the rainy season in which waterleaf with no organic fertilizer treatment resulted in the highest monosaccaharides (1025.79 mg/100 g dry basis) while the waterleaf treated with the combination of cow manure, rock phosphate, and husk ash resulted in the highest oligosaccharides (87.61 mg/100 g dry basis).
Secondary metabolite of waterleaf has been reported to be phenolic components e.g. quercetin, kaemferol, anthocyanin, chlorogenic acid, ferulic acid, and caffeic acid thus can act as antioxidant. The research conducted by Andarwulan
et al. (2010) to measure the antioxidant activity of various indigenous vegetables showed that the leaves of waterleaf contained phenolic compound which can act as antioxidant to protect the body from oxidative stress caused by free radicals. In phenolic compounds, the presence and distribution of numerous hydroxyl group in the chemical structure of polyphenols make them excellent antioxidants for their ability to chelate transition metal ions (iron and cooper) and inhibit the activity of enzyme participating in the formation of free radicals (xanthine oxidase, NADPH oxidase). Compared to other vegetables (e.g. kenikir, beluntas, and katuk) the antioxidant activity of waterleaf was found to be weak. However, the leaves of waterleaf has been widely consumed and more preferred as cooked vegetable compared to other as a part of daily diet since its suitability with Indonesian culture for sautéing and stir-fry producing soft texture and preferable taste. Thus, the potential of waterleaf to be eaten as the source of natural antioxidant is high. (Andarwulan et al. 2010; Fenny et al. 1996; Gawron-Gzella et al. 2012; Nugroho 2000; SEAFAST Center IPB 2013).
3 previous research showed that the different organic fertilizer treatments influenced the secondary metabolites content formed by the plant i.e. antioxidant. Organic fertilizer application in different plants most likely results in different value of total phenolic content. According to Ibrahim et al. (2013), total phenolic content in organic fertilization of Labisia pumila Benth was found higher than those cultivated with inorganic fertilization. However, the value of total phenolic would reach maximum point in which further addition of organic fertilizer would decrease the total phenolic content. In tomatoes, according to research conducted by Zhao (2006), organic fertilizer did not rise the total phenolic content significantly while when applied to lettuce organic fertilizer increased the total phenolic content. Mualim (2012) reported that inorganic fertilizers applied to waterleaf Talinum triangulare
(Jacq.) Willd cultivated during the rainy season produced better quality of waterleaf in term of the content of primary metabolites (total carbohydrate and protein content), secondary metabolites (total phenolic content, total flavonoid content, and total chlorophyll content), and better antioxidant capacity (lower IC50 value) than
waterleaf cultivated with organic fertilizers. However, both organic and inorganic fertilizer applied to Talinum triangulare (Jacq.) Willd did not show significant difference in phytochemical content i.e. total phenolic compound, alkaloid, and flavonoid based on research conducted by Chibueze and Akubugwo (2011).
The rainy season cultivation might also influence the content of antioxidant since it was suggested that the phenolic compound in waterleaf was found lower during the rainy season (Mualim 2012). Generally, the content of secondary metabolite in the plant will rise under water stress condition since under such condition plant undergoes secondary metabolism pathway producing i.e. phenolic compound including flavonoid to survive rather than the primary metabolism to produce the biomass. However, another study conducted by Solichatun et al.(2005) in Talinum paniculatum Gaertn. found that the content of secondary metabolite e.g. saponin increased when there was abundant supply of water since saponin was most likely stored in the tuber part of the plant. Mualim (2012) suggested that biosynthesis of non-flavonoid phenolic compound was not influenced by the variation of rainfall.
Research Objective
This research was aimed to study the impact of different organic fertilizers treatment towards antioxidant activity of waterleaf (Talinum triangulare (Jacq.) Willd) cultivated during the rainy season.
Research Benefit
4
RESEARCH METHOD
Materials
Materials used during the research were five samples powdered leaf of waterleaf from its bud (length ±10 cm from its top of the plant aged 10 weeks after planting obtained from Department of Agronomy and Horticulture, IPB, Methanol Pro-Analysis (MeOH), Folin-Ciocalteau reagent, distilled water, sodium carbonate (Na2CO3), gallic acid standard, Whatman No. 1, DPPH (2,2-diphenyl-1-picrylhydracyl), ascorbic acid standard, phosphate buffer, potassium ferric cyanide (K3[Fe(CN6)]), trichloroacetic
acid (TCA), and ferric chloride (FeCl3).
Instrument
Instruments used during the research were ultrasonic bath (sonicator) Branson 8510, spectrophotometer UV-VIS mini 1240 Shimadzu, analytical balance, water-bath, thermometer, desiccator, oven, hot-plate, vortex mixer, and glassware.
Research Phases
This research was done in three phases: (1) Preparation and sample extraction (2) Total phenolic compound assay (3) Antioxidant activity measurement (DPPH and ferric reducing power assay).
1. Preparation and Sample Extraction
5 Table 1 Combination of organic fertilizer treatments
Treatment content: 1.10 % (Saleh 2013)
Three repetitive samples under the same treatment were mixed homogenously resulted in five groups of treatment. Extraction was done with ultrasound assisted reaction (UAE) using methanol as the solvent (sample:MeOH = 1:10). Extraction was done as single extraction (f= 40 kHz, cold extraction room temperature, t= 20 minutes) (Velikovic et al. 2006).
2. Analysis of Sample
a. Total Phenolic Compound Assay
The second phase of the research was to analyze the total phenolic compound from five methanol extracts of waterleaf with Folin-Ciocalteau method (Shetty et al. 1995) by using gallic acid as the reference standard. b. Antioxidant Activity Measurement
The third phase of the research was to measure the antioxidant activity of five methanol extracts of waterleaf by DPPH method (Brand-Williams, Cuvelier, and Berset 1995) and ferric reducing power assay (Oyaizu 1986) with ascorbic acid as the reference standard.
Method of Analysis
Moisture Content (AOAC 1999)
Analysis of the water content was done for both fresh and dried samples of waterleaf (Talinum triangulare (Jacq.) Willd) by oven method. Empty aluminum beaker was dried in the oven for 15 minutes, cooled in desiccator, then weighted. Sample of 1 gram was weighted in the beaker with analytical balance. The aluminum beaker filled with sample was dried in the oven for 6 hours at 105 oC,
cooled in desiccator, and then weighted. Drying of sample was done until the constant weight obtained. Moisture content was determined based on the difference between initial weight before drying and final weight after drying.
Moisture content (% wb) = W - (W1 - W2)
6
Where: W = weight of sample before drying (g)
W1 = weight of sample and beaker after drying (g) W2 = weight of empty beaker (g)
Sample Extraction by Ultrasound Assisted Reaction (UAE) (Velickovic et al.
2006)
Extraction of dried powdered of waterleaf was done as single extraction using ultrasound assisted extraction (UAE) (f=40 kHz, cold extraction, t= 20 minutes) with methanol as the solvent. One gram of sample was mixed with 10 mL methanol (1:10 w/v) then extracted within ultrasonic bath (Figure 1). The mixture was filtered with Whatman No. 1 and tared into 10 mL volumetric flask with methanol. The extract was put in dark vial and stored in the chiller refrigerator reserved for total phenolic compound and antioxidant activity assay.
Figure 1 Ultrasound bath used for extraction
Total Phenolic Compound Analysis (Shetty et al. 1995)
Extract of sample in each treatment was diluted 10 times with methanol (1:10 v/v). Taken 0.5 mL of extract, it was added with 2.5 mL distilled water and 2.5 mL Folin Ciocalteau reagent 50 %. The mixture shook with vortexer for 5 minutes then added with 2.5 mL of Na2CO3 7.5 % and mixed thoroughly with vortexer. The
7 Antioxidant Activity: DPPH Method (Brand-Williams, Cuvelier, and Berset 1995)
Sample extract in methanol was diluted in various concentration (0 – 4000 ppm). One milliliter of extract then added with 5 mL freshly made 0.1 mM DPPH in methanol solution. The mixture was mixed with vortexer, incubated for 20 minutes at room temperature followed by absorbance measurement at wavelength of 517 nm. Antioxidant activity was expressed as percent inhibition to DPPH radical. IC50 value was determined based on the concentration of sample extract that
results in 50 % inhibition of DPPH radical. The standard of ascorbic acid (0 – 40 ppm) was made to obtain AEAC (Ascorbic acid Equivalent Antioxidant Capacity) value.
Antioxidant Activity: Ferric Reducing Antioxidant Assay (Oyaizu 1986)
Sample extract in methanol was exposed to nitrogen to obtain concentrated extract. The extract was diluted in 10 mL of phosphate buffer (0.2 M, pH 6.6) to various concentration based on DPPH IC50 concentration. One milliliter of extract
was added with 2.5 mL potassium ferric cyanide K3[Fe(CN6)] (10mg/mL). The
mixture was incubated at 50 oC for 20 minutes then added with 2.5 mL
trichloroacetic acid (TCA) (100 mg/mL), 2.5 mL distilled water, and 0.5 mL ferric chloride FeCl3 (10mg/mL). Absorbance was measured at wavelength of 700 nm.
Antioxidant activity was expressed in AEAC value.
RESULT AND DISCUSSION
Preparation of Sample
Three kinds of organic fertilizer were used to cultivate waterleaf for different purposes. Cow manure was used as nitrogen source, rock phosphate was used as phosphate source, and husk ash was used for potassium source. Four different treatments of fertilizer combination resulted in different contribution of nutrient for the soil but all provided the plants with complete nutrients (N, P, and K) as shown in Table 1.
8
or acid condition implicating greater absorption of nitrogen by the plants from the soil.
Table 2 Nutrient content of soil and tissue of waterleaf in first planting season
Treatment N P K PK: cow manure, RP: rock phosphate, AS: husk ash, B: before application, A: after planting, Tiss.: nutrient content in the plants tissue
Table 3 Soil pH and C/N ratio before and after planting
Treatment Soil pH C/N Ratio
PK: cow manure, RP: rock phosphate, AS: husk ash, B: before application, A: after planting
While phosphorus content of the soil before application of organic fertilizer was found to be low (Balittanah 2005), the treatment of organic fertilizer can increase the phosphorus content of the soil (Table 2). Phosphorous was absorbed by the plant in the form of anions H2PO4- and HPO42- (Gardner and Pearce 1991).
Hence, Djuniwati et al. (2007) stated that the mobility of the anions was considered to be very low for it had great retention in the soil resulting in low efficiency (10 – 30 %). Low acidity of the soil also contributed to low availability of phosphorous found in plants’ tissue. Acidity of the soil lowered the availability of phosphate since in acid condition phosphate is more likely to react with soluble iron and aluminum forming insoluble Fe-/Al-phosphate causing low availability of phosphate from the organic fertilizer. The data of phosphorous content in plants’ tissue showed its low availability (average of 0.35 %) as was stated in previous research conducted by Havlin et al. (2005) that the phosphorous content in plants tissue ranged from 0.1 – 0.5 %. The lowest phosphorous content of the waterleaf tissue was found in control treatment and RP+AS (rock phosphate+husk ash) treatment in which both had no cow manure (PK) implicating that cow manure might give the highest contribution to the absorption of phosphorous. Rock phosphate (RP) contained phosphate given as organic fertilizer was slowly released (Pickering et al. 2002) limiting the availability. According to Garg and Bahl (2008), the addition of cow manure as fertilizer could induce the activity of phosphatase enzyme.
9 plants to take more potassium from the soil. That condition resulted in low potassium content of the soil at the end of the cultivation.
The availability of nutrients (N, P, and K) was influenced by the ratio of C/N in the soil as shown in Table 3. The result of C/N ratio in five groups was less than 20. According to Munawar (2011), the ratio of C/N falls below 20 prompts mineralization in which conversion from organic to inorganic form of nutrient happen providing the plants with readily available nutrients.
Data obtained of the rainfall during the cultivation of waterleaf categorized as medium rainfall (BMKG 2005). Rainfall influenced the temperature, erosion of nutrient in the soil, and secondary metabolite formed. Water shortage generally induced the formation of secondary metabolite in plant increasing the content of flavonoid as the natural defense mechanism of the plant (Mualim 2012). High rainfall eroded the nutrient of the soil possibly lowering the nutrient content in the soil affecting the content of secondary metabolite formed.
Table 4 Moisture content of fresh and dried sample of waterleaf Treatment Moisture Content of Dried
Sample (%) wb
PK: cow manure, RP: rock phosphate, AS: husk ash
Moisture content of both fresh sample and dried powdered sample was measured by AOAC method resulted in the range of 90 – 91 % (wb) and 5 – 8 % (wb) respectively (Table 4). The moisture content of waterleaf was reported to be influenced by frequency of fertilizing and the age of the plant: increasing with the addition of the plant age (Anna 2010).
Sample Extraction
Extraction methods commonly used for obtaining extractable substances from plant were hydro-distillation method, maceration, Soxhlet extraction, and ultrasound extraction. Antioxidant compound from Talinum triangulare (Jacq.) Willd underwent single extraction by ultrasound assisted extraction (UAE) (t=20 minutes, cold extraction room temperature) based on the method stated by Velickovic (2006) to extract bioactive component from garden sage Salvia officinalis L. and Salvia glutinosa L.. As an innovative method of extraction, UAE was said to be very promising and effective to obtain bioactive substances from the plant like sage and demonstrated the higher yields of extractable component in which the time is much shorter than classical maceration. The study also showed that the extract contained more flavonoids when it was extracted by UAE than classical maceration. UAE has been widely used to extract bioactive component in walnut green husk (Tabaraki and Rastgoo 2014), Orthosiphon stamineus (Ho et al.
2014), grape seeds (Ghafoor et al 2009), and winter melon seeds (Bimakr et al.
10
Kaempferol was found to be dominant (90 %) in Talinum triangulare (Jacq.) Willd followed by quercetin (Andarwulan et al. 2010). Methanol (MeOH) was used to extract the antioxidant component from the plant as said in the previous study conducted by Sandrasari (2008).
Five treatments of sample were single extracted with MeOH (sample:solvent=1:10 b/v) by UAE for 20 minutes, shorter time required compared to classical maceration performed in previous research by Sandrasari (2008) in extracting the antioxidant component from the indigenous vegetables. Velickovic (2006) stated that the maximum concentration of extractable substances in liquid extract was reached within 20 minutes of extraction at 40 ± 1 oC. The liquid extracts of Talinum triangulare (Jacq.) Willd were all dark green in color with different intensity in each treatments (Figure 2).
Figure 2 (Left-Right) Methanol extract of waterleaf treatment control, PK+RP, PK+AS, RP+AS, and PK+RP+AS
Analysis of Total Phenolic Compound and Antioxidant Activity
The liquid extracts of antioxidant from five groups were analyzed for its total phenolic compound based on the Folin-Ciocalteau method previously done by Shetty et al. (1995). Total phenolic compound was measured by Folin-Ciocalteau method estimating all flavonoids, anthocyanins, and non-flavonoid phenolic compounds which present in the extract. Folin Ciocalteau method was based on oxidation-reduction reaction in which phenolic compounds are oxidized with simultaneous reduction of phosphotungsten-phosphomolybdate complex in base or alkaline medium turning the color into blue (Figure 3) that can be measured by spectrophotometer at 765 nm (Gawron-Gzella et al. 2012). The standard of gallic acid was used and the result of total phenolic was expressed as milligram equivalent of gallic acid per gram sample. The absorbance value represented the intensity of phenolic compound in the sample. Greater amount of phenolic compound gave higher absorbance value.
11 in methanol. DPPH became lighter in color (Figure 3) when an antioxidant scavenges free radicals by hydrogen donation that can be measured at 517 nm (Gawron-Gzella 2012). The analysis of reducing power was done by the method of ferric cyanide reducing power. Antioxidant reduced the complex of ferric cyanide to Fe2+ ion that could be detected by the formation of Prussian blue color (Figure 3)
measured at 700 nm (Sandrasari 2008). Higher absorbance value indicated greater reducing power of antioxidant.
Figure 3 (Left-right) Total phenolic assay, DPPH assay, and ferric reducing assay Total phenolic compound of five different treatments of organic fertilizer showed variation of the result ranged from 6.00 – 10.76 mg GAE/ g dry sample (wb) (Table 5). The highest total phenolic was found in PK+RP (10.76 mg GAE/ g dry sample wb) and the lowest total phenolic was found in PK+AS (6.00 mg GAE/ g dry sample wb). In sequential order the highest to the lowest total phenolic content was PK+RP, control treatment, PK+RP+AS, RP+AS, and PK+AS. Previous research conducted by Andarwulan (2010) resulted that the phenolic compound commonly found in ten indigenous vegetables among them katuk (Sauropus androgynous (L) Merr), kenikir (Cosmos caudatus H.B.K), kedondong cina (Polyscias pinnata) was ranged from 0.33 – 0.152 mg GAE/ g fresh weight and the total phenolic content of waterleaf was 0.489 mg GAE/g fresh weight. Compared to present research, the total phenolic compound was higher in the present research. Andarwulan et al. (2010) stated that the phenolic compound in waterleaf was dominated by kaempferol and very little amount of quercetin. The difference of total phenolic compound between current and previous research indicated that different solvent and method of extraction used would result in significant different amount of both kaempferol and quercetin that could be extracted from the samples. Ethanol 95 % and classical shaking maceration were used in previous research while methanol and ultrasound assisted extraction (UAE) were used in current research. UAE proved to be more effective in extracting the phenolic compound than classical maceration as previously said by Velickovic et al. (2006) in term of yielding more extractable component.
The DPPH antioxidant activity was expressed as IC50 value. IC50 value
showed the concentration of antioxidant extract from waterleaf to reduce 50 % of DPPH radical. Lower concentration indicated stronger antioxidant activity. The extract that had strongest ability to reduce 50 % of DPPH radical was RP+AS extract (1170.20 ppm) and the weakest one was PK+AS (2396.54 ppm). The result in sequential order from the strongest to the weakest based on IC50 value was
12
Table 5 Total phenolic and antioxidant activity
PK: cow manure RP: rock phosphate AS: husk ash
*mg GAE/g dry sample **mg/g dry sample
***mg AEAC/g dry sample ****mg AEAC/mg GAE
Treatment Total Phenolic* IC50 Value** DPPH
AEAC***
Ferric Reducing AEAC**
DPPH Antioxidant Activity****
Ferric Reducing Antioxidant Activity**** Control 9.75d ± 0.16 1244.12a ± 6.44 16.92c ± 0.12 0.14c ± 0.01 1.74b ± 0.04 0.015c ± 0.000 PK+RP 10.76e ± 0.06 1231.23a ± 12.85 18.65d ± 0.00 0.18e ± 0.01 1.73b ± 0.01 0.018d ± 0.001 PK+AS 6.00a ± 0.13 2349.54b ± 1.17 8.50a ± 0.10 0.01a ± 0.00 1.42a ± 0.02 0.002a ± 0.000
13 Both DPPH and ferric reducing power antioxidant activity were expressed in AEAC or Ascorbic acid Equivalent Antioxidant Activity by using vitamin C or ascorbic acid as the reference standard. The value then calculated in the basis of one gram of total phenolic to show the antioxidant activity per gram total phenolic (Table 5). The highest antioxidant activity to scavenge DPPH radical per gram total phenolic was found in RP+AS group (2.06 ± 0.01 mg AEAC/g GAE). The lowest was found in PK+AS group (1.42 ± 0.02 mg AEAC/g GAE). Control, PK+RP, PK+RP+AS treatments followed the order from the highest. While for reducing power, the group with the strongest reducing power was found in RP+AS (0.022 ± 0.00 mg AEAC/g GAE) followed by PK+RP, control, PK+RP+AS, and PK+AS. Thus could be inferred that high total phenolic content is not always resulting in high antioxidant activity, but high ability to scavenge free radical will result in high reducing power. The highest total phenolic content was found in group PK+RP (10.76 mg GAE/g dry sample), but its antioxidant was weaker in scavenging DPPH radical and reducing the ferric (1.73 mg AEAC/g GAE and 0.018 mg AEAC/g GAE) compared to RP+AS (2.06 mg AEAC/g GAE and 0.022 mg AEAC/g GAE). Thus could be inferred that the organic fertilizer treatment influenced the secondary metabolite produced in which the high antioxidant activity resulted from other components (e.g. vitamin C and carotenoid) rather than only phenolic compounds. It was found that fertilizer rich in soluble nitrogen (e.g. PK or cow manure) could decrease the ascorbic acid content since nitrogen supply increased plants’ leaf density. Carotenoid content was said not being influenced by fertilizer treatments (Zoran et al. 2014). Compared to other vegetables in previous research, the antioxidant activity of waterleaf was weaker. Kaempferol existed as the only dominated flavonoid antioxidant found in waterleaf while beluntas (Pluchea indica
Less.) and kenikir (Cosmos caudatus H.B.K) contained quercetin, miricetin instead of kaempferol (Andarwulan 2010; Sandrasari 2008). Antioxidant activity of flavonoid depended on the number and location of phenolic group –OH to neutralize free radical. Quercetin, miricetin and kaempferol had double bond on C2-C3 increasing its ability to scavenge free radical. Structure of 3,4-dihydroxyl (cathecol in B ring) in those three could act as electron donor for targeted radical (Amic et al. 2002). The amount of hydroxyl group, however, differed from one to another (quercetin=5, miricetin=6, kaempferol=4) making kaempferol had less antioxidant activity compared to quercetin and myricetin resulting that the antioxidant activity of the waterleaf was weaker among other indigenous vegetables i.e. beluntas (Pluchea indica Less.) and kenikir (Cosmos caudatus H.B.K).
Table 6 Total flavonoid of the waterleaf in different organic fertilizers (Saleh 2013)
Treatment Flavonoid (mg QE/g dry weight)
Control 10.62a ± 2.8
PK + RP 11.07a ± 3.1
PK + AS 9.10a ± 2.7
RP + AS 8.90a ± 1.2
PK + RP + AS 9.71a ± 1.6
14
Based on ANOVA (Table 5 and appendices), total phenolic value was significantly different between groups of organic fertilizer (p<0.05). The Post Hoc Duncan test showed that total phenolic value fell to five different subsets indicating that each group treatment had significant different total phenolic content with another group within five groups (p<0.05) implicating that the organic fertilization treatment might have affected the total phenolic content of waterleaf. DPPH antioxidant activity expressed per gram of phenolic content was also significantly different (Table 5) between three groups of organic fertilizer (p<0.05). The Post Hoc Test Duncan test showed that DPPH antioxidant activity fell to three different subsets. Control, PK+RP and PK+RP+AS were in the same subset while the other two treatments fell into separate subsets. Organic fertilizer affected the DPPH antioxidant activity of waterleaf but there was no significant different in control, PK+RP and PK+RP+AS treatment. While the RP+AS exhibited the highest result of DPPH antioxidant activity, reducing power antioxidant activity expressed per gram of phenolic content was significantly different (Table 5) between all groups of organic fertilizer (p<0.05). The Post Hoc Test Duncan test showed that organic fertilizer affected the reducing power antioxidant activity of waterleaf.
15 composition of nitrogen, phosphorous, and potassium should be maintained. Qualitative study of the content of bioactive component in the leaf part of waterleaf cultivated with cow manure resulted in higher content of flavonoid in control (no fertilizer) and 5 ton/ha cow manure treatment. Higher dose of cow manure decreased the flavonoid content qualitatively (Susanti et al. 2008).
Differ with inorganic fertilization, previous study conducted by Mudau et al.
(2007) in investigating the effect of inorganic fertilizer on total polyphenol content of bush tea (Athrixia phylicoides L) leaves resulted that the content of nitrogen, phosphorous, and potassium in plant leaves correlated linear with total polyphenol content: the higher nitrogen, phosphorus, and potassium, the higher total polyphenol in the leaves. Study conducted by Mualim (2009) in waterleaf cultivated with combination of inorganic and organic fertilizers (urea, KCl, cow manure, and husk ash) also found that the limiting factor in anthocyanin production was potassium. Another research conducted by Mualim (2009) showed that inorganic fertilizers result in higher total phenolic compound than organic fertilizers treatment in Talinum triangulare (Jacq.) Willd due to its nitrogen which was more readily available to be absorb in inorganic form. Thus, inferred that balance composition between nitrogen, phosphorous, and potassium should be further investigated to yield optimum total phenolic compound in cultivating waterleaf.
According to research conducted by Andarwulan (2010), yearly and geographical climate differences, soil conditions, pesticide or herbicide usage may contribute to variation in antioxidant, nutrient, and flavonoid content of the plan, but the flavonoid content was not correlated with antioxidant activity measured with DPPH and ferric reducing power in the research. Thus indicating that other polyphenols like anthocyanin and phenolic acids might influence the antioxidant activity. Phenolic compounds usually exist as polyphenols among them are flavonoids (kaempferol, quercetin, miricetin, etc), anthocyanin, and phenolic acids (ellagic acid and gallic acid) in which the presence and distribution of numerous hydroxyl group in the chemical structure of polyphenols make them excellent antioxidants due to their redox properties that allow them to act as reducing agent, hydrogen donor, and singlet oxygen quenchers. Antioxidant activity, however, is not limited to polyphenols compound only. The existence of other secondary metabolites such as carotenoids and vitamins might also contribute to the antioxidant activity of the plants (Gawron-Gzella 2002).
16
CONCLUSION AND RECOMMENDATION
Conclusion
The present research showed that the different organic fertilizer treatments significantly influenced the secondary metabolites content e.g. phenolic content of
Talinum triangulare (Jacq.) Willd (p<0.05). Total phenolic content was not always linear correlated with antioxidant activity as the highest total phenolic content group (PK+RP) had weaker antioxidant activity than thus lower in phenolic content. Organic fertilizer RP+AS (rock phosphate and husk ash) treatment exhibited the highest antioxidant activity in scavenging DPPH free radicals and strongest reducing power.
Recommendation
Had organic fertilizer treatments (control, PK+RP, PK+AS, RP+AS, PK+RP+AS) influenced significantly the total phenolic content and antioxidant activity of Talinum triangulare (Jacq.) Willd cultivated during rainy season, further research to find the optimum dose of organic fertilizer of best treatment yielding the highest antioxidant compounds needs to be done to maximize its benefit as the dietary natural antioxidant for human consumption. Identification of antioxidant polyphenols in Talinum triangulare (Jacq.) Willd can be considered to detect the dominant component (flavonoids, anthocyanins, or phenolic acid) responsible for antioxidant activity mechanism.
REFERENCES
Amic Dragan, Amid Davidovic, Beslo Trinajstic. 2003. Structure radical scavenging activity relationship of flavonoids. Original Scientific Paper.
Croatia Chemica Acta CCACAA. 76(1):55-61.
Andarwulan N, Ratna Batari, Diny AS, Bradley B, dan Hanny W. 2010. Flavonoid content and antioxidant activity of vegetables from Indonesia. Journal of Food Chemistry. 121: 1231 – 1235.
Anna IW. 2010. Produksi pucuk kolesom (Talinum triangulare (Jacq.) Willd.) pada berbagai interval panen dan frekuensi pemupukan N dan K. Skripsi. Departemen Agronomi dan Hortikultura, Institut Pertanian Bogor.
AOAC. 1999. Official Methods of Analysis of the Association of Official Analytical Chemistry. 16th Edition. AOAC International, Washington, USA., Pages: 1141.
Apak R et al. 2013. Method of measurement and evaluation of natural antioxidant capacity/activity (IUPAC technical report). Pure Applied Chemistry. Vol. 5. No5:957-998.
__________. 2007. Comparative evaluation of various total antioxidant capacity assay applied to phenolic compounds with the CUPPRAC assay. Molecules.
17 Balittanah, Balai Penelitian Tanah. 2005. Analisis Kimia Tanah, Tanaman, dan Air.
Bogor: Balittanah.
Bimakr M, Rahman RA, Saleena TF, Adzahan NM, Islam SZ, and Ganjloo A. 2013. Ultrasound-assisted extraction of valuable compounds from winter melon (Benincasa hispida) seeds. International Food Research Journal. 20 (1):331-338.
Brand-Williams W, Cuvelier ME, and Berset C. 1995. Use of a free radical method to evaluate antioxidant activity. Lebensmittel Wissenschaft und Technologie
28:25–30.
Chibueze U dan Akubugwo EI. 2011. Nutritive values and phythochemical contents of some leafy vegetables grown with different fertilizers. Agriculture and Biology Journal of North America. 2(12):1437-1444. doi:10.5251/abjna.2011.2.12.1437.1444.
Delgado R, M. Gonzales, and P. Martin. 2006. Interaction effect of nitrogen and potassium fertilization on anthocyanin composition and chromatic features of tempranillo grapes. International Journal of Vine and Wine Sciences. 40:141-150.
Ditjen PPHP Kementan. 2010. Perkembangan Trend Pemasaran Sayuran di Indonesia. Seminar Nasional PVT ke-5. Surabaya: Direktur Pemasaran Domestik Kementerian Pertanian.
Djuniwati S, HB Pullunggono, and Suwarno. 2007. Pengaruh pemberian bahan organik (Cetroscema pubescens) dan fosfat alam terhadap aktivitas fosfatase dan fraksi P tanah latosol di Darmaga Bogor. Jurnal Tanah dan Lingkungan. 9 (1):10-15.
Fadhilatunnur H. 2013. Analisis perbandingan kandungan serat pangan kolesom (Talinum triangulare (Jacq.) Willd) dengan pemupukan organik dan anorganik pada perbedaan musim. Skripsi. Departemen Ilmu dan Teknologi Pangan. Institut Pertanian Bogor.
Fenny KL, Andreanus AS, dan Immaculata M. 1996. Uji aktivitas imunostimulan daun ginseng Sumatera (Talinum triangulare Willd) leaves and Korea ginseng (Panax ginseng C.A. Mayer) leaves. Skripsi. Departemen Farmasi, Institut Teknologi Bandung.
Gardner FP and Pearce RB. 1991. Fisiologi Tanaman Budidaya. 1st Edition. Susilo H, Subiyanto, translator. Jakarta: UI Press. Translated from: Physiology of Crop Plants.
Garg S and Bahl GS. 2008. Phosphorous availability to maize as influenced by organic manures and fertilizer P associated phosphatase activity in soils.
Journal of Bioresource Technology. 99:5773-5777.
Gawron-Gzella A, Marlena DM, and Irena M. 2012. DPPH radicl scavenging activity and phenolic compound content in different leaf extract from selected blackberry species. Acta Biologica Cracoviensia Series Botanica. 52(2):32-38.
Gholizadeh A. 2011. Effect of drought on the activity of phenylalanine ammonia lyase in the leaves and roots of maize indreds. Australia Journal of Basic Applied Sciences. 5:952-956.
18
Harianja DH. 2014. Profil gula sederhana dan oligosakarida daun kolesom (Talinum triangulare (Jacq.) Willd) hasil pemupukan organik pada musim hujan. Skripsi.Departemen Ilmu dan Teknologi Pangan. Institut Pertanian Bogor.
Havlin JL, Tisdale SL, Beaton JD, Nelson WL. 2005. Soil Fertility and Fertilizer: an Introduction to Nutrient Management. 7th Edition. New Jersey: Pearson Prentice Hall.
Ho SK, Chin PT, Yin YT, Faridah A, and Chun WH. 2014. Ultrasound-asisted extraction of antioxidants in misai kucing (Orthosiphon stamineus).
Molecules. 19:12640-12659. doi: 10.3390/molecules190812640.
Ibrahim MH, Hawa ZEF, Ehsan Karimi, dan Ali G. 2013. Impact of organic and inorganic fertilizer application on the phytochemical and antioxidant activity of Kacip Fatimah (Labisia pumila Benth). Molecules. 18: 10973-10988. doi: 10.3390/molecules180910973.
Institute of Food Technologist. 2005. Functional Foods Expert Report: Opportunities and Challenges. Washington DC: IFT.
Mualim L, Sandra Arifin Aziz, Slamet Susanto, and Maya Melati. 2012. Aplikasi pupuk inorganic meningkatkan produksi dan kualitas pucuk kolesom pada musim hujan. Jurnal Agronomi Indonesia. 40 (2): 160-166.
Mualim L, Sandra Arifin Aziz, and Maya Melati. 2009. Kajian pemupukan NPK dan jarak tanam pada produksi antosianin daun kolesom. Jurnal Agronomi Indonesia. 37(1):55-61.
Mudau FN, P Soundy, ES du Toit. 2005. Variation in polyphenolic content of
Athrixia phylicoides (L.) (bush tea) leaves with season and nitrogen application. South African Journal of Botany. 72(3):398-402. doi: 10.1016/j.sabj2005.10.007.
Munawar A. 2011. Kesuburan Tanah dan Nutrisi Tanaman. Bengkulu: IPB-Press. Nugroho YA. 2000. Khasiat dan keamanan som jawa (Talinum paniculatum
Gaertn.) dan kolesom (Talinum triangulare Wild) http://digilib.sith.itb.ac.id/ Accessed: 1 June 2014.
Oyaizu M. 1986. Studies on products of browning reaction: antioxidative activity of products of browning reaction prepared from glucosamine. Japanese Journal of Nutrition. 44:307–315.
Pickering HW, Menzies NW, and Hunter MN. 2002. Zeolite/prosk phosphate- a novel slow release phosphorous fertilizer for potted plant production. Scientia Horticulturae 94:333-343.
Prabekti YS. 2012. Kandungan serat pangan daun kolesom (Talinum triangulare
(Jacq.) Willd) pada budidaya dengan pemupukan organik dan anorganik.
Skripsi. Bogor: Institut Pertanian Bogor.
Rivero RM, JM Ruiz, PC Garcia, LR Lopez-Lefebre. E Sanchez, and L Romero. 2001. Resistance to cold and heat stress: accumulation of phenolic compounds in tomato and watermelon plants. Plant Sciences. 160:315-321. Saleh I. 2013. Pertumbuhan, produksi, dan kadar metabolit pucuk kolesom
(Talinum triangulare (Jacq.) Willd) dengan pemupukan organik berulang.
Tesis. Bogor: Institut Pertanian Bogor.
19 SEAFAST Center IPB. 2013. Hidangan dari Daun Kolesom. Bogor: SEAFAST
Center IPB.
Shetty K, Curtis OF, Levin RE, Witkowsky R and Ang W. 1995. Prevention of vitrification associated with in vitro shoot culture of oregano (Origanum vulgare) by Pseudomonas spp. Journal of Plant Physiology 147:447-451. Solichatun, Endang Anggarwulan, and Widya Mudyantini. 2005. Pangaruh
ketersediaan air terhadap pertumbuhan dan kandungan bahan aktif saponin tanaman ginseng jawa (Talinum paniculatum Gaertn.). Biofarmasi. 3(2):47-51.
Susanti H, Sandra Arifin Aziz, and Maya Melati. 2008. Produksi biomassa dan bahan aktif kolesom (Talinum triangulare (Jacq.) Willd dari berbagai asal bibit dan dosis pupuk kandang ayam. Buletin Agronomi 36(1):48-55. Tabaraki R and Shahrbanoo Rastgoo. 2014. Comparison between conventional and
ultrasound-assisted extractions of natural antioxidants from walnut green husk. Korean Journal of Chemical Engineering. 31(4):676-683.
Velickovic Dragan T, Milena TN, Stephanie VI, Jelena BS, dan Vlada BV. 2006. Extraction of flavonoids from garden (Salvia officinalis L.) and glutinous (Salvia glutinosa L.) sage by ultrasonic and classical maceration. Journal of Serbian Chemistry Society. 72(1):73-80. doi: 10.2298/JSC0701073V. Zhao Xin. 2006. Exploring the effect of high tunnels and organic production system
on production and quality attributes of leafy vegetables in Kansas. Disertasi. Manhattan, Kansas: Kansas State University.
20
APPENDICES
Appendix 1 Moisture content of waterleaf in five different treatment of organic fertilizer
Treatment
Moisture content of dry sample (%) wb Average of moisture content of fresh
sample (%) wb
1 2 Average ± SD
Control 7.82 7.98 7.90 ± 0.11 90.82
PK+RP 5.68 5.49 5.58 ± 0.13 90.56
PK+AS 6.67 6.45 6.56 ± 0.15 91.01
RP+AS 7.99 8.00 8.00 ± 0.01 91.47
21 Appendix 2 Preparation of standard reference solution
1. Preparation of Gallic Acid Standard for Total Phenolic Assay
Stock solution of 250 ppm of gallic acid standard was made by dissolving 62.5 mg powdered gallic acid with distilled water into 250 mL volumetric flask until tared.
2. Preparation of Ascorbic Acid Standard for DPPH Assay
Stock solution of 250 ppm of ascorbic acid standard was made by dissolving 62.5 mg powdered ascorbic acid with distilled water into 250 mL volumetric flask until tared. The solution kept in dark bottle in the refrigerator to keep it stable until used.
22
Appendix 3 Preparation of chemical reagent 1. Folin-Ciocalteau 50 %
Mixed 50 mL Folin-Ciocalteau stock with 100 mL distilled water to make Folin-Ciocalteau 50%.
2. Sodium Carbonate (Na2CO3) 7.5 %
Dissolved 7.50 g powdered sodium carbonate with distilled water into 100 mL volumetric flask until tared.
3. DPPH-methanol solution 0.1 mM
To make 100 mL DPPH_methanol solution 0.1 mM, dissolved 0.0039 grams powdered DPPH with methanol PA into 100 mL volumetric flask until tared.
0.1 mM=X milligrams394.32 g/mol x 100 mL1000
X grams=0.0039 grams
4. Phosphate buffer (0.2 M; pH 6.6)
Dissolved 3.5598 grams of Na2HPO4.2H2O with distilled water into
100 mL volumetric flask until tared (A solution). Dissolved 3.1202 grams of NaH2PO4.2H2O with with distilled water into 100 mL volumetric flask
until tared (B solution). Mixed 37.5 mL of A solution with 62.5 mL of B solution.
5. Potassium Ferric Cyanide (K3[Fe(CN6)]) (10 mg/mL)
Dissolved 0.5 grams of K3[Fe(CN6)] with distilled water into 50 mL
volumetric flask until tared.
6. Trichloroacetic acid (TCA) 100 mg/mL
Dissolved 5 grams of TCA with distilled water into 50 mL volumetric flask until tared.
7. Ferric chloride (FeCl3) (10 mg/mL)
Dissolved 0.5 grams of K3[Fe(CN6)] with distilled water into 50 mL
23 Appendix 4 Total phenolic content
Treatment Absorbance
Concentration mg/L
Concentration mg GAE/g dry sample
(db)
1 2 1 2 1 2
Control 0.573 0.560 107.13 104.63 10.71 10.46 PK+RP 0.607 0.611 113.67 114.44 11.36 11.44 PK+AS 0.350 0.349 64.25 64.01 6.43 6.40 RP+AS 0.432 0.432 80.02 80.02 8.00 8.00 PK+RP+AS 0.514 0.517 95.79 96.37 9.58 9.64
Treatment
Concentration mg GAE/g dry sample
(wb)
Average mg GAE/g dry sample
Average mg GAE/g fresh sample (wb)
1 2 wb db
Control 9.86 9.63 9.75 10.59 97.77
PK+RP 10.72 10.80 10.76 11.40 107.95
PK+AS 6.01 5.98 6.00 6.42 60.15
RP+AS 7.36 7.36 7.36 8.00 73.84
24
Appendix 5 Gallic acid standard curve
y = 0,0053x - 0,0205 R² = 0,9979
-0,2 0 0,2 0,4 0,6 0,8 1 1,2 1,4
0 50 100 150 200 250 300
A
bs
or
ban
ce
Concentration (ppm, mg/L)
Gallic Acid Standard Curve 1
y = 0,0052x + 0,0159 R² = 0,9988
0 0,2 0,4 0,6 0,8 1 1,2 1,4
0 50 100 150 200 250 300
A
bs
or
ban
ce
Concentration (ppm, mg/L)
25 Appendix 6 Ascorbic acid standard curve for DPPH
Concentration
Standard Curve of Ascorbic Acid 1
26
Appendix 7 Antioxidant activity by DPPH Control group Concentration
(mg/L)
Absorbance Percent of Inhibition (%)
Example of IC50 Value Determination
1. Determining the percent of inhibition with the formula
Antioxidant Capacity=(A Blank Sample-A Sample)A Blank Sample x 100%
2. IC50 value was determined by plotting the concentration values n x axis
and percent of inhibition values on y axis when the linear equation was obtained.
0 500 1000 1500 2000 2500
27
Example in Determining AEAC Value:
1. Determine the concentration of the sample (1000mg/L in this case)
2. Calculate the equivalency with vitamin C by using the standard curve of vitamin C. First, calculate the delta of absorbance of the sample.
Concentration (ppm)
Absorbance Delta of Absorbance
1 2 1 2
0 0.828 0.828 0 0
1000 0.447 0.445 0.381 0.385
3. Calculate the concentration of equivalency with vitamin C
Linear equation of standard curve of vitamin C: Y=0.0224x + 0.0003 Concentration
(ppm)
Absorbance Delta of Absorbance
1 2 1 2
0 0.828 0.828 0 0
1000 0.447 0.445 0.381 0.385
Equivalency with Vitamin C 17.00 mg/L 17.17 mg/L 4. Put into formula: 5. Calculate the mean and standard deviation
y = 0,0357x + 5,3048
0 500 1000 1500 2000 2500
28
Appendix 8 Antioxidant activity by DPPH PK+RP group Concentration
(mg/L)
Absorbance Percent of Inhibition (%) Delta of Absorbance
0 500 1000 1500 2000 2500
P
IC50 Value of PK + RP Treatment (1)
y = 0,0376x + 4,0476
0 500 1000 1500 2000 2500
P
29 Appendix 9 Antioxidant activity by DPPH PK+AS group
Concentration (mg/L)
Absorbance Percent of Inhibition (%)
0 1000 2000 3000 4000 5000
P
IC50 Value of PK + AS Treatment (1)
y = 0,0188x + 4,961
0 1000 2000 3000 4000 5000
P
30
Appendix 10 Antioxidant activity by DPPH RP+AS group Concentration
(mg/L)
Absorbance Percent of Inhibition (%)
0 500 1000 1500 2000 2500
P
IC50 Value of RP + AS Treatment (1)
y = 0,0382x + 5,5083 R² = 0,983
0,00 50,00 100,00
0 500 1000 1500 2000 2500
P
31 Appendix 11 Antioxidant activity by DPPH PK+RP+AS group
Concentration (mg/L)
Absorbance Percent of Inhibition (%)
0 200 400 600 800 1000 1200
P
0 500 1000 1500 2000 2500
32
Appendix 12 Antioxidant activity by DPPH AEAC
Treatment
Delta of Absorbance
Equivalency with Vitamin C
AEAC (mg AEAC/g
dry sample) Mean ± SD
1 2 1 2 1 2
Control 0.381 0.385 17.00 17.17 16.83 17.00 16.92 ± 0.12 PK + RP 0.418 0.418 18.65 18.65 18.65 18.65 18.65 ±
0.00 PK + AS 0.193 0.196 8.60 8.74 8.43 8.57 8.50 ±
0.10 RP +AS 0.339 0.342 15.12 15.25 15.12 15.25 15.18 ±
0.09 PK + RP
+ AS
33 Appendix 13 Antioxidant activity by ferric reducing assay AEAC
Treatment Absorbance
Equivalency with
Vitamin C (mg/L) Volume (mL)
W extract (mg)
1 2 1 2
Control 0.767 0.753 16.05 15.51 10 78.2
PK + RP 0.843 0.830 19.00 18.49 10 53.7
PK + AS 0.382 0.388 1.13 1.36 10 72.5
RP +AS 0.806 0.807 17.56 17.60 10 58.9
PK + RP + AS 0.549 0.542 7.60 7.33 10 67.0
Treatment AEAC (mg AEAC/g extract)
AEAC (mg AEAC/g dry
sample) Mean ± SD
1 2 1 2
Control 2.05 1.98 0.15 0.14 0.14 ± 0.01
PK + RP 3.54 3.44 0.19 0.18 0.18 ± 0.01
PK + AS 0.16 0.19 0.01 0.01 0.01 ± 0.00
RP + AS 2.98 2.99 0.16 0.16 0.16 ± 0.00
34
Appendix 14 One Way ANOVA Total Phenolic Content
ANOVA
Value
Sum of Squares df Mean Square F Sig.
Between Groups 28,692 4 7,173 1160,674 ,000
Within Groups ,031 5 ,006
Total 28,723 9
Homogeneous Subsets
Value
Duncan
Treatment N Subset for alpha = 0.05
1 2 3 4 5
PK+AS 2 5,9950
RP+AS 2 7,3600
PK+RP+AS 2 8,8500
Control 2 9,7450
PK+RP 2 10,7600
Sig. 1,000 1,000 1,000 1,000 1,000
Means for groups in homogeneous subsets are displayed.
a. Uses Harmonic Mean Sample Size = 2,000.
Descriptives
Total Phenolic Content
N Mean Std.
Deviation
Std.
Error
95% Confidence Interval for
Mean
Minimu
m
Maximu
m
Lower Bound Upper Bound
Control 2 9,7450 ,16263 ,11500 8,2838 11,2062 9,63 9,86
PK+RP 2 10,7600 ,05657 ,04000 10,2518 11,2682 10,72 10,80
PK+AS 2 5,9950 ,02121 ,01500 5,8044 6,1856 5,98 6,01
RP+AS 2 7,3600 ,00000 ,00000 7,3600 7,3600 7,36 7,36
PK+RP+AS 2 8,8500 ,02828 ,02000 8,5959 9,1041 8,83 8,87
35 Appendix 15 One Way ANOVA DPPH IC50
Descriptives
IC 50 DPPH
N Mean Std.
Deviation
Std. Error 95% Confidence Interval for
Mean
Minimu
m
Maximu
m
Lower Bound Upper Bound
Control 2 1244,1250 6,44174 4,55500 1186,2482 1302,0018 1239,57 1248,68
PK+RP 2 1231,2300 12,85520 9,09000 1115,7306 1346,7294 1222,14 1240,32
PK+AS 2 2349,5450 1,16673 ,82500 2339,0624 2360,0276 2348,72 2350,37
RP+AS 2 1170,2000 7,77817 5,50000 1100,3159 1240,0841 1164,70 1175,70
PK+RP+AS 2 1303,4250 265,53981 187,76500 -1082,3555 3689,2055 1115,66 1491,19
Total 10 1459,7050 479,37862 151,59283 1116,7782 1802,6318 1115,66 2350,37
ANOVA
Within Groups 70780,004 5 14156,001
Total 2068234,746 9
Means for groups in homogeneous subsets are displayed.
36
Appendix 16 One Way ANOVA DPPH AEAC
Descriptives
Value
N Mean Std.
Deviation
Std. Error 95% Confidence Interval for
Mean
Minimum Maximum
Lower Bound Upper Bound
Control 2 16,9150 ,12021 ,08500 15,8350 17,9950 16,83 17,00
Means for groups in homogeneous subsets are displayed.
37 Appendix 17 One Way ANOVA DPPH/Total Phenolic
Descriptives
Value
N Mean Std.
Deviation
Std. Error 95% Confidence Interval
for Mean
Minimum Maximum
Lower
Bound
Upper
Bound
Control 2 1,7350 ,00707 ,00500 1,6715 1,7985 1,73 1,74
PK+RP 2 1,7300 ,00000 ,00000 1,7300 1,7300 1,73 1,73
PK+AS 2 1,4200 ,01414 ,01000 1,2929 1,5471 1,41 1,43
RP+AS 2 2,0600 ,01414 ,01000 1,9329 2,1871 2,05 2,07
PK+RP+AS 2 1,7200 ,04243 ,03000 1,3388 2,1012 1,69 1,75
Total 10 1,7330 ,21406 ,06769 1,5799 1,8861 1,41 2,07
ANOVA
Value
Sum of Squares df Mean Square F Sig.
Between Groups ,410 4 ,103 227,867 ,000
Within Groups ,002 5 ,000
Total ,412 9
Value
Duncan
Treatment N Subset for alpha = 0.05
1 2 3
PK+AS 2 1,4200
PK+RP+AS 2 1,7200
PK+RP 2 1,7300
Control 2 1,7350
RP+AS 2 2,0600
Sig. 1,000 ,521 1,000
Means for groups in homogeneous subsets are displayed.
38
Appendix 18 One Way ANOVA Ferric Reducing Power
Descriptives
Value
N Mean Std.
Deviation
Std. Error 95% Confidence Interval for
Mean
Minimum Maximum
Lower Bound Upper Bound
Control 2 ,1450 ,00707 ,00500 ,0815 ,2085 ,14 ,15
Means for groups in homogeneous subsets are displayed.
39 Appendix 19 One Way ANOVA Ferric Reducing Power/Total Phenolic
Descriptives
Value
N Mean Std.
Deviation
Std.
Error
95% Confidence Interval for
Mean
Minimum Maximu
m
Lower Bound Upper Bound
Control 2 ,01500 ,000000 ,000000 ,01500 ,01500 ,015 ,015
PK+RP 2 ,01750 ,000707 ,000500 ,01115 ,02385 ,017 ,018
PK+AS 2 ,00200 ,000000 ,000000 ,00200 ,00200 ,002 ,002
RP+AS 2 ,02200 ,000000 ,000000 ,02200 ,02200 ,022 ,022
PK+RP+A
S 2 ,00800 ,000000 ,000000 ,00800 ,00800 ,008 ,008
Total 10 ,01290 ,007475 ,002364 ,00755 ,01825 ,002 ,022
ANOVA
Value
Sum of Squares df Mean Square F Sig.
Between Groups ,001 4 ,000 1256,000 ,000
Within Groups ,000 5 ,000
Total ,001 9
Value
Duncan
Treatment N Subset for alpha = 0.05
1 2 3 4 5
PK+AS 2 ,00200
PK+RP+AS 2 ,00800
Control 2 ,01500
PK+RP 2 ,01750
RP+AS 2 ,02200
Sig. 1,000 1,000 1,000 1,000 1,000
Means for groups in homogeneous subsets are displayed.
40
AUTHOR BIOGRAPHY
Stella Alinneshia, God’s favor receiver and a fully blessed lady, was born in Kendal, October 29th 1991 as the first children and daughter of Canggra Winarto and Juli Nurmala. Always love to study, she began the school at the age of 3.5 years old. Best graduate from this small village on the mountainous area SD Kanisius Sanjaya Padma, Sukorejo-Kendal succeeded in entering the best middle school in urban area: SMP Negeri 1 Kudus even always ranked on the top three of her class. Life brought her to SMA Negeri 1 Kudus where she for the first time became aware for her life calling. She was granted as Kennedy Lugar Youth Exchange and Study Scholarship recipient from US Department of State spending a year of her high school in US Middletown High School, Middletown OH graduated summa-cumlaude. Destiny walked her to Bogor Agricultural University in 2010 to ignite the zest in the field of Food Science and Technology. She was in the choir for KATA PMK IPB 2010 and an active member of IAAS-LC IPB since 2010 where she hold the role as IOP batch 18 leader and secretary of Exchange Program Department. Her interest in children, education, and community development brought her to diaspora commission of PMK IPB where for 1.5 years she involved in giving bible study and teaching elementary school children in Kracak village. In 2012, she finished the short course of The Comprehensive International Education Program from Tokyo University of Agriculture gained perfect 4.00 GPA. Her interest in social entrepreneurship fetched her to be the semifinalist in Danone Young Social Entrepreneur (DYSE) 2013.
Her team was the 1st winner of the 2nd Indonesian Food-Bowl Quiz and 2nd Runner Up-2 at ASEAN Undergraduate Food Quiz Bowl Competition 2013 in ASEAN Food Conference, Singapore. Other remarkable milestones were 4th place at the 11th National Student Paper Competition 2013, “Mahasiswi Berprestasi di
Bidang Ekstrakurikuler IPB 2013”, IPB head delegate for SUIJI-Service Learning Program Re-inventing Japan Project at Kagawa University 2013, International IPB Goes to Field (IGTF) participant in 2014, and paper presenter during the 14th
International Student Summit on Food, Agriculture, and Environment in New Century in 2014 at Kasetsart University, Thailand. Her interest in sustainable development issue recently made her to set up Trashsure Foundation with her SUIJI fellas to educate elementary school children about protecting environment through the project of Sekolah Sampah.
She had been the grantee of National Champion Scholarship from Tanoto Foundation since 2011. She was “Mahasiswa Berprestasi I IPB 2014” and “Mahasiswa Berprestasi IV tingkat nasional 2014” selected by DIKTI, one of 60 highly selected student of Young Leaders for Indonesia (YLI) wave 6 by McKinsey and Company, the 1st International Winner in the Developing Solutions for