155
Optimum Workspace Design in A Plug Assembly
Line
Adi Saptari, Seri Rahayu Kamat, Wan Hasrulnizzam Wan Mahmood, Isa Halim
Faculty of Manufacturing Engineering
Universiti Teknikal Malaysia Melaka, Locked Bag 1200, Ayer Keroh, 75450 Melaka Tel: +606-2333412, Fax: +606-233241
e-mail: [email protected]
Abstract-- In most industry, assembly line job environments such as workstation design is one of key factors contribute to workers’ performance. Workstation design such as: standing or sitting, the use of tools such as jig and the height of working table are influencing worker’s productivity. This research is an attempt to investigate the effect workstation design factors to assembly time. Workstation factors include Workers, Position: standing or sitting, Table-height, and Tools: with Jig and without Jig to assemble an electrical appliance (a plug).
Design of experiment of 24 i.e. two level of each factors is used.
Two subjects were employed to conduct the experiments. 36 experiments for each level of factors were done, 288 experiments for 8 different sets were conducted for each subject. The results show that Tool in this case the use of Jig and Table, have significant effect to the response time (assembly time) and interaction of three factors: Tool, Table, and Position have significant influence on the assembly time.
Keywords: Optimum, Productivity, Workstation Design, Ergonomics, Factor, Table, Position, Jig, and Assembly-time.
I. INTRODUCTION
Workstation design is one of the major areas in which human factors or Ergonomics professional can help improve the fit between human, machine and environment. Good design of workstation considering the human factor anthrophometry data to make workstation that is comfortable and support productivity improvement. Productivity in assembly line determined by many variables, among others:
a.Skill of the workers;
b.Design of equipment or tools; c.Design of workstation; and d.Design of assembly process.
Productivity improvement can be upgraded or enhanced by controlling variables, which contribute to the productivity. In most industry, assembly line job environments such as workstation design including working position such as: standing or sitting, the use of tools such as jig and the height of working table are influencing workers’ performance.
Most of jobs environment in industry applies standing or seated work. Standing workstations are usually applies when job requires workers to do activities that need frequent movements, handle heavy or large objects or exert large forces. Whereas seated workstation is chosen usually for long-term duration job. A seated workstation allows
better controlled on arm movements provides a stronger sense and balance. Standing posture, however prolonged standing could be stressful that put excessive load to the body and may lead to body accumulation in the legs [11].
Additional tool, such as jig, is designed to help workers’ performance to do the job easier, faster and more comfortable. However, jig may also hinder some workers in doing their job, if the design of the jig is not suitable to the workers. Design of jig should such that help worker in performing their job and more productive.
Table height of an assembly line may contribute to performance of workers when position is either standing or sitting. There are researches regarding the types of works and the height ideally for workers. Grandjean, 1988 [11], has made exploration work surface height for different kinds of jobs. He proposed precision work for men should be set at 100-110 cm, light work around 90-95 cm and heavier work around 75-90 cm.
Previous works [6] [1] [5] [3] explain that productivity may also be improved by applying the principles of ergonomics in the job environments, more specific workstation design. Poor workstation design contributes to lower productivity. The studies discuss ergonomics intervention may improve productivity, quality, operators’ working condition, occupational health and safety (OHS), and even cost effectiveness. The areas of interest of working environment studied include workplace layouts, working tables and chairs of appropriate height, fixing hand-tools, better lighting and job rotation and also working postures.
Other studies [8], [12], [7], reported concerning workstation design assessment in different types of industry as oppose to productivity. Other aspect studied were the musculoskeletal load and exertion associated with different design of workstation. The results of the evaluation formed on a basis of recommendation for an improvement of workstation design.
This paper will discuss how different designs of workstation contribute to variety of workers’ productivity. For the purpose of this research a plug, product of small medium electrical appliances industry, was used. Different sets of workstation design were assessed to see their impact to assembly time. Table height was reportedly for previous study affect the productivity, two sets of height table design used, and Position of workers either standing or sitting were set. A special designed jig for assemble was created. This study also discusses the effect of Tool design whether it contributes to worker productivity. .
II. OBJECTIVE
The objective of this research is to explore:
i. effect of different workstation designs i.e. different height of the table and different position of the worker standing or sitting to the response time;
ii. effect of using Tool in this case a jig in assembly line to the response time;
iii. optimum setting of workstation design with
considering factors: table height, position of work: standing or sitting and the use of tool: jig.
III. METHOD
3.1 Design of Experiment
There are four factors to be tested to see the effect of each the factor to the productivity in this case the time needed to finish the job (assembly time). These factors are: 1) Table height; 2) Position of subjects, standing or sitting; and 3) Tools, using Jig and without Jig, and 4) Operator.
For table height is set to. 91 cm and 103 cm. These sets were based on literatures on working environment needed for light work and precision work based on study recommended by Grandjean, 1988 [1].
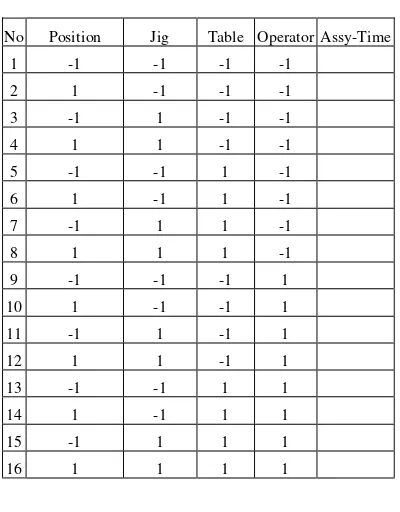
The design of experiment for this particular setting is 2x2x2x2 (24). Each factor has two level sets, Table height is set is –1 and 1 for 91 cm and 103 cm respectively, Tools is set –1 for without Jig and 1 for jig, Position is set –1 for standing and 1 for sitting and lastly the subject #1 is set –1 and sebject#2 is 1.
3.2 Subjects
Two subjects participated in these experiments. They were chosen based on their working past performance, they have been showing a constant quality of work during their period of jobs, both of them are still young age around 28 years
Table 1
Design of Experiment 2x2x2x2
No Position Jig Table Operator Assy-Time plugs. Number of experiments for each different level and set (Table, Tool, and Position) are 36 experiments. There are 8 different ways of doing the experiments. Every plug has 7 components. The process of assemble has been designed such that the sequence of picking the components follows the order.
The response time, time needed to finish the assembly, is recorded by using stopwatch. The first data recorded is when subject has done certain amount of experiments such that the subject already comfortable in doing his job, and the time also shows a constant rate. In other word, the subjects have achieved learning curve.
3.4 Tools:
List of tools used for this research as follows:
1) Screw driver powered by air pressure. This Screw driver can be operated to move clock wise and anti clock wise;
2) A stop watch to record assembly time of a plug;
3) CATIA software;
4) A pen and table paper to document the response time.
5) Adjusted table height.
6) A chair for subject to seat while working;
7) A jig designed to accommodate four plugs at a time, see Figure 1;
157
Figure 1: Design of Jig
3.5 Standing Position
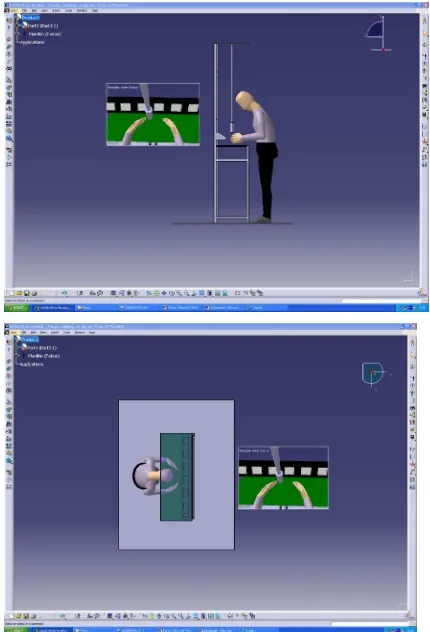
Figure 2 and Figure 3 show the isometric, front, side and top views as well as vision of a subject (inset) while performing the task in standing position. In both positions, the table height is adjusted to 91 cm and 103 cm.
Figure 2: Standing position, isometric view (up) and front view (down)
Figure 3: Standing position, side view (up) and top view (down)
3.6 Sitting Position
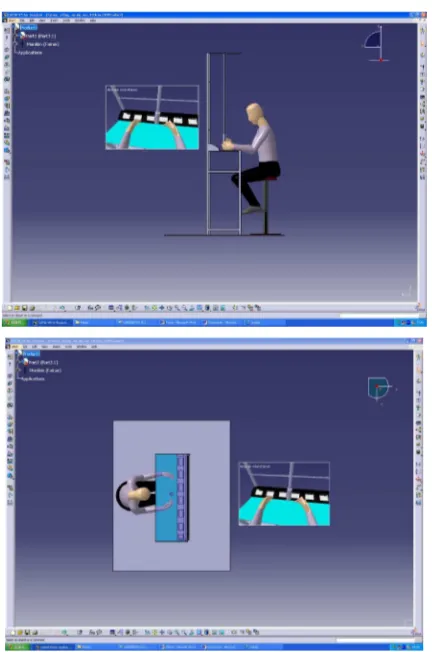
Figure 4, 5 and Figure 6 illustrate the isometric, front, side and top views as well as vision (inset) of a subject performing the task in sitting position. The table height is adjusted to 91 cm and 103 cm in both positions.
Figure 4: Sitting position, isometric view
Figure 5: Sitting position, front view
Figure 6: Sitting position, side view (up) and top view (down)
IV. RESULTS
The First test is to verify whether two subjects have different quality of work, or performance. This is necessary to make sure the inferences made from the results may work for both subjects. The T test for single factor were conducted to see any significant different between two subjects. Both tests show that there is not any significant different between two subjects mean performance. T Stat
Table 3 shows descriptive statistics result of different setting workstation design for subject # 1. F-1 means the experiment set is using Table height 91 cm, Tool: Without Jig, and Position: Standing; F-2 Position change to Sitting the rest are the same; F-3 Tool: use Jig; and Position: Standing; F-4 Position change to Sitting. F-5 the same with setting F-1 except Table height change to 103 cm; F-6, F-7, and F-8 are followed. It points up that different sets present a range of mean and standard deviation. First assessment of the results may conclude that position of subject either standing or sitting (assuming other factors Table and Tools in the same set) does not provide significant different. For example at position Table 91 cm and No Jig, standing and sitting provides 30.69 sec and 30.24, while with jig standing and sitting gives 27.09 sec and 23.62 sec. First evaluation shows the present of tool gives significant different to the assembly time. For instance the average of using No Jig and Jig 30.46 sec compare to 25.35 sec. for Table set 91 cm, and 35.06 sec compare to 26.67 sec for Table 103 cm. While different set of Table i.e. Table 91 cm and 103 cm provides mean 27.91 sec compare to 30.86 sec.
Table 2:
t-Test: Paired Two Sample Means
Subject#2 Subject#1
Mean 29.66451 29.38656
Variance 30.38457 45.73449
Observations 288 288
Pearson Correlation 0.011985
Hypothesized
Mean Difference 0
Df 287
t Stat 0.543854
P(T<=t) one-tail 0.293482
t Critical one-tail 1.65018
P(T<=t) two-tail 0.586964
t Critical two-tail 1.968264
Table 3
Descriptive statistics of Results Subject #1
F-1 F-2 F-3 F-4 F-5 F-6 F-7 F-8
Mean 30.69 30.24 27.09 23.62 38.07 32.05 26.00 27.33 Std.
Error 1.19 1.25 0.39 0.27 1.29 0.95 0.75 0.36
Median 29.01 27.82 27.35 24.03 37.84 31.78 27.21 26.94 Std.
Deviatio
n 7.12 7.47 2.33 1.61 7.73 5.68 4.52 2.19
Sample
Variance 50.71 55.85 5.44 2.61 59.76 32.28 20.40 4.79
Range 36.45 30.49 8.27 5.16 27.57 28.94 16.20 6.99
Minimu
m 21.19 20.97 23.78 20.54 24.26 21.12 15.10 23.14
Maximu
159
For subject # 2, the results (see Table 4) are slightly different compare to subject # 1. For example the Mean for various setting of table and without jig, standing and sitting position provides 22.88 sec compare to 25.55 sec. While using jig, standing and sitting provides 35.52 sec compare to 27.41 sec. These two results show non consistent for position, on the first set sitting is slower compare to the second one, this may be due to using jig and no jig. Further investigation should be carried on which factors contribute more in reducing or increasing assembly time.
Table 4 shows descriptive statistics results of Subject #2. It shows more consistent in terms of assembly time, it can be seen from the standard of deviation, there are not much different.
Table 4
Descriptive statistics of Results Subject #2
A-1 A-2 A-3 A-4 A-5 A-6 A-7 A-8 however most of the standard deviation for subject #2 (A) are less than Subjects# 1, it shows more consistent in assembly time.
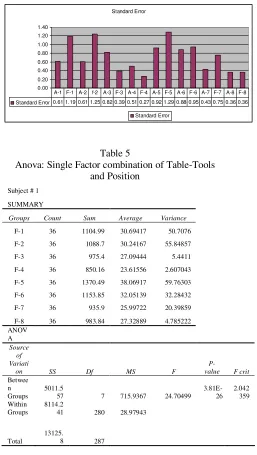
Further investigation is to observe whether there is a significant different among the setting of experiments, Analysis of Variance (ANOVA) for with single factor for first subject (Subject #1) and also subject #2 were used. The F Test for both subjects show there exist a significant different among the setting of the experiments, meaning different position, the height of table and the use of Jig and no Jig, contribute to significant different to the response time (assembly time). Table 5 and 6 shows the ANOVA analysis for single factor of subject #1 and #2.
Figure 7 Mean of two subjects for different set of factors
Mean 22.8 30.6 25.8 30.2 32.5 27.0 27.4 23.6 31.6 38.0 29.6 32.0 31.9 26.0 35.4 27.3
A-1 F-1 A-2 f-2 A-3 F-3 A-4 F-4 A-5 F-5 A-6 F-6 A-7 F-7 A-8 F-8
Figure 8 Standard errors of two subjects for different set of factors (in second)
Standard Error 0.61 1.19 0.61 1.25 0.82 0.39 0.51 0.27 0.92 1.29 0.88 0.95 0.43 0.75 0.36 0.36
A-1 F-1 A-2 f-2 A-3 F-3 A-4 F-4 A-5 F-5 A-6 F-6 A-7 F-7 A-8 F-8
Table 5
Table 6: Anova: Single Factor
Further analysis to investigate which factors contribute more significant than the others, and which interaction between factors, that provide significant contribution to assembly time. Factorial Design analysis is applied to distinguish the factors and each interaction. Four factors are being investigated simultaneously i.e. Table, Tool, Position and Subjects.
The mathematical model for 2x2x2x2 factorial experiments with 10 observations per cell run as follow:
Yijkl = µ +Ai + Bj + ABij + Ck + ACik + BCjk + ABCijk + Dl + ADil +BDjl + CDkl + ABDijl+ ACDikl + BCDjkl ABCDijkl
Since from previous observation found out that the effect of subject is not significant, so the research only interested to find out the interaction of only three factors namely Table, Tool and Position, so the model would be:
Yijkl = µ +Ai + Bj + ABij + Ck + ACik + BCjk + ABCijk + Dl
Table 7 illustrates the result of Analysis of Variance for each factors Table, Tool, and Position and its interaction of two ways and three ways to the various response time (assembly time). Among single factors, Table height is a significant factor with level of significance at 0.05. Two sets of table-height one is 91 cm (non-precision) and the other 103 cm. The latest is more suitable for the job, this may due to the height the subjects such that working with this height is more suitable.
Combination factors of two: Tools (jig) Table, and Tool
-Table 7 Factorial Fit: Assy=Time versus Position, Jig, Table, Operator
Estimated Effects and Coefficients for Assy=Time (coded units.)
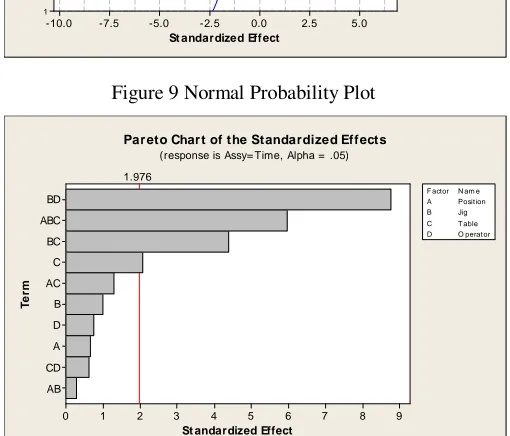
Term Effect Coef SE Coef T P combination ABC (Table, Jig and Position) are significant factors to response time.
St andardized Effect
N ormal Probability Plot of the Standardized Effects
(response is Assy= Time, Alpha = .05)
Figure 9 Normal Probability Plot
T
Pareto Chart of the Standardized Effects
161
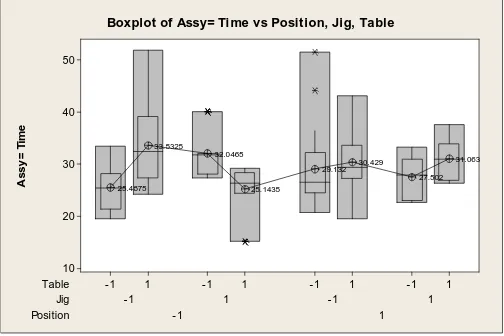
Further investigation is on which setting of combination factors contribute to the lowest assembly time. Figure 11 Box plot of assembly time shows that the lowest average assembly time was achieved at the setting of Table 103 cm height, Using Tool: Jig, and Position is standing, the assembly time is 25.1435 second. This combination also produces the lowest assembly time i.e. 15.10 second and the lowest upper bound around 29 second.
A
Boxplot of Assy= Time vs Position, Jig, Table
Figure 11 Box Plot for Assembly Time
V. CONCLUSION AND FURTHER RESEARCH
Significant findings pertinent to the impact of various condition of workstation design to response time (assembly time). The following findings are concluded:
(i) Among the single factors: Table, Tool, and
Position, the Table height has significant
contribution to the assembly time with
significance level 0.05.
(ii) Among combinations of two factors, the result
showed the Tool (jig) and Operator have important effect to the assembly time, this shows that the design of jig helps the worker to perform their jobs.
(iii) Other two combination factor Tool and Table also
demonstrates an important factor to assembly time. This restates the finding before.
(iv) The combination factors of three: Table-height, Tool and Position have significantly help subjects in performing their jobs. It has shown statistically this combination factor is a significant contributor to the Response time (assembly time).
(v) Among the setting of experiments, the optimum
setting that gives the lowest average assembly time is the combination of Table height 103 cm, use of Tool (jig) and Position of working standing.
There are some areas need to explore further, among others are:
1) Design of jig was chosen can handle 4 plugs at the same time, the optimum number should be
investigated, how many is the optimum plugs that give the shortest assembly time;
2) Design of assembly process, can be explored further whether two or three series of subjects would be better than single subject finish the job.
3) Design of product itself can be investigated further, the number of components would play significant contribution the response time.
VI. ACKNOWLEDGEMENT
The authors would acknowledge the University Industry Centre and Faculty of Manufacturing Engineering of UTeM for funding this research under Short Term Grant Research No: PJP/2005/FKP (17).
VII. REFERENCES
[1] P.H.P Yeow, and Rabindra Nath Sen, Quality, productivity, occupational Health and safety and cost effectiveness of ergonomic improvements in the test workstation of an electronic factory, . International Journal of Industrial Ergonomics, vol 32 (3), p. 147-163, 2003.
[2] K.Kogi, Tsuyoshi Kwakami, Toru Itani and Jose Maria Batino. Low-cost work improvements that can reduce the risk of musculoskeletal disorders. International Journal of Industrial Ergonomics, 31 (3), p. 179-184, 2003.
[3] A.Choobineh, Mostafa Hosseini, Mohammad
Lahmi, Reza Khani Jazani and Houshang.
Musculoskeletal problems in Iranian hand-woven carpet industry: Guidelines for workstation design. Applied Ergonomics, 38 (5), p. 617-624, 2007. [4] S.Gangopadhyay, Tamal Das, Goutam Ghoshal and
Tirthankar Ghosh. Work Organization in sand core
manufacturing for health and productivity.
International Journal of Industrial Ergonomics, 36 (10), p. 915-920, 2006.
[5] M.G. Helander, and George J. Burri. Cost
effectiveness of ergonomics and quality
improvements in electronics manufacturing.
International Journal of Industrial Ergonomics, 15 (2), p. 137-151, 1995.
[6] M.L. Resnick and A.Zanotti. Using Ergonomics to target productivity improvements. . Computers & Industrial Engineering, 33 (1-2), p. 185-188, 1997. [7] M.Forsman, G.A. Hansson, L. Medbo, P.Asterland,
and T. Engstrom. A method for evaluation of manual work using synchronised video recordings and physiological measurements. Applied Ergonomics, 33 (6), p. 533-540, 2002
[9] J.D. Nico and Jan, D. Sewing machine operation: workstation adjustment, working posture and worker perceptions. International Journal of Industrial Ergonomics, 30 (6), p. 341-353, 2002.
[10] Sanders, M. M., McCormick, E. J. Human Factors in engineering and design, 7 ed. Mc Graw Hill, New York.
[11] C. D. Wickens, J. D. Lee, Y. Liu, S. E. Becker, An Introduction to Human Factor Engineering, 2nd ed. New Jersey: Prentice Hall, 2004.
[12] Biman, D. and Arijit, K. S. Industrial workstation design: A systematic ergonomic approach. Applied Ergonomics, 27 (3), p. 157-163, 1996.
[13] G. J. Burri and M.G. Helander. A field study of productivity improvement in George J. Burri the manufacturing of circuit boards. International Journal of Industrial Ergonomics, 7 p. 207-215, 1991.
[14] Corlett, E. N. The investigation and evaluation of work and workplaces. Ergonomics, 31, p. 727-734, 1998.
[15] J.D. Nico. Press Operation: Workstation adjustment,
working posture, and workers’ perception.
Occupational Ergonomics 3 (2002/2003) p. 153-164. [16] R. Feyen, Yili Liu, D. Chaffin, G. Jimmerson, B. Joseph. Computer-aided ergonomics: a case study of incorporating ergonomics analysis into workplace design. Applied Ergonomics 31 (2000) p. 291-300. [17] C.R. Hicks. Fundamental Concepts in the Design of
Experiments. Saunders College Publishing. 4th edition, 1993.