162 Journal of Lightning Research, 2012, 4, 162-172
1652-8034/12 2012 Bentham Open
Open Access
Lightning Interference in Multiple Antennas Wireless Communication
Systems
M.R. Ahmad
*,1,2, M.R.M. Esa
1,3, M. Rahman
1, V. Cooray
1and E. Dutkiewicz
41
Ångström Laboratory, Division for Electricity, Department of Engineering Sciences, Box 534, S-751 21, Uppsala University, Sweden
2Universiti Teknikal Malaysia Melaka, Hang Tuah Jaya, 76100 Durian Tunggal, Malacca, Malaysia
3Universiti Teknologi Malaysia, 81310 Skudai, Johor Bahru, Johor, Malaysia
4Wireless Communications and Networking Lab, Department of Electronic Engineering, Macquarie University, Sydney, Australia
Abstract: This paper analyzes the interference of lightning flashes with multiple antennas wireless communication systems operating in the microwave band at 2.4 GHz and 5.2 GHz. A bit error rate (BER) measurement method was used to evaluate BER and packet error rate (PER) during 5 heavy thunderstorms on January 25 and March 17 to 20, 2011, respectively. In addition, BER measurements also were done on January 21 and March 30, 2011 under fair weather (FW) conditions providing a baseline for comparison. TheTransmitter-Receiver separation was fixed at 10 meter with line-of-sight (LOS) consideration. We infer that lightning interfered with the transmitted digital pulses which resulted in a higher recorded BER. The maximum recorded BER was 9.9·10-1 and the average recorded BER and PER were 2.07·10-2 and 2.44·10-2 respectively during the thunderstorms with the average fair weather BER and PER values under the influence of adjacent channel interference (ACI) and co-channel interference (CCI) being 1.75·10-5 and 7.35·10-6 respectively. We conclude that multiple antennas wireless communication systems operating at the microwave frequency can be significantly interfered by lightning.
Keywords: Bit error rate, interference, lightning, multiple antennas, wireless communication.
INTRODUCTION
The multiple antennas concept is proposed to fulfill the demand for providing reliable high-speed wireless communication links in harsh environments. Link reliability of multiple antennas wireless networks is obtained by increasing the probability of receiving bit successfully. Multiple antennas technology has demonstrated that reliable links could be maintained during data transmission under the influence of man-made interference for various kinds of wireless networks [1, 2]. However, interference due to natural sources could reduce the link reliability significantly. It could degrade the performance of all multiple antennas links at the same time. Common sources of interference due to natural phenomenon are lightning electromagnetic (EM) pulses and geomagnetically induced currents (GIC).
Lightning discharges produce EM radiation across the EM spectra. EM radiation for both ground and cloud flashes has been studied extensively in radio spectrum from 1 kHz to 1 GHz [3]. Petersen and Beasley [4] recorded impulsive microwave radiation emitted by lightning at 1.63 GHz by using lightning mapping array (LMA) system. They observed that return strokes always generated a significant burst of impulsive activity that lasts on the order of 100 μs.
*Address correspondence to this author at the Ångström Laboratory, Division for Electricity, Department of Engineering Sciences, Box 534, S-751 21, Uppsala University, Sweden; Tel: 471-5849; Fax: +46-18-471-5810; E-mail: [email protected]
They had also observed a significant impulsive activity during the pre-return stroke period. Rust et al. [5] measured microwave radiation at 2.2 GHz from ground flashes and observed a significant burst of impulsive activity during preliminary breakdown and during the propagation of the stepped leader. The burst duration was typically between 5 and 10 ms. Furthermore, they discovered that not all ground flashes produced such bursts. Such significant bursts could possibly interfere with the transmitted digitized communication pulses and reduce communication link reliability in microwave band.
Ground discharge only contributes a quarter of the total events of lightning discharge worldwide and cloud flash is believed to be the most common type of lightning discharge [6]. Sharma et al. [7] mentioned about the possibility of trains of cloud flash pulses interfering with the information sent through communication and data lines because the cloud flash pulses are similar to digitized communication pulse trains.
Lightning Interference in Multiple Antennas Wireless Communication Systems Journal of Lightning Research, 2012, Volume 4
200A, 250A, 440A, 650A, 720A, 850A, 1500A and 2000A. A pair of Motorola Talkabout T5420 walkie-talkies was separated by 5 meters a line-of-sight (LOS) distance. These walkie-talkies were used to transmit audio packets. Each packet contains 1000 frequency shift-keying (FSK) modulated bits. The measurements were conducted at Universiti Teknologi Malaysia (UTM) High Voltage Lab, Malaysia. In their experiment, where an impulse voltage was applied to create the spark all bits were received successfully without losses whereas 25 bits were lost for the high-current experiment at 440A, 850A and 2kA current peak values which corresponds to the BLR value of 2.5·102. Interestingly, no losses were recorded for other current values specially at 650A, 720A and 1500A. However no explanation was given for this observation. Recorded BLR at 2.5·10-2 clearly shows a low quality audio transmission.
Work done in [9] investigated the effects of interference from real lightning on single antenna communication links at 2.4 GHz. A received signal strength indicator (RSSI) measurement method had been used with 1 meter LOS separation. These measured RSSI values were used to simulate bit error rate (BER) for data, audio and video transmissions. The measurement was conducted in Malacca, Malaysia during a rainy day in September 2010 and within almost one hour three lightning flashes occurred close by. It was concluded that lightning flashes reduce the received power and lead to unreliable communication links.
In this paper we present an analysis of BER measurements at 2.4 GHz and 5.2 GHz to evaluate the effects of lightning interference on audio transmission for a multiple antennas communication system. These unlicensed frequency bands were chosen because of various modern wireless communication systems are operating within these free frequency bands. The interference source was obtained directly from natural lightning and differs from laboratory sparks as in [8] and the BER values in our work were measured and not simulated as in [9]. In addition previous work in [9] considered only single antenna communication links at 2.4 GHz.
MEASUREMENT CAMPAIGN
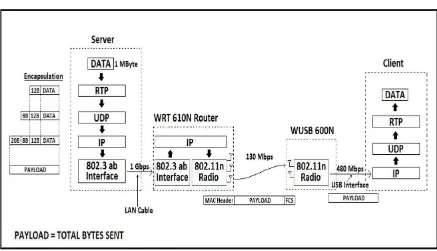
A Dual-band Linksys WRT610N router [10] was connected through LAN cables to a laptop acting as a server. Another laptop acted as a client and was connected to the router wirelessly. A Dual-band Cisco WUSB600N wireless network card [11] was attached to the client laptop through USB interface. The router and the client laptop were equipped with three and two antennas respectively to realize multiple antennas technology. The router was connected to a power outlet available on the outer wall of an adjacent building and other devices were battery-powered.
The transmitting system (server laptop, router and antennas) was positioned on a wooden structure two meters above ground and the receiving system (client laptop, wireless network card and antennas) was positioned on a wooden structure half a meter above ground. Both the transmitting and receiving systems were covered from rain by a roof structure. The ‘ground’ in Fig. (1) refers to Earth’s surface only. A ten meters distance separated the transmitting system from the receiving system. Fig. (1)
illustrates these configurations. Both the transmitter and the receiver were operating either at 2.4 GHz or 5.2 GHz. Adaptive modulations were chosen. Taking ten meters of LOS range into consideration, most probably 64-quadrature amplitude modulation (QAM) was fully utilized.
The application layer at the server of the transmitting system emulated a RealAudio application broadcasting audio content from a multimedia CD-ROM. The average sending data rate was 80 Kbps. The size of the audio data was 1 Mbytes. This data was transmitted using real time protocol (RTP) [12] over user datagram protocol/Internet protocol (UDP/IP) as shown in Fig. (2). The payload type of the RTP was G.729 [13]. The total overhead added to a single audio data packet was 40 bytes (from RTP, UDP and IP headers). However datagram segmentation at the UDP layer and packet fragmentation at the IP layer could increase more the total overhead added to the audio data packet. Thus the total number of bytes sent from the server was 1 Mbytes audio data including the total overhead depending on how many datagrams was generated.
These network layer packets were transmitted to the router by using 802.3ab physical interface [14] with a maximum sending data rate of 1 Gbps. The router forwarded these packets to the receiving system over the wireless communication link by using 802.11n radio interface [15] with a maximum sending rate of 130 Mbps. Distributed coordinated function (DCF) protocol without the request-to-send/clear-to-send (RTS/CTS) mechanism was chosen for the operation of 802.11n radio. The handshaking mechanism was disabled after the hidden node problem was eliminated completely. Also other measures to eliminate hidden node problem had been taken such as providing strong LOS path, shorter Transmitter-Receiver separation and the usage of omni-directional antenna.
The 802.11n radio interface at the receiving system received the transmitted bytes and forwarded them to the client laptop through USB interface with a maximum data rate of 480 Mbps. Forward error correction (FEC) mechanism was used in the 802.11n radio interface to correct any detected error in the received bytes. The Frame Check Sequence (FCS) at the end of each frame detects most of the errors that are not corrected by the FEC scheme. These errors are corrected by retransmissions at the MAC layer. Any bit that cannot be corrected by the FEC and FCS was counted as an error at the IP layer. At the UDP layer, a packet with a certain number of error bytes was considered damaged and discarded. The report of the total number of bytes and packets in error was transmitted to the server after the run time was completed.
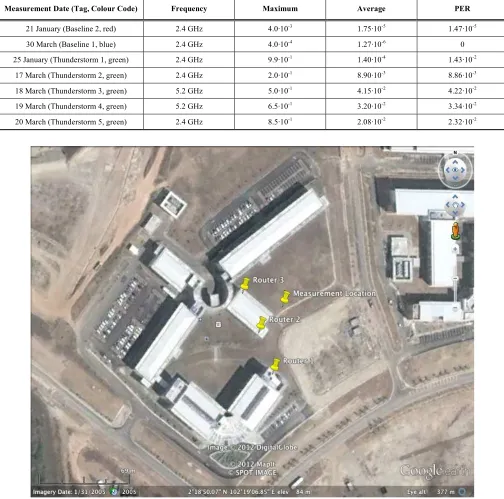
Seven measurements were conducted on 21st January, 25th January, 17th March, 18th March, 19th March, 20th March, and 30th March. All the measurements were done in year 2011 at Universiti Teknikal Malaysia Melaka (UTeM) (latitude 2.313889oN, longitude 102.318333oE), Malacca, Malaysia. Fig. (3) shows the measurement site together with the location of interfering transmitters labeled as Router 1, Router 2 and Router 3.
baseline for comparison. FW measurements on 21st January were done under the influence of man-made interference with the existence of several adjacent channel interferers (ACIs) and co-channel interferers (CCIs). Three transmitters operated in the same band or the adjacent bands contributed to CCI or ACI interferences. The reasons to introduce these interferences are to validate the claim that multiple antennas communication link could operate very well under the influence of both interferences compared to single antenna communication link and also providing a baseline comparison for the thunderstorm measurements. The total
run time for both FW measurements was 3 hours or 10800 seconds.
The other five measurements out of total seven measurements, on the other hand, were carried out during thunderstorms on 25th January, 17th March, 18th March, 19th March, and 20th March. The total run time for thunderstorm measurements was the same as FW measurements with the exception on 18th and 20th March. The total run time for 18th and 20th March was 90 minutes and 130 minutes respectively. The thunderstorm measurements were free from both ACI/CCI and hidden node problems. The selected Fig. (1). Wireless router, server and client configurations used in this study.
Lightning Interference in Multiple Antennas Wireless Communication Systems Journal of Lightning Research, 2012, Volume 4 165
non-overlapping channel was made sure to be clear before the thunderstorm measurements were conducted.
Both the transmitting and the receiving systems were set on start once heavy and dark thundercloud was observed and the both systems were set to off and the measurements were ended once the rain stopped. The total run time of the system experienced three different meteorological conditions namely thundercloud without rain, thundercloud with rain, and lightning flashes. The thundercloud without rain did always occur first followed by thundercloud with rain. Lightning flashes occurred during thundercloud with or without rain. At frequencies below 10 GHz, attenuation by
atmospheric gases and rain may normally be neglected [16]. Therefore the communication links were affected by the thunderstorm alone.
PERFORMANCE ANALYSIS
Data collected from two reference measurements under fair weather conditions was used to analyze the performance of the multiple antennas wireless communication system under thunderstorm conditions. As stated before, data during thunderstorm was recorded from five different thunderstorms and the result of the analysis is presented here. In all figures, each BER point corresponds to the number of error bits
Table 1. Statistics of the Measured BER and PER
Measurement Date (Tag, Colour Code) Frequency Maximum Average PER
21 January (Baseline 2, red) 2.4 GHz 4.0·10-3 1.75·10-5 1.47·10-5
30 March (Baseline 1, blue) 2.4 GHz 4.0·10-4 1.27·10-6 0
25 January (Thunderstorm 1, green) 2.4 GHz 9.9·10-1 1.40·10-4 1.43·10-2
17 March (Thunderstorm 2, green) 2.4 GHz 2.0·10-1 8.90·10-3 8.86·10-3
18 March (Thunderstorm 3, green) 5.2 GHz 5.0·10-1 4.15·10-2 4.22·10-2
19 March (Thunderstorm 4, green) 5.2 GHz 6.5·10-1 3.20·10-2 3.34·10-2
20 March (Thunderstorm 5, green) 2.4 GHz 8.5·10-1 2.08·10-2 2.32·10-2
measured at the receiver for a complete transmission of a 1 Mbytes train of bits from the transmitter. The horizontal axis represents the measurement elapsed time.
In the case of compressed audio bit streams, erroneous packets may invalidate greater numbers of subsequent packets. As a result, lower values of network error rates must be maintained. In general, a communication link for broadcast audio streams is recommended to maintain BER below 1·10-3 [17] while for CD-quality broadcast compressed audio stream, the recommended BER value is below 1·10-4 [18]. A G.729 codec requires A packet error rate (PER) far less than 1·10-2 to avoid audible errors [17].
Table 1 shows the maximum and average values of the measured BER together with the information about the operating frequency and color-coding used in the figures. The FW measurements provide 3-hour BER values during the normal or quiet period with the absence of thunderstorm. Also Table 1 shows the PER values measured at UDP layer. All thunderstorms may experience audible errors because the recorded PER values were close to or higher than 1·10-2.
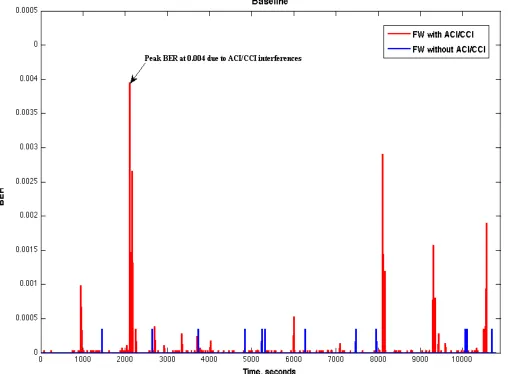
Fig. (4) shows the BER plots of FW measurements done on 21st January 2011 (denoted as Baseline 2) and 30th March 2011 (denoted as Baseline 1) with red and blue color codes,
respectively. The average BER values are 1.75·10-5 and 1.27·10-6 for Baseline 2 and Baseline 1 respectively. The average BER value of Baseline 2 is ten times higher than the Baseline 1 value however this value is insignificant because below than 1·10-4. Moreover the PER values for both measurements were low enough to avoid audible errors. These baseline measurements demonstrated how multiple antennas technology provided reliable communication links for audio transmission even under the influence of ACI and CCI.
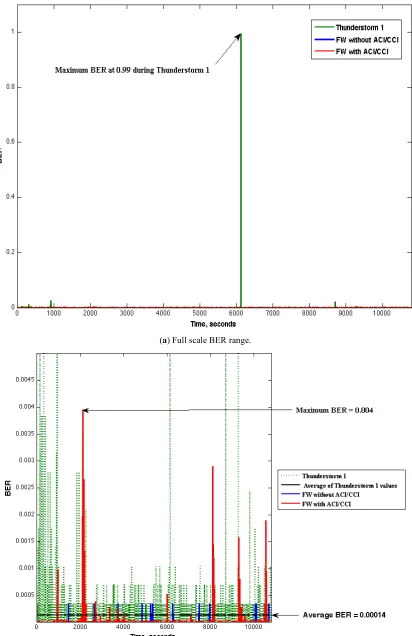
Fig. (5a) shows the measured BER during 25th January 2011 thunderstorm (denoted as Thunderstorm 1) at 2.4 GHz. Most of the BER points were recorded below 2·10-4 as the average BER value (shown as black line, see Fig. 5b) was estimated at 1.40·10-4 with exception at 6135 seconds point in the second hour of measurement. At this point, almost all the transmitted bits were corrupted with 9.9·10-1 BER recorded. The communication link may cause audible errors for the audio transmission during Thunderstorm 1 because the average BER value was higher than 1·10-4 and measured PER value was higher than 1·10-2. Zoomed BER values between 0 and 0.004 are shown in Fig. (5b) to provide a clear comparison of Thunderstorm 1 and baseline values.
Lightning Interference in Multiple Antennas Wireless Communication Systems Journal of Lightning Research, 2012, Volume 4 167
(a) Full scale BER range.
(b) BER range is scaled between 0 and 0.04.
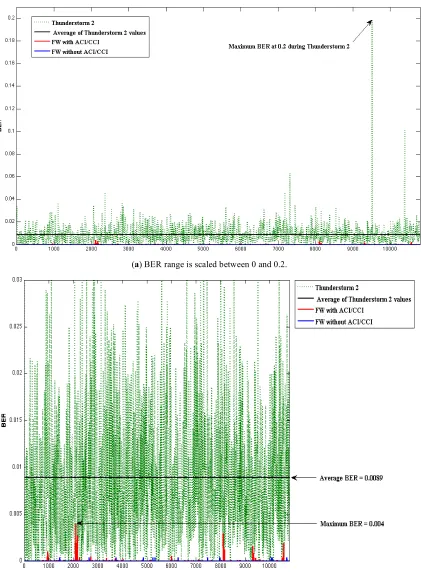
Fig. (6a) shows the measured BER during 17th March 2011 thunderstorm (denoted as Thunderstorm 2) at 2.4 GHz. Most of the BER points were recorded below 1·10-2 as the average BER value (shown as black line) was estimated at 8.9·10-3 with exception at 9513 and 10390 seconds in the
third hour of measurement. At these points, two maximum recorded BER values were 1.988·10-1 and 1.010·10-1 at 9513 seconds and 10390 seconds respectively. The communication link may cause audible errors for the audio transmission during Thunderstorm 2 because the average (a) BER range is scaled between 0 and 0.2.
(b) BER range is scaled between 0 and 0.03.
Lightning Interference in Multiple Antennas Wireless Communication Systems Journal of Lightning Research, 2012, Volume 4 169
BER value was higher than 1·10-4 and measured PER value
was close to 1·10-2. Zoomed BER values between 0 and 0.03
are presented in Fig. (6b) to provide a clear comparison of Thunderstorm 2 and baseline values.
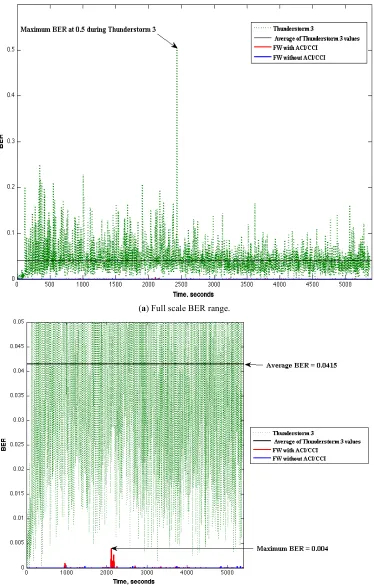
Fig. (7a) shows the measured BER during 18th March
2011 thunderstorm (denoted as Thunderstorm 3) at 5.2 GHz.
Most of the BER points were recorded below 5·10-2 as the
average BER value (shown as black line) was estimated at (a) Full scale BER range.
(b) BER range is scaled between 0 and 0.05.
4.15·10-2 which is higher than recommended value at 1·10-4. The maximum recorded BER value was 5.024·10-1 at 2435 seconds. Also it was observed that PER value was higher than 1·10-2 during this 90 minutes duration. The communication link may cause audible errors for the audio transmission during Thunderstorm 3. Zoomed BER values
between 0 and 0.05 are given in Fig. (7b) to provide a clear comparison of Thunderstorm 3 and baseline values.
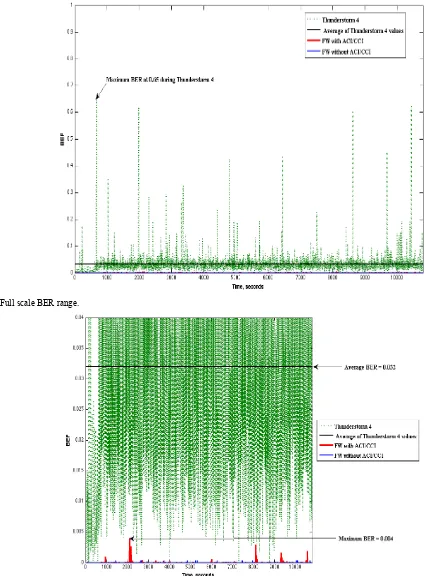
Fig. (8a) shows the measured BER during 19th March 2011 thunderstorm (denoted as Thunderstorm 4) at 5.2 GHz. Most of the BER points were recorded below 5·10-2 as the (a) Full scale BER range.
(b) BER range is scaled between 0 and 0.04.
Lightning Interference in Multiple Antennas Wireless Communication Systems
average BER value (shown as black line) was estimated at 3.2·10-2 which is higher than recommended value at 1·10-4. The maximum recorded BER value was 6.484·10-1 at 666.2 seconds. Also it was observed that PER value was higher than 1·10-2. The communication link may cause audible errors for the audio transmission during Thunderstorm 4.
Zoomed BER values between 0 and 0.04 are shown in Fig. (8b) to provide a clear comparison of Thunderstorm 4 and baseline values.
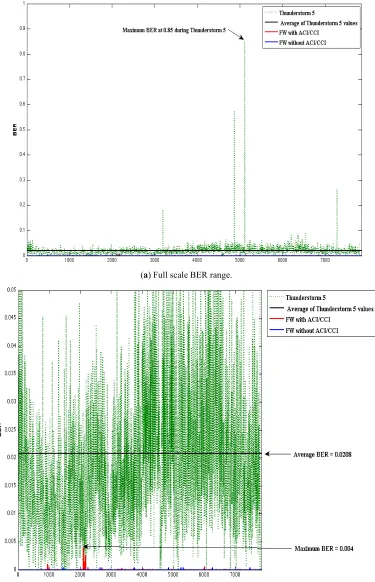
Fig. (9a) shows the measured BER during 20th March 2011 thunderstorm (denoted as Thunderstorm 5) at 2.4 GHz.
(a) Full scale BER range.
(b) BER range is scaled between 0 and 0.05.
Most of the BER points were recorded above 5·10-2 as the average BER value (shown as black line) was estimated at
2.08·10-2 which is higher than recommended value at 1·10-4.
The maximum recorded BER value was 8.520·10-1 at 5110
seconds. Also it was observed that PER value was higher
than 1·10-2 during this 130 minutes duration. The
communication link may cause audible errors for the audio transmission during Thunderstorm 5. Zoomed BER values
between 0 and 0.05 are given in Fig. (9b) to provide a clear
comparison of Thunderstorm 5 and baseline values.
In summary the average BER and measured PER values for all the thunderstorms were higher than for FW with the
mean of the average values is 2.07·10-2, which agrees with
the laboratory BLR value at 2.5·10-2 as recorded in [8]. The
interference is more intense at 5.2 GHz band as observed from higher recorded PER values compared to 2.4 GHz band
as shown in Table 1.
CONCLUSION
We measured BER of an audio transmission at 2.4 and 5.2 GHz for a multiple antennas communication system under thunderstorm conditions. Our observations confirm the works in [8, 9] and also show that the multiple antennas communication systems can also be significantly interfered by natural thunderstorm operating at the studied microwave frequency.
ACKNOWLEDGEMENTS
PhD research work of the first and second authors is funded and supported by Ministry of Higher Education Malaysia. We want to thank M. H. A. Aziz and M. Rashid for helping us conducted the measurement campaign in UTeM, Malaysia. Participation of V. Cooray and M. Rahman was funded by the fund from the B. John F. and Svea Andersson donation at Uppsala University.
CONFLICT OF INTEREST
The authors confirm that this article content has no conflicts of interest.
REFERENCES
[1] Ahmad MR, Dutkiewicz E, Huang X, and Suaidi MK. Cooperative MIMO systems in wireless sensor networks. In: Bazzi A. Radio communications. InTech 2010; 123-49.
[2] Taoka H, Higuchi K, Sawahashi M. Experiments on space diversity effect in MIMO channel transmission with maximum data rate of 1Gbps in downlink OFDM radio access. Euro Trans Telecommun 2006; 17: 611–22.
[3] Le Vine DM. Review of measurements of the RF spectrum of radiation from lightning. J Meteorol AtmosPhys1987; 37: 195-204.
[4] Petersen D, Beasley WH. Preliminary observations of lightning-generated microwave radiation. American Geophysical Union Fall Meeting Abstracts 2010: A276.
[5] Rust WD, Krehbiel PR, Shlanta A. Measurements of radiation from lightning at 2200 MHz. Amer Geophys Union Res Lett 1979; 6(2): 85-8.
[6] Rakov VA, Uman MA. Lightning physics and effects. Cambridge University Press, UK, 2003; 44.
[7] Sharma SR, Fernando M, Gomes C. Signatures of electric field pulses generated by cloud flashes. J Atmos Solar-Terrestrial Phys 2005; 67: 413-22.
[8] Esa MRM, Sha'ameri AZ, Ahmad H, Malik NNNA. Conceptual
implementation to access the extend of influence of lightning electromagnetic radiation on mobile radio communication. Proceeding of Asia-Pacific Conference on Applied Electromagne-tics 2005: Johor Bahru, Malaysia: IEEE 2006; 179–183.
[9] Ahmad MR, Rashid M, Aziz MHA, Esa MM, Cooray V, Rahman
M, Dutkiewicz E. Analysis of lightning-induced transient in 2.4 GHz wireless communication system. Proceeding of International Conference on Space Science and Communication 2011: Penang, Malaysia: IEEE 2011; 225-30.
[10] Linksys WRT610N simultaneous dual-N band wireless router specs. CNET Review Web Site. Available from: http://reviews. cnet.com/routers/linksys-wrt610n-simultaneous-dual/4507-3319_7-33132573.html
[11] Linksys ultra rangeplus dual-band wireless-N USB network adapter WUSB600N specs (network adapter). CNET Review Web Site. Available from: http://reviews.cnet.com/adapters-nics/linksys-ultra-rangeplus-dual/4507-3380_7-32816737.html.
[12] Schulzrinne H, Casner S, Frederick R, Jacobson V. RTP: A transport protocol for real-time applications. IETF RFC 3550 Standard 2003. Available from: http://tools.ietf.org/html/rfc3550. [13] Implementors' Guide for ITU-T Rec. G.729 (2007): Coding of
speech at 8 kbit/s using CS-ACELP. Telecommunication standardization sector of ITU Series G: transmission systems and media, digital systems and networks 2009. Available from: http://www.itu.int/rec/T-REC-G.Imp729-200911-I/en.
[14] IEEE standard for information technology: Telecommunications and information exchange between systems: Local and metropolitan area networks: Specific requirements. Supplement to carrier sense multiple access with collision detection (CSMA/CD) access method and physical layer specifications: Physical layer parameters and specifications for 1000 Mb/s operation over 4-pair of category 5 balanced copper cabling type 1000BASE-T. IEEE standard 802.3ab 1999.
[15] IEEE standard for information technology: Local and metropolitan area networks: Specific requirements: Part 11: Wireless LAN medium access control (MAC) and physical layer (PHY) specifications amendment 5: Enhancements for higher throughput. IEEE standard 802.11n 2009.
[16] Recommendation ITU-R P.618-9: Propagation data and prediction methods required for the design of earth-space telecommunication systems. Radiocommunication sector of ITU Series P: radiowave propagation 2009. Available from: http://www.itu.int/rec/R-REC-P.618-10-200910-I/en.
[17] Chen Y, Farley T, and Ye N. QoS requirements of network
applications on the Internet. Journal Information-Knowledge-Systems Management 2004; 4: 55-76.
[18] Fluckiger F. Understanding networked multimedia: applications and technology. Prentice Hall International (UK) Ltd., Hertfordshire, UK, 1995; 242-382.
Received: April 28, 2012 Revised: July 24, 2012 Accepted: August 4, 2012
© Ahmad et al.; Licensee Bentham Open.