Faculty of Information and Communication Technology
ANALYSIS AND MODELING OF DATABASE STORAGE
OPTIMIZATION POWER CONSUMPTION USAGE FOR GREEN
DATA CENTERS
Wan Noor Hamiza Binti Wan Ali
Master of Computer Science in Database Technology
ANALYSIS AND MODELING OF DATABASE STORAGE
OPTIMIZATION POWER CONSUMPTION USAGE FOR GREEN
DATA CENTERS
WAN NOOR HAMIZA BINTI WAN ALI
A thesis submitted in fulfilment of the requirements for the degree of Master of Computer Science in Database Technology
Faculty of Information and Communication Technology
UNIVERSITI TEKNIKAL MALAYSIA MELAKA
ABSTRACT
Data centers comprised of the building block of Internet Technology (IT) business organizations holding the capabilities of centralized repository for storage, management, networking and dissemination of data. The data centers consumed a lot of energy in order to ensure all the processes in data centers running completely every second which this situation can be lead to increase carbon footprint and give negative impact to the world (global warming). One way to reduce the energy consumption is by optimizing space storage in data centers. Thus, the proxy-based approach is used to optimize the space storage in CMR database in order to establish green data centers. This technique requires proxy candidate in order to drop some attribute for decrease the space storage. The proxies can be discovered by using a developed algorithm of functional dependencies (FDs) called as TANE algorithm. By using TANE algorithm, the proxy candidate and droppable attribute for table in CMR database can be discovered before the space saving can be calculate by given formula. The power saving can be calculated after the amount of space saving is known. The correlation between amount of space saving and amount of power saving was visualized in form of graph in the green data center correlation tool. The project concludes the result from the experiment achieved all the objectives and answered all the research questions.
ABSTRAK
Pusat data terdiri daripada organisasi perniagaan Teknologi Internet (IT) yang menjadi pusat repositori untuk penyimpanan, pengurusan, rangkaian dan penyebaran data. Pusat data memerlukan banyak tenaga elektrik untuk memastikan semua proses di pusat-pusat data berjalan dengan lancar setiap saat yang mana keadaan ini boleh membawa kepada peningkatan kesan karbon dan memberi kesan negatif kepada dunia (pemanasan global). Salah satu cara untuk mengurangkan penggunaan tenaga adalah dengan mengoptimumkan ruang penyimpanan data. Oleh itu, pendekatan berasaskan proksi digunakan untuk mengoptimumkan ruang penyimpanan dalam pangkalan data CMR disamping menubuhkan pusat data hijau. Teknik ini memerlukan calon proksi yang terdiri daripada atribut yang mempunyai kebergantungan berfungsi kepada atribut yang akan digugurkan sebagai cara untuk mengurangkan ruang dalam pangkalan data. Proksi boleh ditemui dengan menggunakan algoritma berdasarkan kerbergantungan berfungsi (FD) yang dikenali sebagai algoritma TANE. Dengan menggunakan algoritma TANE, calon proksi dan attribut yang akan digugurkan daripada jadual dalam pangkalan data CMR boleh ditemui sebelum pengiraan penjimatan ruang dibuat berdasarkan kepada formula yang diberi. Hubungan antara jumlah penjimatan ruang dan jumlah penjimatan kuasa ditunjukkan dalam bentuk graf di alat korelasi pusat data hijau. Kesimpulannya, projek ini mencapai semua objektif dan menjawab semua soalan penyelidikan
ACKNOWLEDGEMENT
By the Name of Allah, the Most Gracious and the Most Merciful
First, I would like to express my appreciation to Allah, the Most Merciful, and the Most Compassionate who has granted ne the ability and willing to start and complete my project. I do pray to His Greatness to inspire and enable me to continue the work.
My most profound thankfulness goes to my supervisor DR. NURUL AKMAR BINTI EMRAN for her creativity encouraging guidance and directed me all the way through the process of developing the project. She is very helpful person and she is my inspiration to be more successful in the future.
I would like to thank my beloved parents and family who have always been my biggest inspiration and always being supportive. Your advices are my greatest motivation to keep on achieving my dreams.
Last but not least, I would like to thanks all my beloved friends and classmates whom supports me and also helps me in this project. Your co-operation, sacrifice, knowledge sharing and understanding is really appreciated.
DECLARATION
I declare that this thesis entitle “Analysis and Modeling of Database Storage Optimization
Power Consumption Usage for Green Data Centers” is the result of my own research
except as cited in the references. The thesis has not been accepted for any degree and is not concurrently submitted in candidate of any other degree.
Signature : ... Name : ...
Date : ...
APPROVAL
I hereby declare that I have read this dissertation/report and in my opinion this dissertation/report is sufficient in terms of scope and quality as a partial fulfillment of
Master of Computer Science (Database Technology).
Signature :………. ...
Supervisor Name :……… ...
Date :……….. ...
LIST OF TABLES
TABLE TITLE PAGE
2.1 A Proxy Map in Pure Relational Table 21
2.2 A Proxy Map in Multi-Valued Table 21
2.3 Attribute and Schema of Microbial Data Sets 22
2.4 Summary of Three Techniques 30
3.1 Example of Amount Space Saving for each Proxy 45
3.2 Values of PW Based on Amount of Space Saving 46
4.1 Description of Bug Bug_Attribute, Taxon, Feat_Link and
ORF_Attribute
52
4.2 Proxy Candidate and Droppable Attribute for Taxon Table 60
4.3 Candidate and Droppable Attribute for Feat_Link Table 63
4.4 Proxy Candidate and Droppable Attribute for ORF_Attribute Table 66
4.5 Proxy 1 from CMR Taxon Table 70
4.6 Proxy 2 from CMR ORF_Attribute Table 70
4.7 Proxy3 from CMR ORF_Atrribute Table 71
4.8 Proxy 4 from CMR Taxon Table 72
4.9 Proxy 5 from CMR Taxon Table 73
4.10 Proxy 6 from CMR Bug_Attribute Table 74
4.11 Proxy 7 from CMR Taxon Table 75
4.12 Proxy 8 from CMR ORF_Attribute Table 76
4.13 Proxy 9 from CMR Feat_Link Table 76
4.14 Proxy 10 from CMR Feat_Link Table 77
4.15 Power Saving on Proxy 1 78
4.16 Power Consumption on Proxy 2 70
4.17 Power Consumption on Proxy 3 80
4.18 Power Consumption on Proxy 4 81
4.19 Power Consumption on Proxy 5 82
4.20 Power Consumption on Proxy 6 82
4.21 Power Consumption on Proxy 7 83
4.22 Power Consumption on Proxy 8 83
4.23 Power Consumption on Proxy 9 85
4.24 Power Consumption on Proxy 10 86
4.25 A Set of Proxy with Details of Droppable Attribute, Proxy Candidate,
Space Saving and Power Saving
87
5.1 Details for G3 Error, Droppable Attribute and Proxy Candidate each
Table in CMR Database
96
5.2 Size of Table Involves in Space Saving Calculation 98
5.3 Relationship Percentage Amount of Space Saving and Percentage
Amount of Power Saving
99
LIST OF FIGURES
FIGURE TITLE PAGE
2.1 Comparison of Data Center Power Consumption between Intel Xeon
Processor and Older Single-Core Processor
9
2.2 Comparison of Monthly Average PUE 11
2.3 A Conceptual Diagram Illustrating on How the Use of Power in Data
Centers Impact an Environment
17
2.4 Proxy Map Size of attribute for Evidence Table 23
2.5 Proxy Map Size of attribute for Taxon Table 23
2.6 Proxy Map Size of attribute for Bug_attribute Table 24
2.7 Energy Calculating Algorithm 26
2.8 Compression Graph 29
2.9 TANE Main Algorithm 33
2.10 Generating Level Algorithm 33
2.11 Computing Dependencies Algorithm 34
2.12 Pruning the Lattice 35
2.13 Computing Partitions Algorithm 36
2.14 Approximate Dependencies Algorithm 36
3.1 Flowchart of Project Implementation 39
3.2 Flowchart of Experimental Based Research Methodology 42
3.3 Command to Analyze Table 44
3.4 Command to Get Size of Table in Bytes 44
3.5 RAD Model 47
3.6 An Expected Graph of Correlation between
Space Saving and Power Saving
48
3.7 Quadrants of Plot Graph 49
4.1 Home Screenshot of Cygwin64 Terminal 54
4.2 Screenshot of Cygwin64 Terminal for command cd d:\TANE 54
4.3 Screenshot of Cygwin64 Terminal for command ls 55
4.4 Screenshot of Cygwin64 Terminal for command cd descriptions 55
4.5 Screenshot of Cygwin64 Terminal for command cd src 55
4.6 Range 0.00 G3 Error for Bug_Attribute Table 57
4.7 Range 0.10 G3 Error for Taxon Table 60
4.8 Range 0.20Figure 4.15: Range 0.20 G3 Error for Feat_Link Table 64
4.9 Range 0.20 G3 Error for ORF_Attribute Table 67
4.10 Screenshot of selectpage.php 88
4.11 Screenshot of a Proxyset Table in phpMyAdmin Database 89
4.12 Screenshot of correlationtool2.php 90
4.13 Screenshot of graph.php 91
4.14 Screenshot of FusionCharts for Dreamweaver (DataGrid) 91
4.15 Screenshot of FusionCharts for Dreamweaver (Chart Selection) 92
4.16 Screenshot of FusionCharts for Dreamweaver (General Option) 93
5.1 Correlation between Power Saving with Space Saving Scattered
Graph
102
5.2 Quadrants of Plot Graph 103
LIST OF ABBREVIATIONS
AHU - Air Handling Unit
CMR - Comprehensive Microbial Resources
CO2 - Carbon Dioxide
CRAC - Computer Room Air Conditioning
CPU - Central Processing Unit
CSV - Comma Separated Values
DBA - Database Administrator
DX - Direct Expansion
FDs - Functional Dependency
GDCE - Green Data Center Effectiveness
GUI - Graphical User Interface
kW - Kilowatts
IT - Internet Technology
PHP - Hypertext Preprocessor
PUE - Power Utilization Effectiveness
RAD - Rapid Application Development
UPS - Uninterruptible Power Supply
XML - Extensible Markup Language
TABLE OF CONTENT
2.2.1 New Technology of Processor 8
2.2.2 New Cooling System 9
2.2.3 Server Consolidation Technique 12
2.2.4 Calculation of Power Consumption Used by One Server 15
2.2.5 The Impact of Power Consumption in Data Centers on the Environment
16
2.3 Methods of Space Saving Optimization 18
2.3.1 Proxy-Based Approach 18
2.3.2 Deduplication Technique 24
2.3.3 Data Compression Method 27
2.4 Comparison of Method 30
2.5 TANE Algorithm 32
2.5 Conclusion 37
3. METHODOLOGY
3.1 Introduction 38
3.2 Project Implementation Methodology 38
3.2.1 Experimental Based Research Methodology 41
1 CHAPTER 1
INTRODUCTION
1.1 Introduction
In this chapter, the background of green data centers will be presented. Data center is one of the crucial parts for physical data storage which required efficiency in handling it
in order to avoid high power consumption. We motivate the need for green data centers based on the problems identified on the traditional data centers before formulating the
objectives of the research.
1.2 Background
Data centers comprised of the building blocks of Internet Technology (IT) business organizations holding the capabilities of centralized repository for storage, management, networking and dissemination of data. Major part of a data center is data server where all
data centers plagued with a thousand servers (Uddin and Rahman 2010). These servers consumed a lot of energy without performing useful work. The operators of data center must fight to reduce utility cost as expensing of operating component to remain
competitive (Intel, 2011). Based on the finding of the EPA’s report on server and data
centers power consumption, one of the conclusion from this report is the server and data
2
similar capabilities and characteristics of a typical data centers. However, they are four
distinctive characteristics such as reduce carbon footprint, optimization of space, cost saving, and more efficiency as compared to a traditional data centers. Efficiency in data centers can be measured by hardware assets, power, cooling, space and human resources.
First characteristic of green data centers as just mentioned earlier is reducing carbon footprint. According to Pallamentary Office of Science and Technology (POST
2006), a carbon footprint can be defined as the total amount of Carbon Dioxide (CO2) and
other greenhouse gases which released over the full life cycle of a process that populate a data center such as servers, UPS, building shell, cooling, etc (Bouley, 2012). The carbon
footprint is not expected to be 100 percent accurate because it is depended on financial and environment terms. Thus, by establishing green data centers, we can reduce the carbon
footprint. Second characteristic is optimization of space which means the large amount of data storage not only leads to inconsistent and impractically to maintain the data centers, however also render to inefficient power usage. By optimizing the required storage to store
large data volumes, the physical data storage may be reduced ( Emran, Abdullah and Isa 2012). Space saving also gives benefits not only when space is highly constrained, but also
when concern is to reduce query response time. By reducing the space to store the data, the time taken for input/output operation query also can be reduced.
Furthermore, third characteristic of green data centers is cost saving. Even though
an establishment a green data center can be expensive up front, but long-term cost saving can be realized on operation and maintenance. When fewer data servers will be used, it is
means that fewer data centers space, lower power and cooling cost required. We also can reduce cost with downsized, generator and battery backup infrastructure proportional to reduction in peak power requirements. In addition, the fourth characteristic is gain more
3
performing the task of: adding new staff, improving the server, adding new equipment of
data center and so on. Some of specific actions which the providers or industries can take to support by increasing data center efficiency such as run more sophisticated power management and define certain points for processor, server and data centers efficiency
based on the current technologies (Emerson, 2009). Efficiency of green data center will be increase when limits the units of server by doing the optimization of space storage and
power consumption.
Based on four characteristics of green data centers as described earlier, all of them are related to each other. When space is optimized, automatically cost of maintenance and
operation can be reduced. Then the efficiency of data centers will be increase where leads to reduce carbon footprint. Consequently, this project proposed modelling of database
storage optimization power consumption usage for green data centers. Our main focus is to study correlation between space saving and power consumption based on the selected technique. The selected technique is proxy based approach because this technique requires
reduce physical storage space at schema level compared to dedulication technique and data compression method that describes in the next chapter.
Comprehensive Microbial Resource (CMR) database has been chosen in order to use the data sets. The data sets that have been used from four tables in CMR database which are Bug_Attribute, Feat_Link, ORF_Attribute and Taxon. The data sets from these
four tables undergo the pre-processing steps for discovered a set of proxy by using TANE. TANE is an algorithm to find out the functional dependency (FDs) which presented by
Huhtala et al (Huhtala et al., 1999). After a set of proxy already discovered, we can
calculate the space saving and power saving before presented the correlation between power consumption and space saving in form of scattered graph in the green data center
4 1.3 Problem Statement
The major problem of this project is on identifying the correlation between space saving and power consumption. It is crucial for data centers administrator to plan or decide on the amount of space to be saving based on the amount of targeted power saving. In
addition, sensitivity amount of power consumed to the increasing volume of space storage also one of the problem where when the lower power is consumed, it will give benefits in
terms of cost saving and efficiency of data centers. Another problem is tool that use in order to determine power consumption which related to amount of space saving. It is because once the correlation of space saving and power consumption is identified, we
needs tool to see distribution of plotted points on scattered graph which is the graph will be divide into four quadrants and analyze the best case scenario based on the plotted points.
1.4 Research Question
The following are the research questions that arise from the problem stated in the
problem statement section:
i. How space saving correlates to power consumption?
ii. How sensitive is the amount of power consumed to the amount of increase
in storage space?
iii. Is there a case for a selected storage space optimization method
5 1.5 Objective
The following are the objectives of this project:
i. To investigate the standard amount of power consumption in data centers.
In order to understand the power consumption rate in data centers, we need to explore the standard amount of power consumption rate based on read scenarios. The result of this step will be used as the based-line for our
correlation process.
ii. To design the model of power consumption for green data centers using space saving parameter.
The correlation tool will be design and develop based on the standard amount of power consumption and space saving which has been identified
in order to do correlation.
iii. To simulate the correlation between data center’s power consumption
and space saving.
By using storage space saving rate and power consumption variables, correlation between these two variables will be graphically presented in
6 1.6 Scope
This project covers the study of database storage optimization’s efficiency in
relation to the power consumption variable in order to establish a green data center for microbial domain from the J. Craig Venter Institute. We use the data sets from CMR which
includes four tables in order to find out a set of proxy. The tables that will be used are Bug_Attribute, Feat_Link, ORF_Attribute and Taxon. Even though there are 25 tables in
the CMR database, but not all tables can be used because some of the data sets cannot be download from the internet due to the corrupted data sets. Space storage and power consumption can be correlates after the space saving and power saving are calculated.
1.7 Significance of Study
The investigation on the correlation of power consumption and space storage contributes to better understanding on the behaviour of proxy-based approach. The result from this project can be applied by database administrators (DBAs) from J. Craig Venter
Institute in order to minimize the space storage and power consumption in the data center. Technical issues during the development and implementation of the correlation tool
provide guidance for future improvement.
1.8 Expected Output
Expected output from this project is a software green data center correlation tool that can be used to correlate the amount of power saving for a given space saving target for
7 CHAPTER 2
LITERATURE REVIEW
2.1 Introduction
This chapter over review of literature on power consumption and techniques of space saving for green data centers. By understanding the requirements of green data centers from power consumption and space saving point of view, the model of correlation
between spaces saving and power consumption can be built.
2.2 Power Consumption in Green Data Center
A data center is a facility that comprised of the building blocks of IT business organizations holding the capabilities to supply source energy for IT equipments used. The
outlines of common data center energy consumption can be divided into three areas such as server load and computing operation, cooling equipment and power conversion and
distributions (Energy, 2012). There is an increasing concern about the cost and availability of energy (John, 2013) due to many researchers study how to optimize power consumption in many domains such as IT (eg., data center), engineering (e.g., digital signal processor)
and so on because by reducing the power consumption in data center, the emission of CO2
can be reduce and operating cost can be saved (eg., cooling system for data centers).
8
system). Power consumption used for data centers is about half from the electricity for an
organization and percentages of power consumption usage is increase year by year as mentioned by DataCenterDynamic (DCD Intelligence, 2014). The increasing of usage is about 6.8% from 2012 to 2013. Hence, we need to overcome this problem before its
getting worst because rising of power consumption will let to high carbon footprint. Consequently, there are a few approaches on how to optimize power consumption in data
centers. In this report, we will elaborate about three approaches for optimizing power consumption which is by used the latest technology of processor, develop new cooling system and by applying server consolidation technique. Later on, we also will be
explaining regarding to energy consumes by one server and the impact of power consumption in data centers on the environment.
2.2.1 New Technology of Processor
Based on white paper from Intel (Intel, 2013), they have explained the
strategies developed and used by CERNopenlab. CERN is the largest physical laboratory in worlds which function to provide the accelerators and infrastructure
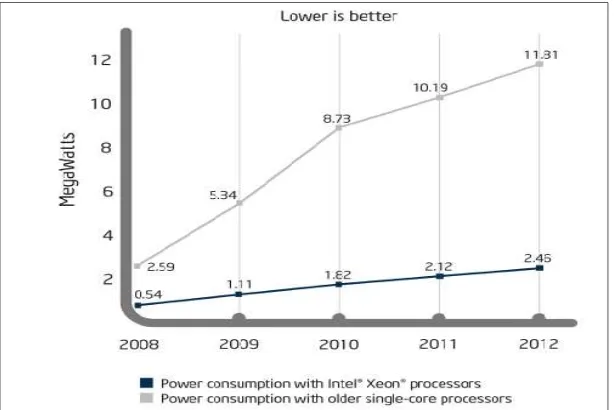
for high-energy physic research. Comparison between power consumption of Intel Xeon processors and older single-core processor has been made by CERN. The latest Intel Xeon processor is based on the Intel Core micro architecture which can
support about five times more compute power per Watt than older single-core processor which based on the earlier Intel NetBurst micro architecture. It is because
9
Figure 2.1 Comparison of Data Center Power Consumption between Intel Xeon Processor and Older Single-Core Processor (Intel, 2013)
A shown in Figure 2.1 is a graph of comparison of power consumption between Intel Xeon processors and older single-core processor has been produced
by CERN. CERN was analyzing the data centers usage in MegaWatts power consumption from 2008 until 2012 to see the power usage differences between these years. CERN concluded that moving to the latest Intel Xeon processors is the
best solution because total power consumption can be reduced about five times rather than the older single-core processors.
2.2.2 New Cooling System
By analyzing another research that was conducted by Green Data Center
Project from National Snow and Ice Data Center (NSIDC), power consumption can be reduced by optimizing the cooling data center functions. The traditional data
10
(CRAC). DX is function to remove heat via a liquid refrigerant as running in a car
or refrigerator. Since DX used synthetic refrigerant which harmful the environment and compressor in DX requires lot of energy. Even though this system is quite economical but it was become antiquated. Thus, Green Data Center Project was
finding another solution to overcome this problem.
According to Weerts et al (Weerts et al., 2012), an approach that has been
implemented is by applying new cooling system design that consists of a unique cooling system that uses both airside economization and a new air conditioner (indirect evaporative cooling). Airside economizer control mode lets the air
handling unit (AHU) to cool the space with outdoor air when the outdoor air is cooler than the air space. However, in several locations especially the Midwest and
East Coast of the United State, the airside economization may not work well cause by hot and humid environment. On the other hand, indirect evaporative cooling used the Maisotsenko Cycle which operates direct and indirect evaporative cooling
in order to produce a supply air state (16.7 °C to 22.2 °C).
In order to compare the differences between CRAC system and new cooling
system, the data center efficiency should be calculated. The Power Utilization Effectiveness (PUE) for any data center can be calculated by using (1).