Response Surface Methodology
Noraiham Mohamad,1,2 Andanastuti Muchtar,1 Mariyam Jameelah Ghazali,1 Dahlan HJ. Mohd,3 Che Husna Azhari1
1Faculty of Engineering, Universiti Kebangsaan Malaysia, 43600 Bangi, Selangor, Malaysia
2Faculty of Manufacturing, Universiti Teknikal Malaysia Melaka, 75450 Ayer Keroh, Melaka, Malaysia 3Malaysian Nuclear Agency, 43000 Bangi, Selangor, Malaysia
Received 14 September 2008; accepted 24 June 2009 DOI 10.1002/app.31056
Published online 27 August 2009 in Wiley InterScience (www.interscience.wiley.com).
ABSTRACT: Epoxidized natural rubber–alumina nanopar-ticle composites were prepared by melt compounding with an internal mixer for a constant filler loading of 10 phr. Mixer parameters such as the mixing temperature, mixing time, and rotor speed were screened and optimized with response sur-face methodology to maximize the impact strength. The pa-rameters were selected as three independent variables and the impact strength (J/m) was selected as the response in a screening factor study. The mixing temperature and its inter-action terms were identified as insignificant factors with aP value greater than 0.0500. The optimum calculated values of
the tested variables (rotor speed and mixing time) for the maximum impact strength were found to be a rotor speed of 60 rpm and a mixing time of 6 min with a predicted impact strength of 208.88 J/m. These predicted optimum parameters were tested in real experiments. The final impact strength was found to be close to the predicted value of 215.84 J/m, with only a 3.33% deviation.VC2009 Wiley Periodicals, Inc. J Appl
Polym Sci 115: 183–189, 2010
Key words: compounding; impact resistance; nano-composites; rubber
INTRODUCTION
Much research has been carried out for the develop-ment of nanofilled composites through the incorpo-ration of nanoscale materials such as ceramics and carbon into polymer matrices. For instance, organo-clays,1 carbon nanotubes,2 alumina nanoparticles,3 and silica nanoparticles4 have been added to poly-mers. Polymer nanocomposites exhibit unique prop-erties, even with the addition of nanofillers at low weight percentages (<5 wt %), that cannot be obtained with conventional or microscale fillers.5 The incorporation of nanofillers enhances mechani-cal, electrimechani-cal, optimechani-cal, and other properties of poly-mer composites without sacrificing too many of the good properties, in contrast to, for example, rubber-filled carbon fibers in which toughness is traded for stiffness.6 Several polymers have been used for pre-paring polymer nanocomposites, such as elastomers [e.g., natural rubber (NR),7,8 epoxidized natural
rubber (ENR),1,9 styrene–butadiene rubber,10,11 chlo-roprene rubber,12 and ethylene–propylene–diene monomer rubber13], thermoplastics [e.g., nylon 6,14 polypropylene,15,16 poly(ethylene terephthalate),17 poly(methyl methacrylate),18 and polycarbonate19,20], and polymer blends.21,22
The development of polymer–ceramic nanocompo-sites has created a number of technologies and opportunities that can be applied to ENR. In previ-ous research by Teh et al.,1ENR was used as a com-patibilizer to produce NR–organoclay nanocompo-sites. Organoclays can be more easily dispersed in polar polymers than nonpolar polymers such as NR.1 ENR is miscible with more polar polymers,23 thereby offering unique properties such as good oil resistance, low gas permeability, higher wet grip, rolling resistance, and high strength. The oil resist-ance of an ENR 50 vulcanizate has been reported to approach the characteristics of nitrile rubber with a medium acrylonitrile content and also surpass that of chloroprene rubber.23The resistance to air perme-ability of ENR 50 has also been claimed to be com-parable to that of butyl rubber and nitrile rubber with a medium acrylonitrile content.23 Alumina has been recognized as a structural material with an extremely high melting point (2050C) and high hardness and is capable of taking on diverse shapes and functions.24 The incorporation of nanoscale
alu-mina into polypropylene has improved the
Correspondence to: N. Mohamad ([email protected]. ukm.my).
Contract grant sponsor: Ministry of Higher Education Malaysia and Universiti Kebangsaan Malaysia; contract grant number: Fundamental Research Grant Scheme UKM-RS-02-FRGS0003-2007.
Journal of Applied Polymer Science, Vol. 115, 183–189 (2010)
mechanical properties of polymer composites25 and increased the wear resistance of poly(ethylene ter-ephthalate) filled with alumina nanoparticles by almost 2 times versus that of the unfilled polymer.17
Epoxidized natural rubber–alumina nanoparticle (ENRAN) composites can be prepared with proce-dures like those used for NR. Rubber–organoclay nanocomposites with an exfoliated morphology have been successfully prepared by several methods, such asin situpolymerization, solution blending, and direct melt compounding.22 The solution method is widely used to prepare nanocomposites and can be applied to ENR, but this method is very inconvenient because of the use of organic solvents.8 Hence, the melt com-pounding method using an internal mixer has been used to synthesize ENRAN composites.
The preparation of high-impact-strength ENRAN composites depends highly on the mixer parameters for the compounding processes. Experiments to opti-mize these parameters can be designed with any tool from mathematical and statistical methods. The design of experiments (DOE) is a worthwhile technique for multifactor experiments as it is less time-consuming and has the ability to detect the true optimum values of factors.26 In this study, response surface methodol-ogy using a full factorial central composite design was used to develop a mathematical correlation between mixer parameters to produce high-impact ENRAN composites with a smaller sample size.27
EXPERIMENTAL
Materials
Table I shows the formulation used in this study. ENR was supplied by the Malaysian Rubber Board under the trade name ENR 50 with 53% epoxidiza-tion. The average Mooney viscosity [measured at ML (1þ4) 100C] was 85.5, and the average specific gravity at approximately 25C was 0.9366. Alumina nanoparticles were supplied by Nanostructured & Amorphous Materials, Inc. (USA), with an average diameter of 30–80 nm. Other compounding ingre-dients such as sulfur, zinc oxide, and stearic acid were purchased from System/Classic Chemicals Sdn. Bhd.; tetramethylthiuram disulfide (TMTD) was acquired from Aldrich Chemistry; and N -cyclohexyl-benthiazyl sulfenamide (CBS) and N -(1,3-dimethyl-butyl)-N0-phenyl-p-phenylenediamine (6PPD) were supplied by Flexsys America (United States).
Preparation and testing of the ENRAN composites
The compounding process was performed according to ASTM D 319228 and carried out using a Haake (Germany) internal mixer working with a combina-tion of parameters determined by the design of the
experiments. First, ENR was masticated before all ingredients were added in sequence. Finally, sulfur was added and mixed for about 1 min before the mixture was dumped and left to cool to room temperature.
From this stock, sheets approximately 3 mm thick were vulcanized with a semiefficient vulcanization system with a hot press at 150C for 3.12 min (the duration was obtained from a rheometer test in ac-cordance with ASTM D 2084).28
Samples prepared according to ASTM D 25629
were tested for the impact strength and unnotched Izod pendulum impact resistance with a Ceast (Italy) impact tester. They were dipped into liquid nitrogen for 1 min before being clamped to the machine and stroked by a pendulum at an energy level of 4 J. At least seven samples were tested for every set of experiments to ensure a high confidence level.
Experimental design
Design experiments were carried out using Design Expert software (Statistics Made Easy, version 6.0.10, Stat-Ease, Inc., Minneapolis, MN).
Two-level factorial design experiment (screening factors)
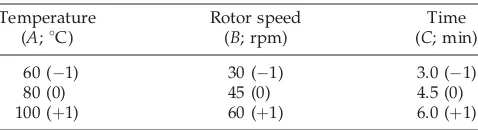
Response surface methodology27 was used to show the statistical significance of the mixing temperature, mixing time, and rotor speed for the Haake internal mixer during the compounding process. A 23 facto-rial design for three independent variables with three replications at the center points leading to a total of 11 sets of experiments was carried out in this study (Table II). The low, middle, and high lev-els of each variable are given in Table III.
From the experimental findings, the effects of the independent variables on the impact strength were studied using a half-normal graph and an effect list. A factorial model was chosen and analyzed with analysis of variance (ANOVA) to determine the ade-quacy of the model.
TABLE I Typical Formulation
Ingredient Loading (phr)a
ENR 50 100
Full factorial central composite design experiment (optimization)
The screening experiment using the analysis of the two-level factorial design enabled model reduction to be established in an optimization experiment. Two fac-tors were recognized as significant facfac-tors to be opti-mized: the rotor speed and the mixing time. In this experiment, the mixing temperature was kept constant at 90C. Thirteen sets of experiments were carried out in this study (Table IV) with four star points and five replications at the center points. The levels of variables chosen for this trial are given in Table V.
From the experimental findings, an approximate polynomial relationship for dependent variables (response) of the impact strength was obtained. The result of this design was used to fit a second-order polynomial27 into Eq. (1), which included all interac-tion terms:
where Y is the predicted response, b are the coeffi-cient values, X are the independent variables, andeis a random error. In this study,k¼2 was used because there were two independent variables involved. The mathematical relationship connecting the two varia-bles and the response from Eq. (1) becomes
Y¼BoþB1X1þB2X2þB11X21þB22X22þB12X1X2 (2)
whereYis the predicted response,Bois the offset term, B1andB2are the linear coefficients,B11andB22are the quadratic coefficients, B12 is the cross-product coeffi-cient, andX1andX2are the independent variables.
RESULTS AND DISCUSSION
Screening factors using 23-level factorial design
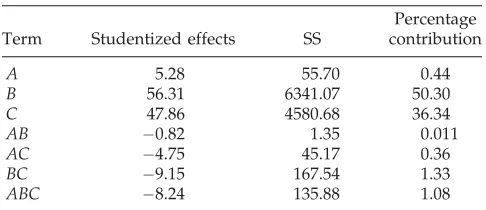
Using 23 factorial designs in the screening experi-ment generated a half-normal plot and an effect list, as shown in Figure 1 and Table VI, respectively. Fig-ure 1 shows that variables C (time) and B (motor speed) are positioned away from the straight line. Other points for variable A (temperature) and the interaction points of AB, AC, BC, and ABC are plot-ted to coincide with the straight line. These plots show that only variables B and C are significant model terms, whereas variable A is insignificant. This observation could be due to the glass-transition temperature for ENR being very low (ca. 30C).30 Hence, a pronounced effect was not observed in the temperature range of 60–100C. The result is
sup-ported by the effect list, which states variable B to be the most significant factor with a 50.30% contri-bution and a sum of squares (SS) of 6341.07. This is followed by variable C with a 36.34% contribution and an SS of 4580.68.
ANOVA produces values such as the mean square
(MS), SS, F value, P value, and coefficient of
TABLE II
23Factorial Design Matrix Used for the Screening Factors
Levels of Variables Chosen for Trial
Temperature
Full Factorial Central Composite Design for the Optimization of Machine Parameters in the ENRAN
Composite Preparation
Levels of Variables Chosen for Trial in the Optimization Experiments
Rotor speed (X1; rpm) Time (X2; min)
30 (1) 3.0 (1)
45 (0) 4.5 (0)
multiple determination (R2; see Table VII). Variables
B and C are selected as significant model terms because their P values are lower than 0.0500. This model is accurate and can be used to navigate the design space because it shows a high R2 value of 0.9526. The R2 value is in a reasonable agreement with the correlation coefficient (|R|) of 0.9391.27 The
R2value implies that the sample variation of 95.26% for the impact strength is attributable to the inde-pendent variables tested. It also indicates that only 4.74% of the total variation is not explained by the model. However, a model reduction should be per-formed because of too many insignificant model terms: variable A and interaction terms AB,AC, BC, and ABC. Therefore, the independent variable Ahas to be eliminated in optimization experiments.
Optimization factors using full factorial central composite design
Experiments with different combinations of the rotor speed and mixing time were carried out using data produced by the central composite design. The impact strength was determined after every sheet
was compressed with a hot press at 150C. The
results were analyzed with ANOVA as an
appropri-ate method for the experimental design used. The regression equation [Eq. (3)] was obtained after the ANOVA was completed. This gave the impact strengths of ENRAN composites as a function of dif-ferent variables: the rotor speed (X1; rpm) and the mixing time (X2; min). All terms, regardless of their significance, are included in the following equation:
Y¼166:87þ25:75X1þ23:38X24:84X2
1þ4:21X22
6:49X1X2 ð3Þ
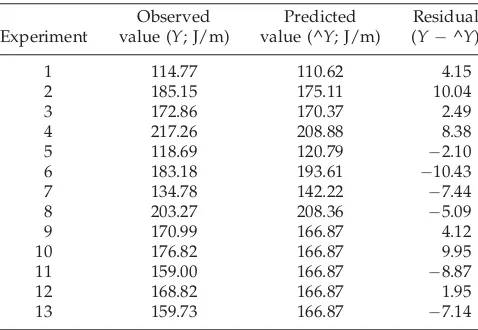
Design Expert software generated a regression model consisting of 1 offset term, 2 linear terms, 2 quadratic terms, and 1 interaction term. The predicted impact strength at each experimental point using Eq. (3) is given in Table VIII along with the experimental data. The mean and standard deviation for the selected regression model are 166.49 and 9.55, respectively. The coefficient values of Eq. (3) were calculated with Design Expert software, and their values are listed in Table IX. The P values of all the terms and interac-tions are also listed in Table IX.
The variable with the largest effect is term X1, which refers to the rotor speed with the SS value of 5303.61. This is followed by term X2 for the mixing temperature with an SS value of 4373.91. The squared terms X21 and X22 and the interaction term
X1X2 seem to be insignificant. When we tested the significance of the regression model, we found that the P value obtained was very small (0.0004; Table IX) in comparison with the desired significant level
Figure 1 Half-normal plot for the screening factors.
TABLE VI
Effect List of All Model Terms for the Screening Experiments
Term Studentized effects SS
Percentage contribution
A 5.28 55.70 0.44
B 56.31 6341.07 50.30
C 47.86 4580.68 36.34
AB 0.82 1.35 0.011
AC 4.75 45.17 0.36
BC 9.15 167.54 1.33
ABC 8.24 135.88 1.08
TABLE VII
ANOVA for the Selected Factorial Models
Source SS
Degrees of
freedom MS Fvalue Pvalue R2
Model 10,921.75 2 5460.87 70.39 <0.0001 0.9526
B <0.0001
C 0.0001
Residual 543.05 7 77.58
Lack of fit 405.64 5 81.13 1.18 0.5178
Pure error 137.40 2 68.70
(0.0500). This indicates that the regression model is accurate in describing or predicting the pattern of significance for the impact strength. The R2 value implies that the sample variation of 94.10% for the impact strength is attributable to the independent variables tested (Table X). It also indicates that only 5.90% of the total variation is not explained by the model.
|R| is generally used to provide correlation meas-ures for the estimation of the regression model. The closer the value of |R| is to unity, the better the cor-relation is between the observed and predicted val-ues.27 The value of |R| for the impact strength of ENRAN composites is 0.8988. This value of |R| indicates a good agreement between the observed and predicted values of the impact strength.27 The corresponding ANOVA is presented in Table X. The practicality of this model is shown in Table VIII, in which most of the predicted values are closely matched by the experimental values.
Interactions among the variables for the maximiza-tion of the impact strength
Figure 2 shows the response surface for the variation in the impact strength as a function of the rotor
speed and mixing time. With the response surface plot, the interaction between these variables can be easily located and understood. According to the response surface plot, the impact strength of ENRAN composites is maximized at 208.88 J/m sim-ply by an increase in the rotor speed from 30 to 60 rpm. The same condition occurs when there is an increase from 3 to 6 min in the duration of mixing. According to these results, the maximum value of the impact strength is obtained at a high rotor speed (selected range of 30–60 rpm) and at a high mixing time (3–6 min). This was shown in experiment 4 (Ta-ble IV and Ta(Ta-ble VIII).
On the basis of the experiment, a higher value of the rotor speed above 60 rpm is not recommended for the preparation of ENRAN composites because it will result in a yellowish compound due to the effect of polymer degradation. This result is due to the chain breakage phenomenon that occurs at a high speed. This case is supported by a perturbation plot from the Design Expert software, as shown in Figure 3. The perturbation plot shows response changes as each factor moves from the chosen reference point, with all other factors held constant at the reference value. From this plot, it can be seen that the rotor speed has a greater effect than the mixing time as it changes from the reference point. However, the rotor speed (X1) shows a negative effect on the pro-cess because it exhibits a downward plot, whereas the mixing time (X2) shows a positive effect as the curve takes an upward plot. Therefore, it proves that the more the rotor speed is extended from 60 rpm,
TABLE VIII
Observed Responses and Predicted Values
Experiment
1 114.77 110.62 4.15
2 185.15 175.11 10.04
3 172.86 170.37 2.49
4 217.26 208.88 8.38
5 118.69 120.79 2.10
6 183.18 193.61 10.43
7 134.78 142.22 7.44
8 203.27 208.36 5.09
9 170.99 166.87 4.12
10 176.82 166.87 9.95
11 159.00 166.87 8.87
12 168.82 166.87 1.95
13 159.73 166.87 7.14
The mean and standard deviation values of the regres-sion model were 166.49 and 9.55, respectively.
TABLE IX
Regression Coefficients andPValues as Calculated
from the Models
Variable Coefficient Pvaluea
B0 166.87
aPvalue less than 0.0500 indicated that the model terms
were significant. ThePvalue for the model was 0.0004.
TABLE X
Regression Analysis (ANOVA) for the Preparation of the ENRAN Composites with Quadratic Response Surface Fitting
Source SS Degrees of freedom MS Fvalue R2
Model 10,174.71 5 2034.94 22.31 0.9410
Residual 638.47 7 91.21
Lack of fit 389.03 3 129.68 2.08
Pure error 249.44 4 62.36
the lower the impact strength will be. In contrast, the higher the mixing time is (i.e., >6 min), the higher the impact strength will be. In addition, it has been observed that a higher mixing time will increase the impact strength. However, the heat gen-erated during the compounding process will also increase in proportion to the increase in the mixing time. This will expose the compounds to a critical state because vulcanization may occur at a tempera-ture close to 150C. The low rotor speed and mixing
time will result in a nonuniform mixture that will reduce the impact strength, as determined by experi-ments 1, 5, and 7 (see Tables IV and VIII). The sam-ples for this experiment are shown in Figure 4.
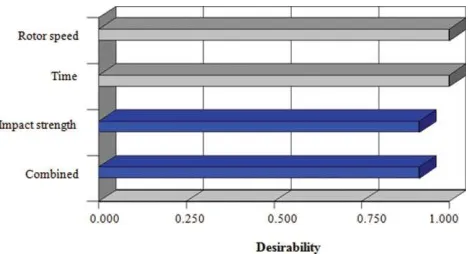
The optimum values presented by the model graphs are in agreement with the numerical optimi-zation generated by the Design Expert software. For the optimization criterion of a rotor speed in the
range of 30–60 rpm, the mixing time is between 3–6 min, and for the maximum impact strength, the so-lution given by the software is 208.88 J/m. There-fore, the corresponding optimum rotor speed and mixing time are 60 rpm and 6 min, respectively. The desirability of these criteria is close to unity with the value of 0.918, as depicted in the histogram (Fig. 5).
CONCLUSIONS
Central composite design and response surface anal-ysis are useful for determining the optimum process parameters to produce a product with desired prop-erties. The best process performance is determined, and sample size is minimized to save time and money. The 23 factorial designs select only two fac-tors as significant independent variables (the rotor speed and mixing time), which are further opti-mized with full factorial central composite design. The final combination of factors used to achieve the highest impact strength is a rotor speed of 60 rpm and a mixing time of 6 min. The models for screen-ing and optimization design are adequate to present and predict the maximum impact strength because theirR2values are 0.9526 and 0.9410, respectively.
Figure 2 Effects of the rotor speed and mixing time on the impact strength of the ENRAN composites.
Figure 3 Perturbation of factors X1 and X2 at the
refer-ence point (rotor speed¼45 rpm, mixing time¼4.5 min).
Figure 4 Differences between the good compounding sheets: (a) experiment 4; and bad compounding sheets: (b) experiment 1, (c) experiment 5, and (d) experiment 7.
The authors sincerely thank the Malaysia Nuclear Agency, which provided expertise, equipment, and technical assis-tance while they conducted their experiments. One of the authors (N.M.) thanks Universiti Teknikal Malaysia Melaka for granting concession and study leave to complete the undertaken course of studies.
References
1. Teh, P. L.; Mohd Ishak, Z. A.; Hashim, A. S.; Karger-Kocsis, J.; Ishiaku, U. S. Eur Polym J 2004, 40, 2513.
2. Shanmugharaj, A. M.; Bae, J. H.; Lee, K. Y.; Noh, W. H.; Lee, S. H.; Ryu, S. H. Compos Sci Technol 2007, 67, 1813.
3. Siegel, R. W.; Chang, S. K.; Ash, B. J.; Stone, J.; Ajayan, P. M.; Doremus, R. W.; Schadler, L. S. Scr Mater 2001, 44, 2061. 4. Park, S. J.; Jin, S. Y.; Kaang, S. Mater Sci Eng A 2005, 398, 137. 5. Lo´pez-Manchado, M. A.; Valentı´n, J. L.; Carretero, J.; Barroso,
F.; Arroyo, M. Eur Polym J 2007.
6. Ajayan, P. M.; Schadler, L. S.; Braun, P. V. Nanocomposite Sci-ence and Technology; Wiley-VCH: Weinheim, 2003.
7. Peng, Z.; Kong, L. X.; Li, S. D.; Chen, Y.; Huang, M. F. Com-pos Sci Technol 2007, 67, 3130.
8. Vu, Y. T.; Mark, J. E.; Pham, L. Y. H. J Appl Polym Sci 2001, 82, 1391.
9. Varghese, S.; Karger-Kocsis, J.; Gatos, K. G. Polymer 2003, 44, 3977.
10. Ahankari, S. S.; Kar, K. K. Mater Sci Eng A 2008, 491, 454. 11. Falco, A. D.; Goyanes, S.; Rubiolo, G. H.; Mondragon, I.;
Mar-zocca, A. Appl Surf Sci 2007, 254, 262.
12. Das, A.; Costa, F. R.; Wagenknecht, U.; Heinrich, G. Eur Polym J 2008, 44, 3456.
13. Chang, Z. H.; Guo, F.; Chen, J. F.; Yu, J. H.; Wang, G. Q. Polym Degrad Stab 2007, 92, 1204.
14. Jose, M. V.; Steinert, B. W.; Thomas, V.; Dean, D. R.; Abdalla, M. A.; Price, G.; Janowski, G. M. Polymer 2007, 48, 1096. 15. Kalaitzidou, K.; Fukushima, H.; Drzal, L. T. Compos Sci
Tech-nol 2007, 87, 2045.
16. Hasan, M. M.; Zhou, Y.; Jeelani, S. Mater Lett 2007, 61, 1134. 17. Bhimaraj, P.; Burris, D. L.; Action, J.; Sawyer, W. G.; Toney, C.
G.; Siegel, R. W.; Schadler, L. S. Wear 2005, 258, 1437. 18. Costache, M. C.; Wang, D.; Heidecker, M. J.; Manias, E.;
Wilkie, C. A. Polym Adv Technol 2006, 17, 272.
19. Chandra, A.; Turng, L. S.; Gopalan, P.; Rowell, R. M.; Gong, S. Compos Sci Technol 2008, 68, 768.
20. Eitan, A.; Fisher, F. T.; Andrews, R.; Brinson, L. C.; Schadler, L. S. Compos Sci Technol 2006, 66, 1162.
21. Kontopoulou, M.; Liu, Y.; Austin, J. R.; Parent, J. S. Polymer 2007, 48, 4520.
22. Arroyo, M.; Lo´pez-Manchado, M. A.; Valentı´n, J. L.; Carretero, J. Compos Sci Technol 2006.
23. Ismail, H.; Chia, H. H. Eur Polym J 1998, 34, 12, 1857. 24. Noboru, I. Introduction to Fine Ceramics (Application in
Engi-neering); Wiley: New York, 1987.
25. Jung, C. H.; Choi, J. H.; Lim, Y. M.; Jeun, J. P.; Kang, P. H.; Nho, Y. C. J Ind Eng Chem 2006, 12, 900.
26. Roshanida, A. R.; Rosli, M. I.; Mohd Ghazali, M. N.; Ahmad Fauzi, I.; Osman, H.; Kamarulzaman, K. Proc Biochem 2004, 39, 2053.
27. Myers, R. H.; Montgomery, D. C. Response Surface Methodol-ogy, Process and Product Optimization Using Designed Experiments, 2nd ed; Wiley: New York, 2002.
28. Annual Book of ASTM Standards; American Society for Test-ing of Materials: West Conshohocken, PA, 2000; Vol. 09.01. 29. Annual Book of ASTM Standards; American Society for
Test-ing of Materials: West Conshohocken, PA, 2001.