Biochemistry
zyxwvutsrqponmlkjihgfedcbaZYXWVUTSRQPONMLKJIHGFEDCBA
1989, 28,zyxwvutsrqponmlkjihgfedcbaZYXWVUTSRQPONMLKJIHGFEDCBA
4791-4800 4791Resonance Raman Investigations of Site-Directed Mutants of Myoglobin: Effects
of Distal Histidine Replacement?
Dimitrios Morikis and Paul M. Champion*
Department of Physics, Northeastern University, Boston, Massachusetts 021 15
Barry A. Springer and Stephen G. Sligar
Department of Biochemistry, University
zyxwvutsrqponmlkjihgfedcbaZYXWVUTSRQPONMLKJIHGFEDCBA
of Illinois at Urbana-Champaign, Urbana, Illinois 61 801Received October 28, 1988; Revised Manuscript Received February 9, I989
ABSTRACT: The resonance Raman spectra of met-, deoxy-, and (carbonmonoxy)myoglobin (MbCO) are studied as a function of amino acid replacement at the distal histidine-E7 position. The synthetic wild type is found to be spectroscopically identical with the native material. The methionine and glycine replacements do not affect the met or deoxy spectra but do lead to distinct changes in the vFtc0 region of the M b C O spectrum. The native MbCO displays a pH-dependent population redistribution of the vFtc0 modes, while the analogous population in the mutant systems is found to be pH independent. This indicates that his- tidine-E7 is the titratable group in native MbCO. Moreover, the pH dependence of the population dynamics is found to be inconsistent with a simple two-state Henderson-Hasselbalch analysis. Instead, we suggest a four-state model involving the coupling of histidine protonation and conformational change. Within this model, the pK of the distal histidine is found to be 6.0 in the "open" configuration and 3.8 in the "closed" conformation. This corresponds to a 3 kcal/mol destabilization of the positively charged distal histidine within the hydrophobic pocket and suggests how protonation can lead to a larger population of the "open" conformation. At p H 7, the pocket is found to be "open" approximately 3% of the time. Further work, involving both I R and Raman measurements, allows the electron-nuclear coupling strengths of the various
vFtc0 and vc4 Raman modes to be determined. The slowly rebinding conformational state, corresponding
to vFtc0
zyxwvutsrqponmlkjihgfedcbaZYXWVUTSRQPONMLKJIHGFEDCBA
= 518 cm-' (vc4 = 1932 cm-'), displays unusually weak coupling of the F d O mode to the Sorettransition. Studies of the vFtCO region as a function of temperature reveal that the equilibria between the conformational states are quenched in both the native and glycine mutant below the freezing point of the solvent. Unusual line narrowing of the vFtc0 modes at the phase transition is also observed in all samples studied. This line narrowing stands in marked contrast to the other heme Raman modes and suggests that Fe-CO librational motion and/or distal pocket vibrational (or conformational) excitations are involved in the line broadening at room temperature.
s t u d i e s of ligand binding to heme proteins are often com- plicated by "distal pocket effects". The ambiguities sur- rounding the interactions of the ligand with the distal pocket generally reflect a lack of experimental control over this facet of heme protein structure. However, with the recent advances in gene synthesis and bacterial expression, it has become possible to produce significant quantities of heme proteins having specifically designed amino acid sequences [see Springer and Sligar (1987) and references cited therein]. Such proteins (site-directed mutants) can be utilized in various spectroscopic and kinetic experiments to help uncover the role of the distal pocket in the overall structure/function rela- tionships that govern the activity of heme proteins (Nagai et al., 1987; Smulevich et al., 1988a,b; Olson et al., 1988; Braunstein et al., 1988).
In the present study, we have focused on the role of the distal histidine (E7) in sperm whale myoglobin (Mb). We have examined the UV-visible absorption and resonance Raman spectra of two E7 mutants (Springer et al., 1989) (MbGly =
His-E7
-
GlyE7, MbMe, = His-E7-
Met-E7) as well as their complexes with ligands (CO, 02). Additional work in- volving native Mb demonstrates the spectroscopic and kinetic+This work was supported by NIH Grants DK 35090 (P.M.C.), GM 33775, and GM 31756 (S.G.S.) and by NSF Grant DMB 87-16382 (P.M.C.). P.M.C is the recipient of NIH Research Career Development Award DK 01405.
0006-2960/89/0428-4791$01 .50/0
effects of pH and temperature. Here, we use the sitedirected mutants to test a simple model of Mb conformational and proton exchange dynamics. The model helps to account for the temperature and pH dependence of multiple states of MbCO observed using optical (Doster et al., 1982), infrared (Ansari et al., 1987; Shimada & Caughey, 1982; Fuchsman
& Appleby, 1979), resonance Raman (Reinisch et al., 1987), X-ray (Kuriyan et al., 1986), and magnetic resonance (Johnson et al., 1978; Satterlee, 1984) spectroscopies.
MATERIALS AND METHODS
The Raman spectra are taken by using the UV lines of a Coherent (Palo Alto, CA) Innova 100 Ar+ laser which pumps a Coherent CR-599 tunable dye laser containing stilbene I11 dye. Two sample geometries are employed: (a) right-angle scattering for the dilute samples (30-300 pM); (b) modified backscattering for the concentrated (2-15 mM) and solid- phase samples (single crystals or frozen solutions). The scattered light is collected and focused, after passing through a polarization scrambler, into either a Triplemate spectrograph or a Model 1403 double monochromator with holographic 2400 groove/" gratings (Spex Industries, Metuchen, NJ). An optical multichannel analyzer (Princeton Instruments, Trenton, NJ) or standard photon counting is used to detect the scattered light. UV-visible absorption spectra are recorded by using a Perkin-Elmer (Norwalk, CT) 320 double-beam
4192
zyxwvutsrqponmlkjihgfedcbaZYXWVUTSRQPONMLKJIHGFEDCBA
Biochemistry, Vol. 28,zyxwvutsrqponmlkjihgfedcbaZYXWVUTSRQPONMLKJIHGFEDCBA
No. 11, 1989spectrophotometer. Infrared (IR) spectra are taken by using a Mattson Industries, Inc. (Madison, WI), alpha Centauri FTIR spectrometer.
Raman spectra of met- and deoxyMb are measured by using standard UV-quartz fluorometer cuvettes (NSG Precision cells, Inc., Hicksville, NY) while the MbCO samples are studied by using a spinning cell arrangement. Low laser in- tensities (-3-9 mW and defocused beam) are used to reduce
C O photodissociation. MbCO crystals are mounted in
zyxwvutsrqponmlkjihgfedcbaZYXWVUTSRQPONMLKJIHGFEDCBA
2-mm-diameter glass X-ray capillaries and attached to a gon- iometer head (Charles Supper Co., Natick, MA). Each crystal is surrounded by a drop of its mother liquor. For low-tem- perature work, a gold-plated sample holder is tilted by 30' from the vertical and placed into a closed-cycle helium-cooled cryostat. Samples for IR spectra are placed in a cell with CaF2 windows (McCarthy Scientific, Fullerton, CA) separated with Teflon spacers of path lengths of 0.1 or 0.2 mm.
Wild-type M b and mutant myoglobins are synthesized as discussed previously (Springer & Sligar, 1987). Native sperm whale Mb is obtained in lyophilized form from Sigma Chem- ical Co., St. Louis, MO (type 11). MetMb samples are de- oxygenated by using N2 or Ar gas and then reduced by using a few microliters of concentrated sodium diothionite buffer solution. The oxygenated complex is prepared by adding 0,
to the reduced sample. The MbCO derivative is prepared either by adding C O gas to the reduced sample or by reducing the degased metMb under a C O atmosphere. The samples prepared in glycerol/H20 are stirred for several hours under a CO atmosphere to allow the ligand to diffuse through the viscous solvent. For single crystals, metMb crystals are grown and converted to MbCO according to standard procedures (Kendrew & Parrish, 1956; Kuriyan et al., 1986).
A variety of buffers (potassium phosphate, acetate, citrate, and citrate/phosphate) are used for the spectroscopic studies. The pH of the sample is always measured after the protein material is added to the solution. Some buffer-dependent results are observed and indicate the possibility of a carboxylate binding site in sperm whale myoglobin, as suggested previously (Coletta et al., 1985). We also found that extreme care must be taken in the pH measurement when high protein concen- trations are involved (e.g., IR samples) and that concentrations
above
zyxwvutsrqponmlkjihgfedcbaZYXWVUTSRQPONMLKJIHGFEDCBA
5 mM in the deoxy form are unstable below pH 5.0.All samples are checked with the UV-visible absorption spectrophotometer before and after Raman and/or IR runs. The oxidation marker band region (1330-1400 cm-') of MbCO samples is routinely checked as a monitor of laser- induced photodissociation for every Raman run. Laser power, beam focusing, and spinning rates (where necessary) are ad- justed in order to keep photolysis below the 10% level (the deoxy peak at 1357 cm-' is usually present as a slight shoulder or is unobservable).
Relative peak areas of the Raman and IR spectra are measured by fitting the data with Lorentzian line shapes and a linear background using a nonlinear least-squares fitting routine (Bevington, 1969).
RESULTS
One particularly surprising observation, that may have im- portant physiological consequences, involves the formation of the oxygenated complexes of MbGly and MbMM,. When oxygen is bound to these mutants, it appears that significant aut- oxidation of the iron atom (Springer et al., 1989) and sub- sequent reduction of the porphyrin ring ensues. The resulting material has optical properties quite similar to oxidized me- tallochlorins (Anderson et al., 1984) and suggests that one of the key roles of His-E7 is to prevent such lethal reactions,
Morikis et al.
200 400 600 800 1000 1200 1400 1800
Raman shift (cm-')
FIGURE 1: Resonance Raman spectra of native metMb and the
synthetic mutants at pH 7.0 with designated replacements at the
zyxwvutsrqponmlkjihgfedcbaZYXWVUTSRQPONMLKJIHGFEDCBA
E7position. The laser excitation wavelength is 416 nm with optical multichannel analyzer detection (spectrograph band-pass is 7.5 cm-', and the total integration and averaging time is 9-10 min for the mutant samples and 20 and 60 min for the high- and low-frequency native sample, respectively). Typical protein concentrations are on the order of 30-100 rM. The power at the sample is 3-6 mW. Changes in
the relative intensities at low frequency are due to uncompensated reabsorption and system response effects. The M b a sample contains some residual ferrous protein as shown by the peak at 1357 cm-'.
I ' ' ' ' I ' ' ' ' I '
;
' ' I ' 1 1' I ' ' ' ' I ' ' ' I ' I ' ' ' ' I1
GLY200 400 600 800 1000 1200 1400 1600
Raman shift (cm-I)
FIGURE 2: Same as Figure 1 except for deoxyhlb. The excitation wavelength is 430 nm. The total integration and averaging time is
5 min for the mutant samples and 12 and 38 min for the high- and low-frequency region of the native sample, respectively. The power at the sample is 13-18 mW.
by stabilizing the Fe3+-O; moiety through hydrogen bonding (Phillips & Schoenborn, 1981; Olson et al., 1988; Springer et al., 1989) and/or blocking access to the vulnerable quadrant of the heme periphery. The C O derivatives, on the other hand, all display normal optical properties and are studied in depth using resonance Raman spectroscopy.
Mutant Myoglobins
I " , ' " ' , " ' ' l ' , , I ( I I I I I , , , # I I
[image:3.618.62.302.44.222.2]Biochemistry,
zyxwvutsrqponmlkjihgfedcbaZYXWVUTSRQPONMLKJIHGFEDCBA
Vol.zyxwvutsrqponmlkjihgfedcbaZYXWVUTSRQPONMLKJIHGFEDCBA
28, No.zyxwvutsrqponmlkjihgfedcbaZYXWVUTSRQPONMLKJIHGFEDCBA
11, 1989zyxwvutsrqponmlkjihgfedcbaZYXWVUTSRQPONMLKJIHGFEDCBA
zyxwvutsrqponmlkjihgfedcbaZYXWVUTSRQPONMLKJIHGFEDCBA
4793Table I: Raman Frequencies and Relative Intensities of MbCO"
sample vibration A0 A I A3 IAo/IAI I,,/I,,
200 400 800 800 1000 1200 1400 1600
[image:3.618.58.300.302.476.2]Raman shift (cm-')
FIGURE 3: Same as Figure 1 except for MbCO and spinning cell geometry. The excitation wavelength is 430 nm. The total integration and averaging time is 30-40 min for the various samples. The power at the sample is 3.6 mM with a defocused beam. Note the changes
in the unresolved vFa region. The region is also shown, but detailed studies were not carried out in this region due to the low
signal-to-noise ratio.
---
lHIS
A
IlGLYh
/ l M E T A
I
460 480 500 520 540 480 480 500 520 540 460 480 500 520 540
Raman shift (em-')
~ G U R E 4: High-resolution resonance Raman Scans of the v F m region using a double monochromator. The laser excitation wavelength is 420 nm, and power at the sample is 3-9 mW with a defocused beam.
Spinnin cell geometry is utilized. The spectral band-pass is set to
dependence of the wFa mode in the native material and the similarity of the low-pH spectrum to that of the single crystal. The mutants display a pH-independent line shape.
With the exception of vFtc0 and uc-0 (vide infra), all other Raman frequencies and intensities are found to be essentially identical when the mutant, wild-type, and native samples are compared (the apparent changes in intensity at low frequency in Figures 1-3 are due to a combination of OMA system response and/or reabsorption effects). The fact that the Raman spectra show such detailed similarity indicates that the general heme environment, as dictated by the globular protein, is unaltered by the mutations. This suggests that the protein folding and general tertiary structure of the mutants are not drastically affected by the amino acid substitutions. In Figure 4, we display high-resolution Raman spectra of the vFcCO region, obtained by using a scanning double
monochromator. The spectra show definitively that the vFa
line shape of both the glycine and methionine mutants have a pH-independent doublet structure at room temperature in aqueous buffer. On the other hand, native M b and wild-type M b display a pH-sensitive doublet that has been studied ex- tensively as a function of temperature and laser irradiation
2.5 cm-
k
, and protein concentrations are 20-60 MM. Notice the pHwild type, PH 7
native, PH 7
native, pH 3.9c
crystal Gly,
pH 9.5
Gly, PH 7
Gly, pH 5.5
G ~ Y , pH 4.1
Met, pH 8.5
Met, pH 7
Met, pH 6.1 wild type, PH 7
native, PH 7
native, pH 3.9O
G ~ Y , PH 7
Met, pH 7
"FCCO
"FCCO
"FCCO "Fe-CO
VFe-CO vFCCO
vFCCO vFCCO
VC-0
VC-0
W - 0
VC-0 W-0
491 508 518 0.08 f 0.02* 0.03 f 0.02 491 508 518 0.05 f 0.02 0.02 f 0.02 491 508 518 0.96 f 0.10 0.04 f 0.02 491 508 518 0.89 f 0.10 0.01 f 0.01 492 506 e 2.41 f 0.30
492 506 e 2.54 f 0.30 492 506 e 2.67 f 0.30 492 506 e 3.34 f 0.30 495 506 e 3.3-9.4d 495 506 e 3.5-9.4 495 506 e 3.8-9.7
e 1946 1932 0.35 f 0.10
e 1946 1932 0.26 f 0.10 1966 1946 1932 0.92 f 0.20 0.15 f 0.15
1965 1944 e 2.81 f 0.60 1964 1947 e 5.9-13.7
Frequencies and areas are obtained from a nonlinear least-squares fit using Lorentzian line shapes. All frequencies in cm-I. Excitation wavelength is 420 nm, and sample is held at room temperature in a spinning cell with 290% in MbCO-bound state. bThe quoted uncer- tainties reflect fitting error and estimated experimental error which can be large for small peaks. CAcetate buffer was used and later found to decrease the observed ratios when compared to phosphate and citrate/ phosphate buffers. The latter two buffers at pH C4.3 also lead to small downshifts of the frequencies of A, and A I . dThe quoted range in the peak areas of the methionine sample reflects fits with line widths of 9.0-8.5 cm-l for A. and 9.0-3.5 cm-l for A I . The large uncertainty in the width of the A I mode is due to the low resolution. In the native material, widths for all peaks were fixed to ca. 9.0 cm-' while the widths for the glycine mutant were found to be 9.5 cm-! for A,, and 6.2
cm-' for A , . CNot measured within experimental signal to noise.
(Reinisch et al., 1987). This same doublet structure has also been observed in single crystals of MbCO (Morikis et al.,
1988) and closely resembles the low-pH form of solution MbCO.
We also note the effect of solvent and buffer composition on the doublet line shape. It is found that the addition of glycerol (60%) to MbGly causes a decrease in the intensity near
508 cm-' along with small shifts in the observed frequencies. This is presumably due to the more "open" distal pocket in the glycine mutant. The native material shows no such effect. The effect of altering the buffer composition of the native material at low pH is also significant. For example, use of citrate/phosphate buffer at pH 4.2 leads to a ca. 13% increase in the Raman intensity at 491 cm-' compared to spectra ob- tained with pH 4.2 acetate buffer.
We have also obtained low-resolution Raman spectra of the
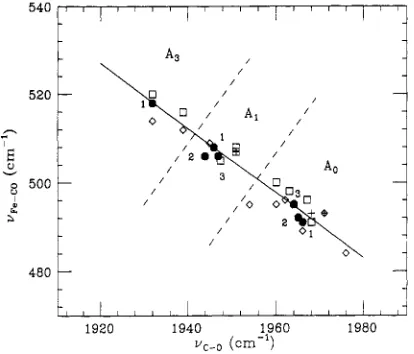
uc4 region (not shown). These spectra are obtained by using the diode array detector due to the relatively weak Raman cross section for vC+. Table I compares the relative Raman frequencies and intensities of the Fe-CO and C - O modes. A further comparison of uFcCO and vc-0 for the mutants, as well as various other heme compounds, is plotted in Figure 5. This demonstrates the inverse correlation between these frequencies that has been previously discussed (Yu & Kerr, 1988; Li &
Spiro, 1988; Uno et al., 1987).
At this stage, we adopt the notation of Ansari et al. (1987),
4794
zyxwvutsrqponmlkjihgfedcbaZYXWVUTSRQPONMLKJIHGFEDCBA
Biochemistry, Vol. 28, No.zyxwvutsrqponmlkjihgfedcbaZYXWVUTSRQPONMLKJIHGFEDCBA
11, 1989 Morikis et al.480
zyxwvutsrqponmlkjihgfedcbaZYXWVUTSRQPONMLKJIHGFEDCBA
1
t ~ ~ l ~ ~ ~ ~ l ~ ~ ~ ~ 1 ~ ~ ~
1920 1940 1960 1980
vc-o (em-')
FIGURE 5: Correlation between the vFd0 and uC+ Raman modes showing the primary peaks of some of the samples reported here as solid numbered circles: (1) native and wild type; (2) glycine mutant;
(3) methionine mutant. The open diamonds, squares, and crosses represent data points from heme model compounds, proteins (hem- oglobin and myoglobin only), and hemoglobin mutants, respectively
[see Yu
zyxwvutsrqponmlkjihgfedcbaZYXWVUTSRQPONMLKJIHGFEDCBA
and Kerr (1988), Li and Spiro (1988), Uno et al. (1987),and Nagai et al. (1988) for details]. The dashed lines suggest that
the delineation between the Ao, AI,
zyxwvutsrqponmlkjihgfedcbaZYXWVUTSRQPONMLKJIHGFEDCBA
and A , states discussed in the textmay be generalized to other systems. Note the good resolution between
A. and A I . The slope of the solid line is -0.75.
A , , and A3 states are indicative of the various frequencies shown in Table I. Also listed are the relative intensities of the bands for various pH and sample states as found by fitting Lorentzian functions to the line shape. Figure 6 shows a logarithmic plot of the relative A o / A 1 Raman intensity as a function of pH. Data from the infrared studies of Shimada and Caughey (1982) are also included. Below pH -4.5, it is extremely difficult to stabilize the high concentration needed for the IR experiment. In this respect, the Raman studies are superior, since they utilize lower concentrations and can span a larger pH range.
Before proceeding further, we must establish direct links between the populations of the states, Ai, and the relative Raman intensities. Within the infrared experiment, it is tacitly
assumed that the oscillator strengths for
zyxwvutsrqponmlkjihgfedcbaZYXWVUTSRQPONMLKJIHGFEDCBA
v c a are the same forall states. This assumption seems reasonable in view of the invariance of the integrated infrared intensities (Shimada 8i Caughey, 1982). Thus, we hold the view that the relative infrared intensities can be used as a genuine measure of state population, and we take the infrared spectra as a population standard in order to analyze the more complex resonance Raman data.
There are two main questions that must be addressed in the analysis of resonance Raman intensities: (1) Are the elec- tron-nuclear coupling strengths' of the Fe-CO modes inde- pendent of state? (2) Do the Fe-CO mode intensities of the various states depend differently on the laser excitation fre- quency; Le., are the Raman excitation profiles the same for all states? Since the different states Ao, A', etc. may be associated with differing heme-CO orientations and electron densities (Kuriyan et al., 1986; Li & Spiro, 1988; Yu & Kerr,
The electron-nuclear coupling strength, Si, is a measure of the forces experienced by the nuclei of the ith normal mode subsequent to electronic excitation. It is also a direct measure of the displacement, A,, of the excited-state equilibrium geometry with respect to the ground state. The resonance Raman intensity of mode i is directly proportional to the quantity Si = A;/2. For a further discussion of coupling strength and its relation to absorption and Raman intensities, see Bangcharoenpaur- pong et al. (1984).
l " " I " " l " MbCO
101
10-1
1,
, , ,,
, ,+
I ,i
k
z
10-2
2 4 6 6
PH
FIGURE 6 : Population ratio No/Nl in native MbCO is plotted loga- rithmically as a function of pH. The Raman data were fit with two Lorentzians with 7 4 9 1 = ysos = 9.0 cm-'; the third peak at 518 cm-' is negligible. The closed squares correspond to the intensity ratio
Z49,/ZAm using citrate (0.1 M)/phosphate (0.2 M) buffer, which has
an extended pH range and allows the titration to be completed with
a single buffer. Thus, secondary effects due to different buffer salts are eliminated. The closed diamonds are the measured intensities using di- and tribasic phosphate buffer (0.1 M). The open circles represent the No/Nl population ratio obtained for bovine MbCO by Shimada and Caughey (1982) using infrared band intensities. The
IR studies are difficult to extend below pH 4.5 due to the high concentration of Mb needed and the self-buffering capacity of the protein. The bars on the Raman data points correspond to the use
of the coupling strengths in Table I1 to convert the intensity ratio to the population ratio via No/Nl = (Z491/Z5oB)(S5o~/S491). We have taken the average value for &)8/&91 = 1.45 below pH 5 and Sso8/S491 =
0.5 above pH 5.0 to make the conversion. Use of eq 2 leads to the
solid curve through the data and the values for the equilibrium constants quoted in the figure. The fit is a compromise between the observed intensity and the calculated population ratios, due to the pH dependence and uncertainty in the coupling strength determination. We estimate an uncertainty of *0.2 unit for the pKs and a factor of
2 for K,,. The dashed line in the figure represents an attempt to simultaneously couple a second proton exchange to the conformational equilibria (see text). Such a model does not account for the data.
1988; Uno et al., 1987; Ansari et al., 1987; Ormos et al., 1988; Moore et al., 1988), the answers to these questions are not obvious.
In order to answer question 1 more carefully, we have prepared concentrated samples of low-pH MbCO for simul- taneous analysis by both Raman and infrared spectroscopy. It is necessary to perform both measurements on the same sample due to the sensitive pH dependence of the populations and the difficulty of accurately controlling the pH near 4.5 in a concentrated protein sample. It is evident from our studies that the pH 3 spectra quoted by Ansari et al. (1987) probably reflect the pH of the buffer before protein is added.
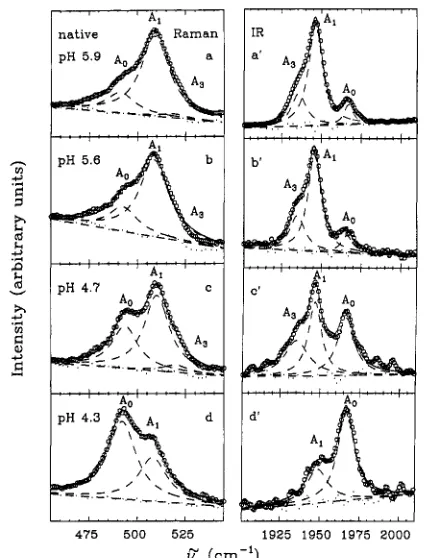
[image:4.619.76.283.46.223.2]The Raman and infrared line shapes for several native samples showing both the A. and A , states are displayed in Figure 7. In all cases, the 'fits have been restrained to three Lorentzian line shapes (Ao, A I , A3), and a fourth band, at an arbitrary position, has not been added to improve the fits as
in other treatments (Ansari et al., 1987; Shimada & Caughey, 1982). It seems equally likely that the fits could be improved by use of asymmetric non-Lorentzian line shapes, and, without definite evidence of the fourth band, we hold to a three-peak analysis.
We note that the glycine mutant at room temperature, aqueous buffer, shows an asymmetry and lack of doublet structure in the I R line shape (spectra not shown) in contrast to the distinct resolution of the Raman spectra (Figure 4; vc-0
Mutant Myoglobins
zyxwvutsrqponmlkjihgfedcbaZYXWVUTSRQPONMLKJIHGFEDCBA
Biochemistry, Vol. 28, No.zyxwvutsrqponmlkjihgfedcbaZYXWVUTSRQPONMLKJIHGFEDCBA
zyxwvutsrqponmlkjihgfedcbaZYXWVUTSRQPONMLKJIHGFEDCBA
1 I , 1989 4795Table
zyxwvutsrqponmlkjihgfedcbaZYXWVUTSRQPONMLKJIHGFEDCBA
11: Relative Band Areas” and Coupling StrengthsbA0 ’43
MbCOQly
pH 7.0
zyxwvutsrqponmlkjihgfedcbaZYXWVUTSRQPONMLKJIHGFEDCBA
? 0.59 0.65 ? ? ? 0.41 0.35 ? ?pH 5.6 0.10 0.24 0.07 6.2 0.1 0.63 0.76 0.72 3.1 0.2 0.27 0.21 0.1
MbCO
pH 5.9 0.09 0.20 0.04 5.8 0.1 0.68 0.76 0.70 2.9 0.2 0.23 0.04 0.26 0.5 0.2
pH 4.7 0.35 0.34 0.21 2.6 0.1 0.35 0.60 0.66 4.5 0.3 0.30 0.06 0.13 0.5 0.1
DH 4.3 0.68 0.64 0.67 2.4 0.2 0.32 0.36 0.33 2.9 0.2 0.0 0.0 0.0
a f
zyxwvutsrqponmlkjihgfedcbaZYXWVUTSRQPONMLKJIHGFEDCBA
stands for the relative fraction, A f / C A f , of a given band, infrared (IR) or Raman (Ram). bAbsolute coupling strengths, Sf @lo2), of the Y F ~ Omodes are determined relative to the 508 cm-’ mode from REP studies2 at pH 7.0: SS08(pH 7.0) = 2.6 X The relative infrared band areas are used to determine the state populations, N f , so that the coupling strengths can be determined (S, a Ivi/Npi; see text). The integrated area of the vFtc0 band is 0.68 at pH 7 and 0.77 at pH 4.3 relative to an intermediate standard (the v, band). The coupling strengths for the v C a modes are estimates that are normalized to the 1946 cm-l mode at pH 7.0. The integrated area of the uCa band is 1.32 at pH 7.0 and 0.97 at pH 4.0 relative to the Y,
+
vA combination band at 2046 cm-I.475 500 525 1925 1950 1975 2000
V” (cm-’)
FIGURE 7: Raman ( ~ ~ 4 0 ) and IR (vC+) line shapes of native Mb at pH 5.9 in 0.2 M potassium phosphate buffer with 60% glycerol (a, a’), pH 5.6 in 0.2 M aqueous acetate buffer (b, b’), pH 4.7 in 0.1
M citrate buffer with 60% glycerol (c, d ) , and pH 4.3 in 0.1 M aqueous citrate buffer (d, d’). The pH of the buffer solutions before adding the protein is 4.0 (a, a’), 3.75 (b, b’), 4.0 (c, c’), or 3.25 (d, d’). The protein concentrations are approximately 10 mM (a, a’), 8 mM (b,
b’), and 1.5 mM (c, c‘ and d, d’). The relative peak areas can be. found
in Table I1 along with the results from the vc4 Raman band (not shown). The line shapes are fit by using three. independent Lorentzians and a linear base line. The residuals are shown in the figure. We
do not believe that use
zyxwvutsrqponmlkjihgfedcbaZYXWVUTSRQPONMLKJIHGFEDCBA
of a fourth band is justified [cf. differing locationof the fourth band in the analysis of Ansari et al. (1987) vs Shimada and Caughey (1982)l. The dilute concentrations lead to the sample cell interference pattern seen as background modulations in c’ and d’.
a factor of 2, a relative equivalence exists for the electron- nuclear coupling strengths of the Fe-CO modes of the A, and A l states.* The Fe-CO Raman mode of the A3 state seems to be weakly coupled compared to the A , and A l states, and it is difficult to resolve from the 508 cm-’ mode at room temperature. [Low-temperature spectra do show the well-
*
Previous Raman excitation profile studies have determined that theuFd0 mode is coupled to the Soret transition (Bangcharoenpaurpong,
1987).
resolved, weak, appearance of this mode, due to sharpening line widths (see Figure lo).] Basically, as previously noted (Fuchsman & Appleby, 1979; Makinen et al., 1979), the population of the minority species, A3, tracks with Al as the pH is varied down to 4.5. Below pH -4.5, conversion of the A3 species into the A , species begins to exceed the conversion of A l into A,.
One of the most interesting aspects of Figure 7 and Table I1 is that, although the electron-nuclear coupling strengths for the vF& mode in the A. and A l states are the same order of magnitude, they appear to be functions of both state and pH. The bars in Figure 6 are an attempt to show how the different coupling strengths affect the population determina- tion. Since the Raman intensities (I,,) scale with both popu- lation (Ni) and coupling strength (SJ, we have used Zvi a N&,
to convert the measured intensity ratio Z491/Z508 into the population ratio No/N1 via the coupling strength ratio s508/
Above pH 5.0, we have used the ratio Sm/S491 = 0.5 while below pH 5.0 we have used sso8/s.,91 = 1.45, in agreement with average values taken from Table 11. The bars in Figure
6 indicate the calculated population ratios, while the solid points represent the spectroscopic intensity ratios. The IR- determined intensity ratios are assumed to be a direct measure of population (open circles in Figure 6). Since the scale in Figure 6 is logarithmic, the coupling strength factor plays a minor role in the titration analysis. Nevertheless, the existence of differing values for the electron-nuclear coupling in the A. and Al states at high and low pH suggests the need for a four-state analysis rather than the standard two-state Hen- derson-Hasselbalch approach (vide infra).
The data for the vc4 Raman modes suffer from larger experimental uncertainty. Nevertheless, it appears from Table I1 that the relative vC4 coupling strengths for A,,, A l , and A3 are of the same order of magnitude. The equivalent coupling for vc4 in the A3 state is noteworthy since the weak coupling for vFe0 in the A3 state indicates that the electronic structure of the Fe-CO moiety in state A3 is significantly different compared to states A. and A l . The entries for the glycine complex in Table I1 are uncertain due to the loss of resolution and asymmetric broadening observed in the infrared spectrum. We do not understand this effect since it appears to broaden the infrared band without analogous broadening in the Raman spectrum.
[image:5.617.60.560.48.152.2] [image:5.617.71.285.218.497.2]4196
zyxwvutsrqponmlkjihgfedcbaZYXWVUTSRQPONMLKJIHGFEDCBA
Biochemistry, Vol. 28,zyxwvutsrqponmlkjihgfedcbaZYXWVUTSRQPONMLKJIHGFEDCBA
No.zyxwvutsrqponmlkjihgfedcbaZYXWVUTSRQPONMLKJIHGFEDCBA
11, 1989 Morikis et al.x
2
8
4
I , , , , I , . . . I , / , ~ I ~ . ~ . l i
zyxwvutsrqponmlkjihgfedcbaZYXWVUTSRQPONMLKJIHGFEDCBA
460 480 500 520 540
zyxwvutsrqponmlkjihgfedcbaZYXWVUTSRQPONMLKJIHGFEDCBA
[image:6.622.114.245.43.299.2]v" (cm-')
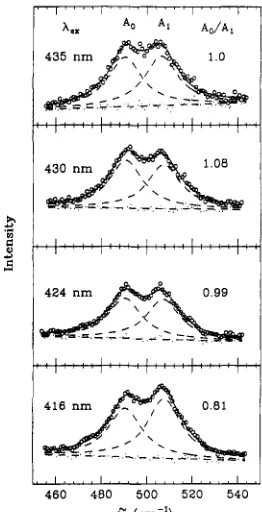
FIGURE 8: vFdX) region of the Raman spectrum as a function of laser excitation wavelength. The laser wavelength and the calculated ratio of the peaks, A o / A I , are shown in the figure. The area corresponding to the A3 band is negligible and not taken into account. The lack of dispersion in the relative peak intensity shows that the relative Raman cross sections at a given wavelength are primarily determined by the relative electron-nuclear coupling strengths. Sample conditions: native MbCO, pH 3.9 in 0.1 mM acetate buffer.
weak enhancement of vFcc0 at 518 cm-' ( A 3 ) . However, the changes are barely outside the 10-15% error margin, and we can therefore answer question 2 in the negative with reasonable confidence.
Finally, we present the results of measurements that explore the temperature dependence of the Ao/AI ratios as determined from the Raman data (Figures 9 and 10). Here, we are able to compare the behavior of the glycine mutant directly with the low-pH native material in aqueous buffer. Previous Raman (Reinisch et al., 1987) and infrared (Ansari et al., 1987; Caughey et al., 1981) studies of native Mb-CO have estab- lished that the interconversion of A. to A , is temperature and pH dependent until the solvent freezes. Below freezing, it appears that conformational changes and CO interconversions are quenched in the native material. Special care is taken to ensure that the majority of the sample (>90%) is in the
CO-
bound state in these experiments, and the oxidation-state marker region is also shown in the figures. Since the geminate rebinding rates are pH dependent (Doster et al., 1982), the ratio &,/A1 can be affected by a disproportionate photolysis of the A, state. The temperature range in Figures 9 and 10
is limited by the desire to keep greater than 90% of the ma- terial in the bound form. Thus, in the liquid phase down to -273 K, we spin the sample to allow for the slower rebinding due to the lower population of CO in the pocket. Between 100 and 240 K, we reduce the laser power so that the geminate rebinding rates exceed the laser photolysis.
The difference between the ratio of A o / A l at room tem- perature in the glycine mutant and the native material is significant and indicates differences in the temperature-de- pendent equilibria that govern the relative populations above the freezing point. As the temperature is lowered, the popu- lations are redistributed according to the relative free energies
of the A.
zyxwvutsrqponmlkjihgfedcbaZYXWVUTSRQPONMLKJIHGFEDCBA
and A I states. At the phase transition, the popu-I 1 1 , ' "I " ' ' I
I I I , 1
1340 1360 1380
475 500 525
v" (cm-')
FIGURE 9: Temperature dependence of the VFAO and v4 (heme oxidation marker band) of MbCO,,,. The dramatic line narrowing for temperatures below the solvent phase transition is apparent for the vFAo peak. Also, v4 shows line narrowing that varies linearly with temperature. HWHM (in cm-') for 295 K, 7 4 9 1 = 9.3, 7508 =
6.1, and 7 1 3 7 2 = 4.1; for 200 K, y495 = 6.0, 7 5 0 8 = 3.3, and 7 1 3 7 2 =
3.6; for 160 K, 7195 = 5.2, ySo8 = 3.0, and 7 , 3 7 2 = 3.3. The small peak at 1357 cm- is due to photodissociated material. The exper- imental conditions are as in Figure 4, but the sample is static in a cryostat and in a modified backscattering geometry (see Materials and Methods). Powers used are 3-4 mW at the sample. Typical sample concentration is
-
1 mM.I
I I 1 , I
475 500 525 1340 1360 1380
v" (cm-')
FIGURE 10: Same as Figure 9 but for native MbCO. HWHM (in cm-') for 295 K, y49, = 9.0, YSOS = 6.5, 7 5 1 8 = 3.0, and 7 , 3 7 2 = 4.2;
for 200 K, y491 = 6.3, y s s = 3.0, 7 3 1 8 = 1.5, and 7 , 3 7 2 = 3.7; for 120
K, 7491 = 5.0, ysoS = 3.0, 7 5 1 8 = 2.5, and 7 1 3 7 2 = 3.4.
lations are quenched. Note that the freezing process alters the relative populations of the pH-sensitive native material much more than the glycine mutant.
Mutant Myoglobins
state-dependent phenomenon (Le.,
zyxwvutsrqponmlkjihgfedcbaZYXWVUTSRQPONMLKJIHGFEDCBA
ys18<
7508zyxwvutsrqponmlkjihgfedcbaZYXWVUTSRQPONMLKJIHGFEDCBA
<
7491 below220 K) and is not observed for the other heme Raman modes. For example, the line width of the oxidation marker band can be taken as a reference which displays a linear temperature dependence having a T = 0 K intercept of about 3 cm-’ (HWHM) and slope of -4 X lo-, cm-’/K [see Schomacker and Champion (1988) for a more detailed study of the tem- perature dependence of the resonance Raman line width and
intensity in heme proteins]. The various
zyxwvutsrqponmlkjihgfedcbaZYXWVUTSRQPONMLKJIHGFEDCBA
y r values are listedin the figure captions, and for
zyxwvutsrqponmlkjihgfedcbaZYXWVUTSRQPONMLKJIHGFEDCBA
vFtc0, they all display a rapiddecrease of 3-4 cm-’ in their half-widths between the solvent freezing point and -200 K. The A. mode of the native material does not display such a dramatic effect because of the much larger slope, dy/dT
-
19 X lo-, cm-’/K below 200 K compared to the other modes (data not shown). The T =0 K intercepts of the vFtc0 line widths are all near 3 cm-’ ( H WHM)
.
DISCUSSION AND ANALYSIS
General Observations. Studies of resonance Raman scat- tering of site-directed mutants of Mb provide a high-resolution spectroscopic map of the heme and its ligands. The heme vibrations are essentially unchanged when histidine-E7 is re- placed by either glycine or methionine. However, in com- parison to the native and synthetic wild-type material, the CO-bound states of these mutants show a distinct population redistribution as monitored by the v Fbands. Thus, it seems ~
that both vFcC- (as measured by Raman) and v c a (as mea- sured by infrared) can be used to monitor changes in the CO-bound protein populations due to pH, temperature, and mutation at E7.
It is important to recall that the Raman studies of MbCO single crystals (Morikis et al., 1988) indicate significant population of the A. state, whereas solutions of pH 7.0 MbCO show primarily A , population (Figure 4). It must be pointed out that previous infrared spectra of mixed crystals of MbCO, although suffering from poor signal to noise, do show a rad- ically different spectral pattern with significant A , population (Makinen et al., 1979). Since >90% of the population of Fe-CO bonds is accounted for in the Raman experiment, we do not understand this apparent discrepancy between the IR and the Raman crystal studies, even when the very small coupling strength of the v F d 0 mode of A , is considered. Further experimental work is clearly necessary in this area. In the case of the wild-type and native Mb, we have es- tablished that the Raman excitation profiles of the 491 cm-’ ( A o ) and 508 cm-’ ( A , ) bands are basically equivalent. The simultaneous measurement of IR and Raman intensities es- tablishes an independent population standard so that the electron-nuclear coupling strengths of the Raman modes can be determined. This, in turn, allows the relative Raman in- tensities to be used as a measure of the A,-state population in studies involving pH and temperature. Since the electronic structure of the A, states is clearly different, as monitored by Fe-C-0 frequency differences, it is not surprising that s 4 9 1
>
S508zyxwvutsrqponmlkjihgfedcbaZYXWVUTSRQPONMLKJIHGFEDCBA
>>
s518 at pH -6.0 (Table 11). The unusual aspectis the reversal of coupling strength, s508
>
S491, at pHs below5. One possibility (in the context of the model proposed below) is that the presence or absence of the positive charge, associated with the protonated His-E7, might affect the relative coupling strengths. Another possibility is that additional, pH-dependent, proximal effects are simultaneously operative. Further studies of these interesting electron-nuclear coupling effects are clearly necessary.
Unfortunately, we are not able to make analogous coupling strength correlations using the glycine mutant. This is due
Biochemistry, Vol. 28, No.
zyxwvutsrqponmlkjihgfedcbaZYXWVUTSRQPONMLKJIHGFEDCBA
11, 1989 4797to the unexplained loss of resolution and asymmetric broad- ening observed in the vC4 I R bands which are needed as a population standard. Slightly different results have been re- ported elsewhere (Braunstein et al., 1988), and we believe that they are primarily due to differences in sample condition (295 K, aqueous buffer, vs 10 K, 75% glycerol). We note that our studies demonstrate a significant population of the A , state along with the A. state in the Raman measurements using aqueous buffer (e.&, see Figures 4 and 9). Thus, the absence of the A, state in the IR analysis of the CO-bound glycine mutant (Braunstein et al., 1988) may need to be reconsidered. The ratio of the A3/A1 Raman intensities for the Fe-CO mode is small in most samples, and the population ratio ap- pears to remain fixed above pH -4.5 (Makinen et al., 1979; Fuchsman & Appleby, 1979). We observe a rapid disap- pearance of the A3 IR population between pH 4.7 and 4.3 (Table 11) which reappears primarily as Ao. As can be seen from the last column of Table I, the ZA,/ZA, ratio calculated
for the vFtCO and v c a Raman modes is different and well beyond the error in measurement. This, along with Table 11, indicates that the coupling strengths of the vC4 modes are comparable for all three states, in contrast to the vFd0 cou- pling where s 4 9 1
-
ss08>>
SSl8. The implication is that A ,has a heme-CO electronic structure that is fundamentally different from A. and A , . The much slower rebinding kinetics observed for the A , state (Chance et al., 1987; Ansari et al., 1987) may be related to the weakness of the vFd0 coupling in the bound state.
Of most interest in the temperature-dependent studies is the unusual sharpening of the vFtc0 peaks at the phase transition. This conceivably results from rapid fluctuation induced pure dephasing processes (e.g., phonon scattering) that are “frozen out” as the gobin matrix becomes rigidly fixed by the sur- rounding ice. If this effect were due simply to a variety of inhomogeneous Fe-CO environments, one might expect the broad line widths to be “frozen in” and maintained even at low temperature. Thus, we expect that the vibrationally ex- cited Fe-CO oscillator is interacting in a fundamentally dif- ferent way with the distal pocket vibrational excitation spec- trum than is the ground state. The fact that 7491
>
7508 forthe native pH 4.6 material at low temperature may be a re- flection of additional line-broadening mechanisms that involve small librational changes in the Fe-CO orientation. These changes are expected to occur on very slow time scales and could persist even at low temperature [this might represent the “inhomogeneous” broadening reported by Ormos et al. (1988)]. The observation that 7 4 9 1
>
7508 below freezingindicates that more librational disorder is present in the F e C O orientation when the distal pocket is in the “open” confor- mation (vide infra).
Analysis
zyxwvutsrqponmlkjihgfedcbaZYXWVUTSRQPONMLKJIHGFEDCBA
of p H Studies. The A o / A 1 population ratio isaffected by pH in native Mb, but not in the MbGly or MbMe, mutants. This fact is strong evidence in favor of the view (Hayashi et al., 1976; Johnson et al., 1978; Fuchsman &
4798
zyxwvutsrqponmlkjihgfedcbaZYXWVUTSRQPONMLKJIHGFEDCBA
Scheme In
Biochemistry,
zyxwvutsrqponmlkjihgfedcbaZYXWVUTSRQPONMLKJIHGFEDCBA
Vol. 28, No.zyxwvutsrqponmlkjihgfedcbaZYXWVUTSRQPONMLKJIHGFEDCBA
11, 1989AOH+
zyxwvutsrqponmlkjihgfedcbaZYXWVUTSRQPONMLKJIHGFEDCBA
LL A~zyxwvutsrqponmlkjihgfedcbaZYXWVUTSRQPONMLKJIHGFEDCBA
+
H+Morikis et al.
A ~ H +
-
+
H+K1
'AoH' and A,,: "open", 491/1966 cm-I;
zyxwvutsrqponmlkjihgfedcbaZYXWVUTSRQPONMLKJIHGFEDCBA
A,H+ and A,: "closed",508/1946 cm-'.
ghey, 1976; Makinen et al., 1979; Fuchsman & Appleby, 1979; Campbell et al., 1987); however, the spectra in Figure 4 appear to rule out this explanation for the lowered
uc-
of the Al state. Thus, the presence of a pH-dependent ratio of4
and A l states in native Mb, and a pH-independent ratio in M b l y and MbMd, directly links His-E7 protonation with an interaction thataffects the relative stability (Le., free energy) of the A. and
zyxwvutsrqponmlkjihgfedcbaZYXWVUTSRQPONMLKJIHGFEDCBA
A l states but not their existence. The possibility of a direct His-E7 interaction with C O remains for the A3 state, since no modes at vFtCO = 518 cm-l or vc4 = 1932 cm-l are de- tected in the mutant samples.
We have noticed that a number of studies involving pH titration in the Mb system have employed the simple two-state Henderson-Haselbalch analysis (Shimada & Caughey, 1982; Fuchsman & Appleby, 1979; Hayashi et al., 1976; Johnson et al., 1978; Doster et al., 1982; Coletta et al., 1985). In such an analysis, the two states that are assumed accessible to the system are defined by acidic and basic "limits" of the observed quantity that presume 100% population of the two states at the pH extremes. Successful application of this type of analysis over a limited pH range using a spectroscopically unresolved observable does not necessarily imply that the underlying assumption of a two-state system is correct. For example, the pH titration of the spectroscopically resolved populations A. and A l , shown in Figure 6, cannot be explained within the simple two-level scheme of a standard Henderson-Hasselbalch analysis. The saturation in the population ratios, as shown on the logarithmic scale, indicates the presence of a four-state system of conformation and proton exchange dynamics (Scheme I).
The states
&,
&H+ and Al, AIH+ are thus associated with an "open" and "closed" distal pocket, respectively. (This is actually a limiting case of a more general scheme, that con- siders the heme-CO orientational equilibria independently from the protein conformational change^.)^ It is important to note that, even within a four-state system, association of the spectroscopic frequencies with the presence or absence of the proton (rather than the conformation/orientation) will always allow one to recover equilibria that are linear in proton concentration and equivalent to the Henderson-HasselbalchIn general, the proton exchange and protein conformational equi- libria should be formally coupled with the relative h e m e 4 0 orientational equilibrium in an eight-state model. Thus, the different states of pro- tonation and conformation provide different environments and free en- ergies for the establishment of the h e m 4 0 orientational equilibrium.
In the limit that a given protein conformation strongly favors a particular heme-CO orientation, through distal pocket-CO interaction (or lack thereof), the simplified four-state model of Scheme I will result. It must be understood that, in the more general interpretation, the "opening" and "closing" of the system involves a coupled protein conformational and h e m 4 0 orientational change. Thus, in certain distal pocket mutants,
it may be possible to observe equilibration in the Ao/AI population below the temperature where geniuine protein conformational change is quenched. Such equilibration would be dictated by the free energy of the h e m 4 0 orientational change and could possibly take place below the quenching temperature if the CO rotation is unhindered by the presence of the distal pocket blocking groups.
analysis. If, on the other hand, the spectroscopic frequencies (binding rates etc.) are dependent upon the conformational
state through the AIH+
2
zyxwvutsrqponmlkjihgfedcbaZYXWVUTSRQPONMLKJIHGFEDCBA
Ad-I+ and Al-
equilibria, theobserved ratio
Kd
is given by
1
+
10pH-pKo(2)
which leads to the nonlinear logarithmic behavior in Figure 6. Physically, we expect that the &openn and "closed" con- figurations of M b correspond to those deduced from X-ray structure and energetic calculations (Kuriyan et al., 1986). Thus, in the open form, the histidine-E7 swings out of the pocket toward the solvent, and the Fe-CO bond is less distorted by the distal pocket (vFtC0
-
491 cm-l). In the closed form, the distal pocket interacts, in some way, to alter the Fe-CO orientation and polarization, and uF& is raised to-
508 cm-'. One is tempted to ascribe the pocket-CO interaction directly to the His-E7, but, as mentioned above, the presence of both the 491 and 508 cm-' states in the E7 mutants indicates that another interaction (perhaps with Val-El 1) must also be in- volved. The mode at 518 cm-', on the other hand, could arise from a direct His-E7 interaction within the closed distal pocket. The solid line in Figure 6 results from a fit to the observed A o / A l ratios, using eq 2, and leads to pKo = 6.0, pK1 = 3.8, and Kp = 7.1. The fit is a compromise between the observed spectroscopic ratios (points) and the population ratios (bars) as determined from the relative coupling strengths given in Table 11. Since there is a significant variation associated with the coupling strengths as a function of pH, we have simply used the average values of SSw/S491, above and below pH 5.0, in order to estimate the population ratios, No/Nl. The errors in the data analysis and fitting procedure are nonnegligible and suggest that pKs are specified to within f0.2 pH unit while Kp is known to within a factor of 2.The values of the equilibrium constants are consistent with the above interpretation, where in the "open" form His-E7 has a pK near 6.0 but in the "closed" form the pK is shifted to 3.8. Direct analysis of the energetics of the shift in pK leads to a 3.0 kcal/mol difference in the free energies of proton release. This implies that the positive charge, due to protonation of the distal histidine within the closed hydrophobic pocket, is destablized by about 3.0 kcal/mol at room temperature when compared to protonation in the more aqueous environment of the open form. In the context of Scheme I, the protonation of the distal histidine leads to a conformational equilibrium that favors the open form by ca. 7 to 1. The deprotonated histidine, on the other hand, favors the closed form by ca. 25
to 1. (Here, we have used Kdr, = KdKl.) In the physiological regime, near pH 7.0, this indicates that the pocket is "open" and easily accesible for ligand entry and escape only -3% of the time. (Here we have included the A3 population as "closed"; see below and footnote 4.) It would be of interest to include this conformational probability in estimates of the pocket occupation factor (Doster et al., 1982) and the overall calculation of ligand entry and exit rates (Kottalam & Case, 1988).
We note that proton magnetic resonance studies of the distal histidine in leghemoglobin strongly support the above view (Johnson et al., 1978). Although holding to a two-level Henderson-Hasselbalch analysis for the titration data, two
_ -
-
NO
[image:8.616.139.220.58.119.2]Mutant Myoglobins
separate pKs are observed for the pyridine (pK
zyxwvutsrqponmlkjihgfedcbaZYXWVUTSRQPONMLKJIHGFEDCBA
= 6.0)zyxwvutsrqponmlkjihgfedcbaZYXWVUTSRQPONMLKJIHGFEDCBA
and C O(pK = 4.0) complexes. In addition, it seems that the ring current shielding of the porphyrin ring causes an abnormal upshift of the histidine C-2 proton in the C O complex at high pH which disappears at low pH. When this observation is considered along with the negligible D 2 0 exchange rate for the high-pH C O complex, it is concluded that the distal his- tidine in the “closed” hydrophobic pocket configuration has a pK
-
4. The pyridine complex, on the other hand, readilyexchanges the C-2 proton with
zyxwvutsrqponmlkjihgfedcbaZYXWVUTSRQPONMLKJIHGFEDCBA
D20
and does not show theabnormal upshift at high pH. The pK in this complex is found to be 6.0, which suggests that the conformation must be pushed toward the “open” configuration when the larger ligand is present.
Recent Raman and FTIR studies have also discussed the concept of “open” and “closed” conformations in a somewhat different context (Chance et al., 1987; Campbell et al., 1987). These authors propose that hydrogen bonds between the heme propionate and, for example, arginine-45 are key factors in regulating the conformational equilibrium. Since X-ray crystallography (Kuriyan et al., 1986) indicates that Arg-45 (CD3) blocks the proposed movement of His-64 (E7), the possibility of another possible site for proton exchange equi- librium needs to be considered.
Unfortunately, the Raman evidence in support of this hy-
pothesis is not definitive. Subtle changes in the
zyxwvutsrqponmlkjihgfedcbaZYXWVUTSRQPONMLKJIHGFEDCBA
u2 region ofthe photoproduct Raman spectra have been attributed
(Campbell et al., 1987) to a depolarized ring mode
zyxwvutsrqponmlkjihgfedcbaZYXWVUTSRQPONMLKJIHGFEDCBA
(ull)sensitive to the heme periphery, rather than the iron-porphyrin displacement as suggested previously (Rousseau & Argade,
1986). In this respect, it is argued, by comparison to the n-butyl isocyanide complex, that the appearance of ull in the photoproduct spectrum indicates the presence of the “open” conformation. The pH studies [see Figure 2 of Campbell et
al. (1987)l seem to contradict this hypothesis, since more
zyxwvutsrqponmlkjihgfedcbaZYXWVUTSRQPONMLKJIHGFEDCBA
Y,,is observed at higher pH when the propionate-arginine hy- drogen bond should be well developed and the pocket closed. Further proposals, based on a His-E7-CO interaction hy- pothesis, associate the open conformation with the A , state (Campbell et al., 1987) and sometimes with the A. state (Chance et al., 1987); the closed conformation is reserved for the A3 state. As discussed above, we believe that the His- E7-CO interaction hypothesis can only be applied to the A3 state and that the A. and A , states represent the major open and closed protein macrostates, respectively. The A3 state should be considered as a subpopulation of the closed con- formation that tracks with A , , but has significantly different local electronic structure and binding properties.
In any event, we tested for the possibility that a second protonation reaction might be connected to the conformational
equilibria by allowing for proton release in the
zyxwvutsrqponmlkjihgfedcbaZYXWVUTSRQPONMLKJIHGFEDCBA
A,-,-
A,equilibria of Scheme I. Since we expect that protonation of the propionate will break the hydrogen bond with Arg-45 (CD3), we associate the second bound proton with the open A. states. Simple algebra shows that K p should be replaced by KplOTH in eq 2 in order to simulate this possibility. The dashed line in Figure 6 is the best fit possible within this more elaborate double-protonation scenario and indicates that the single-protonation reaction coupled with pH-independent conformational change is the preferred model.
At this stage, we should comment on another hypothesis that involves the possibility that the low pH (15.0) might affect the system through proximal histidine protonation. This effect has been explored in detail by Coletta et al. (1 985), and strong evidence has been put forward that indicates proximal histidine
Biochemistry, Vol. 28, No. 11, 1989 4799 protonation at pK = 3.45 for sperm whale myoglobin. We stress, however, that the protonation reaction takes place in the 5-coordinate deoxy species and not in the 6-coordinate CO-bound Mb that is under investigation here. Thus, the thermodynamics of the CO-bound A states, and their pH sensitivity, should not be affected by the separate phenomenon of proximal histidine protonation. Nevertheless, it is important to consider the possibility that certain kinetic measurements at low pH can be affected by the additional rebinding channel associated with the tetracoordinate species. However, steady-state Raman studies are definitive with respect to the presence of a nearly complete (>90%) population of Fe-His bonds (as measured by the 220 cm-’ mode) in the photolyzed material at pH 4.0 (Morikis, unpublished results). This does not necessarily disprove the conclusions of Coletta et al. (1985) but does suggest that the time scale for proximal histidine
protonation/tetracoordination is slower than the rebinding rates at pH 4.0.
These issues are conceivably related to recent work involving low-temperature studies of MbCO at low pH (Doster et al.,
1982) which indicate a significantly lower energy barrier distribution for the rebinding of C O to M b in the A. state. This result is puzzling in view of the recent conclusion of Ansari et al. (1987), from IR kinetic studies, that the A. and A , states have approximately the same barrier heights but significantly different prefactors. The different prefactors have been associated with entropy differences of the unbound C O in the distal pocket (Braunstein et al., 1988). Not only is the smaller entropy associated with the open pocket of the A. state difficult to understand but also the apparent conflict with the low-pH studies of Doster et al. (1982) indicates that additional factors need to be considered. One possibility is that the IR rebinding data, involving the individual A states (Ansari et al., 1987), are not sufficient to uniquely determine the dis- tribution and prefactors. Another possibility is that other rebinding channels are opening up at low pH and complicating the analysis.
In any case, we suggest that the effect of protonation of His-E7 is to shift the equilibrium to the open form and that the subsequent changes in the distal pocket (polarizability, steric factors, etc.) are likely to reduce the rebinding barrier height, as observed by Doster et al. (1982). Further kinetic effects can clearly come about if additional proximal changes are coupled to the “opening” and “closing” of the protein. For example, we should not ignore the possibility of coupled effects involving proximal steric hindrance (Brown et al., 1983) or changes in the iron-porphyrin equilibrium position (Srajer et al., 1988).
Summary. We have used high-resolution resonance Raman spectroscopy to probe the heme and iron-ligand vibrational modes in Mb and its E7 mutants. We find that the heme vibrations are unchanged by the E7 mutations in met-, deoxy-, and CO-bound states. This suggests that no gross changes in the heme environment and protein tertiary structure have occurred as a consequence of the E7 mutations.
On the other hand, the relative intensities of uFeCO at 491 cm-’ ( A o ) and 508 cm-’ ( A , ) are quite sensitive to the E7
mutation as are the analogous uc-0 bands. In contrast to the native and wild-type material, Mb, and MbMa show no pH dependence when the relative intensities of A. and A I are examined. This indicates that His-E7 is the titratable group in native Mb which is coupled to the population dynamics of the protein-ligand system. The existence of both A. and A I
4800
zyxwvutsrqponmlkjihgfedcbaZYXWVUTSRQPONMLKJIHGFEDCBA
Biochemistry,zyxwvutsrqponmlkjihgfedcbaZYXWVUTSRQPONMLKJIHGFEDCBA
Vol. 28, No.zyxwvutsrqponmlkjihgfedcbaZYXWVUTSRQPONMLKJIHGFEDCBA
1 I , 1989zyxwvutsrqponmlkjihgfedcbaZYXWVUTSRQPONMLKJIHGFEDCBA
an interaction could conceivably account for the A , state, sinceit is not detected in the mutant material.
Quantitative studies of the resonance Raman intensities allow us to establish that resonant dispersion, due to different electronic states associated with A . and A l , plays a minor role in determining the relative intensities. On the other hand, there is an unusual pH- and state-dependent variation in the vFA0
coupling strengths for A . and A , .
The A , population exhibits unusually weak vFA0 coupling to the Soret excitation and is thought to represent a slowly rebinding subpopulation of the "closed" configuration that tracks with A l above pH -4.5. Below pH -4.5, both the A , and A I populations are converted to Ao, but with differing equilibria. We have not expanded the multistate system to quantitatively account for this additional process, since the population effects are small4 with respect to the logarithmic scale of Figure 6.
The above observations suggest that the traditional two-state Henderson-Hasselbalch analysis needs to be expanded to (at least) a four-state system of interacting protonation and
conformation equilibria. The measured pKo
zyxwvutsrqponmlkjihgfedcbaZYXWVUTSRQPONMLKJIHGFEDCBA
= 6.0 and pK,= 3.8 are associated with the protonation of His-E7 in the "open" and "closed" positions of the distal pocket. The dif- ference in free energy, 3.0 kcal/mol, is believed to be due to destabilization of the protonated, and positively charged, His-E7 when in the "closed" hydrophobic pocket. At pH 7.0, the four-state analysis leads to a -3% probability for having an "open" pocket. This probability factor is likely to have a direct influence on the observed rates of entry and exit into and out of the heme pocket.
ACKNOWLEDGMENTS
spectrometer.
We thank Clive Perry and Feng Lu for the use of the FTIR
zyxwvutsrqponmlkjihgfedcbaZYXWVUTSRQPONMLKJIHGFEDCBA
Registry No. L-His, 7 1-00- 1; L-Met, 63-68-3; Gly, 56-40-6; heme, 14875-96-8.
REFERENCES
Anderson, L. A., Loehr, T. M., Lim, A. R., & Mauk, A. G. (1984) J . Biol. Chem. 259, 15340.
Ansari, A., Berendzen, J., Braunstein, D., Cowen, B. R., Fraunfelder, H., Hong, M. K., Iben, I. E. T., Johnson, J. B., Ormos, P., Sauke, T. B., Scholl, R., Schulte, A., Steinbach, P. J., Vittitow, J., & Young, R. D. (1987) Biophys. Chem. 26, 337.
Bangcharoenpaurpong, 0. (1987) Ph.D. Thesis, Northeastern University.
Bangcharoenpaurpong, O., Schomacker, K. T., & Champion, P. M. (1984) J . A m . Chem. SOC. 106, 5688.
Bevington, P. R. (1969) Data Reduction and Error Analysis f o r the Physical Sciences, McGraw-Hill, New York. Braunstein, D., Ansari, A., Berendzen, J., Cowen, B. R.,
Egeberg, K. D., Fraunfelder, H., Hong, M. K., Ormos, P., Sauke, T. B., Scholl, R., Schulte, A., Sligar, S . G., Springer, B. A., Steinbach, P. J., & Young, R. D. (1988) Proc. Natl. Acad. Sci. U.S.A. 85, 8497.
Brown, W. E., 111, Sutcliffe, J. W., & Pulsineli, P. D. (1983) Biochemistry 22, 29 14.
Campbell, B. F., Chance, M. R., & Friedman, J. M. (1987) J . Biol. Chem. 262, 14885.
Caughey, W. S., Shimada, H., Choc, M. G., & Tucker, M. P. (1981) Proc. Natl. Acad. Sci. U.S.A. 78, 2903.
Morikis et al.
'
Above pH 4.5, the "open"/'closed" population ratio, N o / ( N ,+
N 3 ) ,would be decreased by ca. 30% with respect to the plotted ratio, N O I N , .
Chance, M. R., Campbell, B., Hoover, R., & Friedman, J. M. (1987) J . Biol. Chem. 262, 6959.
Coletta, M., Ascenzi, P., Traylor, T. G., & Brunori, M. (1 985) J . Biol. Chem. 260, 4151.
Doster, W., Beece, D., Bowne, S. F., DiIorio, E. E., Eisenstein, L., Fraunfelder, H., Reinisch, L., Shyamsunder, E., Win- terhalter, K. H., & Yue, K. T. (1982) Biochemistry 21, 483 1 .
Fuchsman, W. H., & Appleby, C. A. (1979) Biochemistry 18, 1309.
Hayashi, Y., Yamada, H., & Yamagaki, I. (1976) Biochim. Biophys. Acta 427, 608.
Johnson, R. N., Bradbury, J. H., & Appleby, C. A. (1978) J . Biol. Chem. 253, 2148.
Kendrew, J. C., & Parrish, R. G. (1956) Proc. R . Soc. London, A 238, 305.
Kottalam, J., & Case, D. A. (1988) J. Am. Chem. SOC. 110, 7690.
Kuriyan, J., Wilz, S., Karplus, M., & Petsko, G. A. (1986) J . Mol. Biol. 192, 133.
Li, X.-Y., & Spiro, T. G. (1988) J. Am. Chem. Soc. 110,6024. Makinen, M. W., Houtchens, R. A., & Caughey, W. S. (1979)
Proc. Natl. Acad. Sci. U.S.A. 76, 6042.
Maxwell, J. C., & Caughey, W. S. (1976) Biochemistry 15, 388.
Moore, J., Hansen, P., & Hochstrasser, R. (1988) Proc. Natl. Acad. Sci. U.S.A. 85, 5062.
Morikis, D., Sage, J. T., Rizos, A. K., & Champion, P. M.
(1988) J . A m . Chem. SOC.
zyxwvutsrqponmlkjihgfedcbaZYXWVUTSRQPONMLKJIHGFEDCBA
110, 6341.Nagai, K., Luisi, B., Shih, D., Miyazaki, G., Imai, K., Poyart, C., De Young, A,, Kwiatkowski, L., Noble, R. W., Lin, S.-H., & Yu, N.-T. (1987) Nature 329, 858.
Olson, J. S., Mathews, A. J., Rohlfs, R. J., Springer, B. A., Egeberg, K. D., Sligar, S. G., Tame, J., Renaud, J.-P., &
Nagai, K. (1988) Nature (submitted for publication). Ormos, P., Braunstein, D., Fraunfelder, H., Hong, M. K., Lin,
S.-L., Sauke, T. B., & Young, R. D. (1988) Proc. Natl. Acad. Sci. U.S.A. 85, 8492.
Phillips,
S.
E. V., & Schoenborn, B. P. (1981) Nature 292, 81.Reinisch, L., Srajer, V., & Champion, P. M. (1 987) Bull. Am. Phys. SOC. 33, 1412.
Rousseau, D. L., & Argade, P. V. (1986) Proc. Natl. Acad. Sci. U.S.A. 83, 13 10.
Satterlee, J. D. (1984) Biochim. Biophys. Acta 791, 384. Schomacker, K. T., & Champion, P. M. (1989) J . Chem.
Phys. (in press).
Shimada, H., & Caughey, W. S. (1982) J. Biol. Chem. 257, 11893.
Smulevich, G., Mauro, J. M., Fishel, L. A., English, A. M., Kraut, J., & Spiro, T. G. (1988a) Biochemistry 27, 5477. Smulevich, G., Mauro, J. M., Fishel, L. A., English, A. M., Kraut, J., & Spiro T. G. (1988b) Biochemistry 27, 5486. Springer, B. A,, & Sligar, S. G. (1987) Proc. Natl. Acad. Sci.
U.S.A. 84, 8961.
Springer, B. A., Egeberg, K. D., Sligar, S. G., Rohlfs, R. J., Mathews, A. J., & Olson, J. S. (1989) J . Biol. Chem. (in press).
Srajer, V., Reinisch, L., & Champion, P. M. (1988) J . A m . Chem. SOC. 110, 6656.
Uno, T., Nishimura, Y., Tsuboi, M., Makino, R., Iizuka, T.,
& Ishimura, Y. (1987) J . Biol. Chem. 262, 4549. Yu, N.-T., & Kerr, E. A. (1988) in Biological Applications