261
The Effect of Financial Ratios toward Stock Returns among Indonesian
Manufacturing Companies
James Andi Wijaya
International Business Management Program, Petra Christian University Jl. Siwalankerto 121-131, Surabaya
E-mail: [email protected]
ABSTRACT
Indonesian Composite Index (ICI) is the top gainer among major Asia-Pacific indices during 2008-2013. Inside the composite index, manufacturing index showed a stronger growth compared to the composite index. Thus, this study analyzes the influence of financial ratios toward stock returns in Indonesian manufacturing companies. The data in this research are obtained using judgmental sampling method consisting of 100 samples from 20 major listed Indonesian manufacturing companies during 2008-2013. Furthermore, the data were analyzed by using multiple linear regression analysis. The results showed that return on assets, debt to equity, dividend yield, earnings yield, and book to market simultaneously have a significant effect on stock returns. Partially, return on assets, dividend yield, earnings yield, and book to market have significant effects on stock returns. However, debt-to-equity ratio does not have partial significant effect on stock returns.
Keywords: Financial Ratio, Stock Return, Profitability Ratio, Debt Ratio, Market Ratio.
ABSTRAK
Indeks Harga Saham Gabungan Indonesia (IHSG) adalah bertumbuh paling tinggi dibandingkan dengan indeks-indeks utama Asia-Pasifik selama 2008-2013. Di dalam indeks komposit, indeks manufaktur menunjukkan pertumbuhan lebih kuat dibandingkan dengan indeks komposit. Dengan demikian, penelitian ini menganalisis pengaruh rasio keuangan terhadap return saham pada perusahaan manufaktur di Indonesia. Data dalam penelitian ini diperoleh dengan menggunakan metode judgmental sampling yang terdiri dari 100 sampel dari 20 perusahaan manufaktur terdaftar terbesar di Indonesia selama 2008-2013. Selanjutnya, data dianalisis dengan menggunakan analisis regresi linier berganda. Hasil penelitian menunjukkan bahwa return on assets, debt to equity, dividend yield, earnings yield, and book to market secara bersamaan memiliki pengaruh yang signifikan terhadap return saham. Secara parsial, return on assets, debt to equity, dividend yield, earnings yield, and book to market memiliki pengaruh yang signifikan terhadap return saham. Namun, debt to equity ratio tidak berpengaruh signifikan parsial terhadap return saham.
Kata Kunci: Financial Ratio, Stock Return, Profitability Ratio, Debt Ratio, Market Ratio.
INTRODUCTION
It is undeniable that Indonesia is one of the major economies in the world. According to the data from World Bank Organization (2015) that the writer has reprocessed, during year 2013, Indonesia ranked the 16th in terms of GDP out of 188 World Bank’s member countries. Besides, Indonesia is a member of The G20, a world organization that consists of countries with “world’s largest advanced and emerging economies, representing about two-thirds of the world’s population, 85 percent of global gross domestic
262 grew to 4274 at the closing of year 2013, which marks a significant increase of 2,942 points or 220.72% in 5 years’ time (Yahoo! Finance, 2015). This growth is ranked the first among the major Asia Pacific Indices during 2008-2013 (Yahoo! Finance India, 2015). Therefore, the writer conducted deeper investigation toward Indonesian Gross Domestic Products by analyzing the sectorial contribution within the economy. Behind the fact that Indonesia has a great economy and that it is growing steadily, the industry sector that provided the greatest contribution to the economy during year 2013 was the manufacturing industry (Badan Pusat Statistik, 2015). Indonesian statistics shows that manufacturing industry contributed for 24% to Indonesian GDP at current market price, throughout year 2013. Followed by “agriculture, livestock, forestry, fishery industry” (14%), and “trade, hotel & restaurants industry” (14%) (Badan Pusat Statistik, 2015). This condition led the writer to perform further study on investing in Indonesian manufacturing industry. The manufacturing index closed in 2008 at 237 and rose to 1150 at the closing of year 2013, which marks an increase of 913 points or 385.23% in 5 years’ time (Yahoo! Finance, 2015). This fact marks that the Indonesian manufacturing index grows much higher compared to the Indonesian composite index that only grows for 220.87% during the same period. Such growth in the index must have attracted investors, both local and foreign, to invest in this industry. Hence, the writer is interested to see the condition of investment among listed Indonesian manufacturing companies. Despite the compelling increase in Indonesian manufacturing index during 2008 - 2013, investing in manufacturing stocks does not guarantee positive return. The return of investment in these stocks may vary according to the performance of the invested companies.
As an example, the writer uses a stock from the manufacturing index, PT. Gudang Garam Tbk. During February 2011, the share price of PT. Gudang Garam Tbk was at IDR 36,550. Only 9 months after, the stock rose up to IDR 65,000 in November, an increase of 77.84%. However, this price level did not last long. It was going down until September 2013 and touched the price as low as IDR 35,000 (Yahoo! Finance, 2015). The writer thinks that this example of wide and fluctuating price movement in the manufacturing stock indicates that there are risks of investing in manufacturing companies. The writer suspects that such price movement is driven by under-valuation or over-valuation of the stock, which will lead the price to the equilibrium. Due to the potential risks of investing in manufacturing stocks, the writer intends to choose the companies in Indonesian manufacturing index as an object of research. IDX Fact Book (2014) mentioned that manufacturing or processing industry is considered as a secondary sector that possesses 3 subcategories: basic industry and chemicals, miscellaneous industry, and consumer goods industry. There are currently 142 companies, which are listed in the manufacturing industry. From the 142 companies, 65 companies are listed in the basic industry subcategory, 41 companies are listed in the miscellaneous industry subcategory, and 36 companies are
listed in consumer goods industry subcategory (PT. Bursa Efek Indonesia, 2014). From the set of research object mentioned previously, the writer aims to understand the driving indicators of the stock return to be retrieved from companies’ financial statement in Indonesian manufacturing index, which are the financial ratios.
It is imperative to use information from the company’s financial statement in order to understand the indicators, which drive stock return. Thus, the required information will be able to lead investors in order to gain consistent return in the stock market. According to Gitman and Zutter (2012), there are four key financial statements that stakeholders need to understand in measuring the performance of a company: the income statement, the balance sheet, the statement of stockholder’s equity and the statement of cash flow. They also stated that the information contained in the four basic financial statements is of major significance to a variety of interested parties who regularly need to have relative measures of the company’s performance, which is through ratio analysis (Gitman & Zutter, 2012). Therefore, this research will prove whether financial ratios can be a set of determinants to predict future stock return.
Gitman and Zutter mentioned that financial ratio can be divided into five basic categories: liquidity, activity, debt, profitability and market ratios (Gitman & Zutter, 2012). However, in this research, the writer will focus to analyze the effect of profitability, debt, and market ratio toward stock return. Several previous research revealed the significant effect of profitability, debt, and market ratios toward stock return. Farkhan & Ika (2013) stated that liquidity, debt, activity, profitability and market ratios have significant influence on stock return Indonesian in food and beverage industry (Farkhan & Ika, 2013). Another research from Hermawan (2012) also revealed the significant effect of debt, market, and profitability ratio toward stock return in Indonesian banking industry (Hermawan, 2012). Moreover, Kheradyar and Ibrahim (2011) mentioned that market ratio gives significant influence toward stock return in Bursa Malaysia Index (Kheradyar & Ibrahim, 2011). From the three previous research, the writer intend to conduct a study of the effect of profitability, debt, and market ratios as the predictors of stock return in Indonesian manufacturing companies during 2008 – 2013.
LITERATURE REVIEW
Prior to conducting the research, there are two necessary concepts required to be understood. The first concept is about the theory of financial ratio that explains the variables of financial ratio. The second concept is about the theory of stock return that explains the mechanism of calculating the stock return.
263 either a percentage, a rate, or a simple proportion. Moreover, Weygandt, Kimmel, Kieso (2010) mentioned that financial statement is a set of accounting reports, consisting collected information presented to interested users. The financial statements are prepared in four sets of information, which are: Income statement, Owner’s equity statement, balance sheet, and statement of cash flows. Income statement focuses on describing the revenues and the expenses of a company in a specific period of time that result in net income or net loss. On the other hand, interested parties can understand the changes in owner’s equity for a specific period of time by understanding owner’s equity statement. Balance sheet shows the condition of the company’s assets, liabilities, and owner’s equity at a specific period of time. Finally, interested parties can perceive the information of cash inflows and outflows of a company in a specific period of time by reading the company’s statement of cash flows (Weygandt, Kimmel, & Kieso, 2010).
Besides, Ross, Westerfield and Jordan (2003) mentioned that there are six benefits of financial ratios that can be calculated by using variables commonly found on financial statements (Delen, Kuzey, & Uyar, 2013).
The benefits they found were, to measure the performance of managers for the purpose of rewards, to measure the performance of departments within multi-level companies, to project the future by supplying historical information to existing or potential investors, to provide information to creditors and suppliers, to evaluate competitive positions of rivals, and to evaluate the financial performance of acquisitions. Gitman & Zutter (2012) categorized financial ratios into liquidity, activity, debt, profitability and market ratios. Based on the relevant previous studies and the objectives of this research, the writer will focus on defining the concepts of profitability, debt, and market ratios.
Gitman & Zutter (2012) explained that “profitability ratio is used to measure the company’s return”. On the other hand, Weygandt, Kimmel and Kieso (2010) stated that “profitability ratios measure the income or operating success of a company for a given period of time”. They also said that profitability ratios help analysts to test corporate management’s operating effectiveness (Weygandt, Kimmel, & Kieso, 2010). One of the commonly used profitability ratios is return on assets. Weygandt, Kimmel, and Kieso (2010) defines return on assets “as an overall measure of profitability that is calculated by dividing net income by average assets”. They also stated that net income is the excess result of the company’s revenue minus its expenses. Otherwise, when expenses exceeds revenues, the result, it is defined as net loss. They continues by explaining that “assets are resources owned by a business purposed to carry out business activities that is expected to result in production and sales”. Thus, the formula of return on assets is (Weygandt, Kimmel, & Kieso, 2010):
Return on Assets = Net Income / Average Assets
The writer chooses to use return on assets because it is an indicator to measure the overall effectiveness of a
company’s management in bearing profits with the assets entrusted to it (Gitman & Zutter, 2012).
Gitman & Zutter (2012) explained that “debt ratio is used to measure the company’s risk”. Weygandt, Kimmel and Kieso (2010) also stated that “debt or solvency ratios measure the ability of a company to survive over a long period of time”. Moreover, Foltz and Wilson (2011) stated that the easiest and most often cited measure of debt ratios is the debt-to- equity (D/E) ratio. They also mentioned that it indicates the relative proportion of owner’s equity and debt used to finance a firm’s assets. According to Dennis Schlais, Richard Davis, and Kristi Schlais (2011), debt is “money borrowed with a promise or an obligation to repay the value and the interest of the debt”. Gitman and Zutter (2012) defines interest as the compensation paid by the borrower of money to the lender as the cost of borrowing the money. There are two types of debt which are, short term debt and long term debt. Weygandt, Kimmel and Kieso (2010) defined short term debt or current liability as debts having the characteristics as follows: debts are to be paid from existing current assets or through the creation of other current liabilities and debts are to be paid within one year or within one operating cycle, whichever is longer.
On the other hand, Weygandt, Kimmel and Kieso (2010) defines long term debt or liabilities as “obligations that are expected to be paid after one year”. Also, they explains equity as “the ownership claim on total assets” (Weygandt, Kimmel, & Kieso, 2010). Foltz & Wilson (2011) calculate debt to equity ratio as follows:
Debt to Equity Ratio = (Short term debt+Long term debt) / (Total equity)
The writer chooses debt to equity ratio because this indicator is also presented in Indonesian Stock Exchange annual report (PT. Bursa Efek Indonesia, 2014).
Gitman and Zutter (2012) explained that “market ratio relates the firm’s market value, as measured by its current share price, to certain accounting variables”. They also stated that it provides insight about the investors’ feeling and perception toward the company’s business performance in terms of risk and return. It means that the ratios included in market ratio relatively reflects the common stockholder’s assessment toward the company’s past and potential performance. In short, market ratios measure both the risk and the return of a company (Gitman & Zutter, 2012). Some commonly used market ratios are dividend yield, earnings yield, and book to market ratio. Black and Scholes (1974) measured dividend yield by using the ratio between dividends paid during the prior year and the stock price at the end of the previous year (Lemmon & Nguyen, 2014). Thus, the formula of dividend yield is as follows:
Dividend Yield = Dividend (t) / Share Price (t-1)
264 defines price “as the cost to be paid or the revenue gained from a good or service and are thereby directly linked to the distribution of wealth”. Moreover, Gitman, Zutter, Elali, and Roubaie (2013) stated that stock price is “the reflection of the true value based on risk and return”. Based on the definitions above, the writer can define stock price as the cost to be paid from the purchase of parts of corporate ownership.
Chiarella, Gao, and Stevenson (2008) define earnings yield as the reciprocal of price earnings ratio. They calculated earnings yield as follows:
Earnings Yield = Earnings per share (t) / Share Price (t-1)
Gitman and Zutter (2012) defines earnings per share as “the amount of money earned during the period on behalf of each outstanding share of common stock”.
Furthermore, Berk (1995) suggests that book to market ratio might be a tool to measure the risk of investment. Berk, Green, and Naik (1999) mentioned that book-to-market value of equity serves as a variable summarizing the firm’s risk relative to the scale of the asset base (Anderson & Garcia-Feijóo, 2002). Leong, Pagani and Zaima (2009) calculated book to market ratio as follows:
B/M ratio = (Total Assets -Total Debt) / (Market Price x Number of Common Stocks Shares Outstanding)
Gitman and Zutter (2012) defines outstanding shares as “issued shares of common stock held by investors, including both private and public investors”. Kothari and Shanken (1997) and Pontiff and Schall (1998) stated that book to market ratio can strongly predict stock returns. Since book to market ratio act as the predictor of stock return, the writer will calculate it in the previous period of each stock return data (B/Mt-1). The usage of these three market ratios follow the previous research of Kheradyar & Ibrahim (2011).
Robert Ang (1997) defined stock return as the level of profit enjoyed by an investor for his investment (Farkhan & Ika, 2013). Besides, Gitman & Zutter (2012) defines return as: “The total gain or loss experienced on an investment over a given period of time”. It is calculated by dividing the asset’s change in value plus any cash distributions during the period by its beginning-of-period investment value” (Linawati & Willy, 2000). There are many factors that may influence of stock return. Financial ratios are one of the factors used in predicting the stock return (Kheradyar & Ibrahim, 2011). Some ratios that are possible to be used in predicting stock returns are return on assets (Farkhan & Ika, 2013), debt to equity ratio (Hermawan, 2012), dividend yield, earnings yield, book to market ratios (Kheradyar & Ibrahim, 2011). The formula for calculating stock return is as follows (Myles, 2003):
Stock Return = [Share Price (t) + Dividends (t) – Share Price (t-1)] / Share Price (t-1)
The writer uses two concepts, which are the financial ratios and stock return, as the foundation in conducting this research. In this research, the financial ratios will show an
analysis of profitability, debt, and market ratios of the companies listed in Indonesian Manufacturing Index, which includes basic industry and chemicals, miscellaneous industry, and consumer goods industry. Using these companies as the object of the research, the writer later study the cause-effect relationship between these financial ratios and stock return (Farkhan & Ika, 2013; Hermawan, 2012; Kheradyar & Ibrahim, 2011).
Gitman and Zutter (2012) stated that “return on assets measures the effectiveness of management in generating profit with its available assets”. Thus, the higher the return on assets, the better the performance of the management in a company. Moreover, Farkhan and Ika (2013) mentioned in their research that return on assets has significant positive influence toward stock return. It means that effective management will allow stock returns to be higher.
On the other hand, Gitman & Zutter (2012) stated that the higher the debt in a company, the higher the chance of bankruptcy. Also, Hermawan (2012) stated that debt to equity ratio has negative significant influence toward stock return. It means that the higher the debt ratio, the higher the risk of bankruptcy. Therefore, the higher the debt to equity ratio the worse the stock return will be.
The writer has explained earlier that dividend yield is a measure of how much a company distribute cash dividend compared to its share price. The higher the dividend yield will lead to higher cash inflow from the stock investment. Besides, Kheradyar and Ibrahim (2011) proved that dividend yield has a significant positive influence on stock return. It means that the higher the dividend yield of a company, the higher the stock return will be.
The writer also dicussed earlier that earnings yield is a ratio that compares the earnings per share and the share price. The higher the earnings yield indicates that a share contains undistributed earnings. Kheradyar and Ibrahim (2011) stated in their research that earnings yield has a positive significant influence toward stock return. Thus, the higher the earnigs yield, the higher the stock return will be.
Finally, as discussed earlier, book to market ratio measures the company’s risk relative to its net book value. The calculation of book to market ratio indicates that the higher the book to market ratio, the less an investor pay for the stock relative to its net book value. Kheradyar and Ibrahim (2011) mentioned that book to market ratio has significant positive influence on stock return. Thus, the higher the book to market ratio when the investor purchase a stock, the higher the stock return will be.
265
RESEARCH METHOD
The type of this research is quantitative research, because the writer aims to accurately measure the influence of financial ratios toward stock return among listed companies in Indonesian Manufacturing Index during 2008 – 2013. The collected data will be processed using PASW (Predictive Analytics SoftWare) Statistics 18 with multiple regression analysis. This research intends to seek for the cause-effect relationship between Financial Ratios and Stock Returns among companies listed in Indonesian Manufacturing Index. Hence, there are several variables to be classified into independent and dependent variables.
There is a single dependent variable in this research, which is the stock return (Y) of companies listed in Indonesian Manufacturing Index. This variable will be measured by using the formula mentioned in the previous chapter. This dependent variable is predicted to be under the influence of the independent variables. The independent variables in this research is the financial ratios. As mentioned in the previous chapter, the writer intends to test profitability, debt, and market ratio as the representatives of financial ratios (Farkhan & Ika, 2013; Hermawan, 2012; Kheradyar & Ibrahim, 2011). Based on the previous studies that the writer has reviewed, the profitability ratios will be measured by return on assets (Farkhan & Ika, 2013).
On the other hand, the debt ratios will be measured by debt-to-equity ratio (Hermawan, 2012). Moreover, the market ratios will be measured by dividend yields, earnings yield, and book-to-market ratio (Kheradyar & Ibrahim, 2011). As a result, there will be five independent variables, which are return on assets (X1), debt-to-equity ratio (X2),
dividend yields (X3), earnings yield (X4), and book-to-market
ratio (X5). As this research will collect financial data from the
annual reports of listed manufacturing companies in Indonesia, the type of data used for both independent and dependent variables will be the ratio data.
The source of data, this research will use secondary data. The writer will use data from the sample companies’ annual reports drawn from their corporate websites and from the database of PT. Bursa Efek Indonesia (www.idx.co.id). Also, the writer takes available information in form of journals, articles, textbooks, and website for the purpose of background theories and supporting references. By combining these sources, the writer believes that this research will provide significant information for the analysis of the influence of financial ratios toward stock return in Indonesian Manufacturing Index.
In this research, the writer will conduct restricted non-probability sampling, or purposive sampling. The population within this study are manufacturing companies listed in Indonesian Stock Exchange from year 2008 to year 2013. There are 142 manufacturing companies listed in Indonesian Stock Exchange; they are collected from basic industry and chemicals, miscellaneous industry, and consumer goods industry. From this population, the writer will conduct judgment sampling by setting several characteristics. Firstly, the writer will choose manufacturing companies, which publish annual reports from year 2008 to 2013 because the writer intends to study the effect of financial ratios toward
stock return in manufacturing companies within this period. Secondly, the writer will select 20 listed manufacturing companies with top market capitalization. The writer choose this sampling policy because the performance of stocks with small market capitalization is barely stable and may be upturned in particular investment climates (Reinganum, 1999). Finally, for the credibility of data, the writer will choose listed manufacturing companies which are audited by independent auditors. Thus, according to the characteristics above, the selected samples are:
1. Astra International Tbk. 2. HM Sampoerna Tbk. 3. Unilever Indonesia Tbk. 4. Semen Indonesia (Persero) Tbk. 5. Indocement Tunggal Prakarsa Tbk. 6. Kalbe Farma Tbk.
7. Charoen Pokphand Indonesia Tbk. 8. Multi Bintang Indonesia Tbk. 9. Astra Otoparts Tbk.
10. Ultrajaya Milk Industry & Trading Co. Tbk. 11. Indomobil Sukses Internasional Tbk. 12. JAPFA Comfeed Indonesia Tbk. 13. Kimia Farma (Persero) Tbk. 14. Tiga Pilar Sejahtera Food Tbk. 15. Selamat Sempurna Tbk. 16. Citra Tubindo Tbk. 17. Gajah Tunggal Tbk. 18. Fajar Surya Wisesa Tbk. 19. Mandom Indonesia Tbk. 20. Merck Tbk.
To evaluate and select information source, there are five requirements needed to be met, which are purpose, scope, authority, audience, and format.
In order to evaluate the purpose of the information source, we must understand “the explicit or hidden agenda of the information source” (Cooper & Schindler, 2014). The purpose of the information source, the annual report of the company, is to inform the financial position of a company companies to its stakeholders.
Furthermore, to evaluate the scope of the information source, we need to understand “the breadth and depth of topic coverage, including time period, geographic limitations, and the criteria for information inclusion” (Cooper & Schindler, 2014). The scope of the information source covers the activities conducted by companies within in each of their fiscal year covering from year 2008 until 2013.
266 recorded at year end. It is recorded by PT. Bursa Efek Indonesia, which has the official right to manage information in Indonesian stock exchange, including the publication of year-end stock price (Undang - Undang Republik Indonesia Nomor 8 Tahun 1995 Tentang Pasar Modal, 1995).
Moreover, to evaluate the audience of the information source, we need to understand “the characteristics and background of the people or groups for whom the source was created” (Cooper & Schindler, 2014). The information collected for both independent and dependent variables are aimed to provide public information, especially for investors, stakeholders and shareholders who own certain interests toward related companies. In addition, the spectators of this information source are not able to influence the type and bias of the information.
Finally, to evaluate the format of the information source, we need to understand “how the information is presented and the degree of ease of locating specific information within the source” (Cooper & Schindler, 2014). The format of the source of information in this research is presented in the corporate website and the official website of Indonesian Stock Exchange. The annual reports contain multiple purpose of information within the company that can be accessed easily by following the list of content within the report. On the other hand, the stock price information can also be accessed easily by following the list of content of the annual report or by following the directories provided by the official Indonesian Stock Exchange website.
Since the writer draws the information from published audited annual reports and Indonesia stock exchange’s official publications, covering financial statements and stock price at year end, the selected sources of information have the qualifications to be credible and therefore are valid to be used in this study.
Also, the data gathered in this study is consistent and accurate, and therefore are reliable. The independent variables in this research will use the data from sample companies’ annual reports, which are regularly audited by independent institutions and are published annually at the end of fiscal year from 2008 to 2013. Moreover, the dependent variable in this research, which is the stock return, will use the information drawn from the calculation of year-end closing stock price and distributed dividends published by sample companies in their annual reports and Indonesia Stock Exchange’s official website.
As the initial step in conducting the multiple linear regression analysis, classic assumption test has to be conducted. The classic assumption test consists of the 4 following tests.
According to Ghozali (2013), normality test is a statistical assessment that aims to test whether confounding variables or residuals are normally distributed in a regression model. Basically, the residuals are assumed by t-test and the F-test to follow normal distribution. Ghozali (2013) also stated that if the assumption is violated, the statistical test would be invalid for a small number of samples. Ghozali (2013) stated that statistical analysis can be done by examining the kurtosis and skewness values of the residual.
Ghozali (2013) stated that skewness and kurtosis can be converted to z-scores using the formulas below:
Zskewness = Skewness/(√6/N)
Zkurtosis = Kurtosis/(√24/N)
As a decision rule, Ghozali (2013) stated that, by using 5% as the level of significance, when the calculated Z-value is greater than 1.96, it means that residuals are not normally distributed. Otherwise, when the calculated Z-value is lower than 1.96, it means that residuals are normally distributed.
Ghozali (2013) defines autocorrelation test as a statistical test that aims to examine whether there is correlation between the residual of a certain period (t) with the residual of its preceding period (t-1). Field (2009) stated that “the residual terms of any two observations should be uncorrelated or independent”. He also mentioned that “autocorrelation can be tested using Durbin-Watson Test, which tests for serial correlations between errors” (Field, 2009).
The range of the test can vary between “0” to “4”. The value of 2 in this test means that the residuals are uncorrelated. On the other hand, Field (2009) emphasized that “a value greater than 2 indicates a negative correlation between adjacent residuals, whereas a value below 2 indicates a positive correlation”.
Field (2009) stated that, as a very conservative rule of thumb, “Values less than 1 or greater than 3 are definitely cause for concern”. It means that the value of Durbin-Watson test should be near to 2 to pass this test. Thus, when the Durbin Watson test shows any values less than 1 or greater than 3, the regression model is free from autocorrelation.
According to Field (2009), multicollinearity is a problem that may show up in multiple regression analysis when there is a strong correlation between two or more predictors in a regression model. One way to test the existence of multicollinearity is by using variance inflation factor that is developed by PASW Statistics 18. The VIF indicates whether a predictor has a strong linear relationship with the other predictor(s) (Field, 2009). The higher the VIF the higher degree of collinearity. A condition when all the predictor variables are not correlated to each other will result a VIF value of 1. Nonetheless, Myers (1990) implied that predictor variable that is highly correlated to other predictor variable (s) will have the VIF of more than 10 (Field, 2009). When VIF is still equal or lower than 10, it can be said that multicollinearity does not exist in the regression model. Otherwise, when VIF is greater than 10, multicollinearity exists.
267 If the output of this test shows a higher value of significance or P-value than the significance level (0.05), heteroscedasticity does not exist. Otherwise, if the output of this test shows a lower value of significance or P-value than the significance level (0.05), heteroscedasticity exists (Ghozali, 2013).
Ghozali (2013) stated that the purpose of regression analysis is to understand the intensity of the correlation between two variables or more and to demonstrate the association between independent and dependent variables.
Field (2009) stated the equation of multiple regression analysis is as follows:
Y = (b0 + b1X1 + b2X2 + . . . + bnXn) + ε
Y = the outcome variable b0 = the intercept
b1 = the coefficient of the first predictor (X1)
X1 = the first predictor variable
b2 = the coefficient of the second predictor (X2)
X2 = the second predictor variable
bn = the coefficient of the nth predictor (Xn)
Xn = the nth predictor variable
ε = the difference between the predicted and the observed value of Y for the ith participant.
Ghozali (2013) explains that the aim of F-test is to understand whether the entire independent variables in the regression model possess a simultaneous influence on dependent variable. In order to recognize whether there is a simultaneous influence, there are two hypotheses, which are:
H0: β1= β2= …...= βn = 0
HA : β1 ≠ β2 ≠ ... ≠ βn ≠ 0
Ghozali (2013) mentioned the criteria to determine the result of F-test is by looking at the significance F (p-value). When the significance F (p-value) is above the significance level (0.05) then HA is rejected and H0 is accepted. When H0
is accepted, in means that all independent variables do not simultaneously influence the dependent variable. On the contrary, when the p-value is below significance level, HA is
accepted, it means that all independent variables simultaneously influence the dependent variable.
Ghozali (2013) stated that the purpose of t-test is to understand the extent to which a singular independent variable may influence the dependent variable. To conduct a t-test, two hypotheses will be tested, which are:
H0: βn = 0
HA: βn ≠ 0
Ghozali (2013) mentioned the criteria to determine the result of T-test is by looking at the p-value. When the p-value is above the significance level (0.05) then HA is rejected and
H0 is accepted. When H0 is accepted, in means that a
particular independent variable does not influence the dependent variable. On the contrary, when significance value is below the significance level, HA is accepted, it means that
a particular independent variable influences the dependent variable.
According to Field (2009), adjusted R2 is defined as
“an indication that shows how much variance in dependent variable to be explained for when the model had been derived from the population from which the sample was taken”. On the other hand, R2 is “an indication showing the degree of
variance in dependent variables explained by the regression model only from the samples”. Field (2009) explained that the closer the value of adjusted R2 to 1, the more variation in
the dependent variable can be indicated by the regression model. On the contrary, the closer the value of adjusted R2 to
0, the less the variation in the dependent variable can be described by the regression model.
RESULTS AND DISCUSSION
As explained previously, the data in this research comes from the annual reports of 20 listed manufacturing companies within year 2008 to year 2013. The collected data includes return on assets, debt to equity ratio, dividend yield, earnings yield, book to market ratio, and stock return that results in 100 samples. Interestingly, from the samples, the writer found out that stock return from manufacturing companies in 2009-2013 have an average value of 67.32%. Also, the return on assets among the samples have an average number of 18.89%, which is much less than the average stock return. Moreover, sample manufacturing companies have an average dividend yield of 5.39% and average earnings yield of 26.23% with an average book to market ratio of 0.72.
From the classic assumption tests conducted, the writer found that the model does not pass normality and heteroscedasticity tests. It means that the data in this research is not normally distributed and that there is heteroscedasticity between the residuals in the regression model. Since the model does not simultaneously pass all of the classic assumption tests, the model, the writer has to conduct data treatment. In order to solve both issues, Ghozali (2013) suggests transforming the regression model into double log regression model. The data in this research contains negative and zero values. Thus, the writer will add a constant of 0.5 to eliminate negative and zero values. The formula of the double log regression is shown below.
Ln(Y+0.5) = β1 + β2 Ln(X1+0.5) + β2 LN(X2+0.5) + β3 LN(X3+0.5) + β4 LN(X4+0.5) + β5 LN(X5+0.5)
Y = Stock Return X1 = Return on Assets
X2 = Debt to Equity Ratio
X3 = Dividend Yield
X4 = Earnings Yield
X5 = Book to Market Ratio
268 heteroscedasticity issues. Thus, the writer can proceed to conduct statistical test for further analysis.
After passing the classic assumption test, the transformed data is ready to be statistically tested. Thus, both transformed independent and dependent variables will be further analyzed using the multiple linear regression analysis. Under this analysis, the writer will conduct F-test and the t-test, as well as the analysis toward the adjusted R2.
To understand whether the entire independent variables in the regression model possess a simultaneous influence on dependent variable, the writer will use F-test on the transformed data. There are two hypotheses to be tested, which are:
H0: There is no significant simultaneous influence of
profitability, debt, and market ratio toward stock return among listed companies in Indonesian Manufacturing Index during 2008 – 2013 (β1 = β2 = …...= βn = 0).
HA: There is a significant simultaneous influence of
profitability, debt, and market ratio toward stock return among listed companies in Indonesian Manufacturing Index during 2008 –2013 (β1≠ β2≠ ... ≠ βn≠ 0).
As a decision rule, when the significance F (p-value) is above the significance level (0.05) then HA is rejected and H0
is accepted. The F-test on double log regression is conducted using PASW Statistics 18 with linear regression analysis. The result of it can be seen in the ANOVA table below.
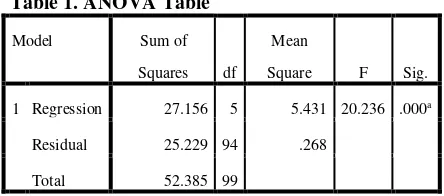
Table 1. ANOVA Table
Model Sum of
Squares df
Mean
Square F Sig.
1 Regression 27.156 5 5.431 20.236 .000a
Residual 25.229 94 .268
Total 52.385 99
a. Predictors: (Constant), BM, DY, DER, EY, ROA
b. Dependent Variable: SR
From the table above, it is seen that the significance F is 0.000, or far below the significance level (�) of 0.05. Thus, H0 is rejected and there is a significant simultaneous
influence of profitability, debt, and market ratio toward stock return among listed companies in Indonesian Manufacturing Index during 2008 – 2013.
After conducting the F-test, the writer needs to understand the extent to which a singular independent variable may influence the dependent variable. Thus, the writer uses the T-test on the transformed data. There are five independent variable to be tested in this test. Hence, the writer has developed null and alternative hypotheses for each of the financial ratio tested, which are:
1. Return on Assets
H0: Return on assets does not have a significant influence
on stock return (β1=0).
HA: Return on assets has a significant influence on stock
return (β1≠0)
2. Debt to Equity Ratio
H0: Debt to equity ratio does not have a significant
influence on stock return (β2=0).
HA: Debt to equity ratio has a significant influence on stock
return (β2 ≠ 0). 3. Dividend Yield
H0: Dividend yield does not have a significant influence on
stock return (β3=0).
HA: Dividend yield has a significant influence on stock
return (β3≠0)
4. Earnings Yield
H0: Earnings yield does not have a significant influence on
stock return (β4=0).
HA: Earnings yield has a significant influence on stock
return (β4≠0)
5. Book to Market Ratio
H0: Book to market ratio does not have a significant
influence on stock return (β5=0).
HA: Book to market ratio has a significant influence on
stock return (β5≠0)
Table 2. Summary of t-test Results
Model Unstandardized
Coefficients
Standardized
Coefficients
t Sig. B
Std.
Error Beta
1 (Constant) 1.251 .266 4.707 .000
ROA 1.453 .402 .381 3.612 .000
DER -.025 .125 -.018 -.197 .844
DY .970 .384 .190 2.526 .013
EY .566 .176 .314 3.217 .002
BM .536 .149 .383 3.593 .001
a. Dependent Variable: SR
269 Ln(Y+0.5) = 1.251 + 1.453 Ln(X1+0.5) – 0.025 LN(X2+0.5) + 0.97 LN(X3+0.5) + 0.566 LN(X4+0.5) + 0.536 LN(X5+0.5) (4.2)
Y = Stock Return X1 = Return on Assets
X2 = Debt to Equity Ratio
X3 = Dividend Yield
X4 = Earnings Yield
X5 = Book to Market Ratio
Furthermore, the table enables the writer to decide which hypothesis to be accepted among each variables.
The p-value of return on assets is 0.00, which is below the significance level (0.05). Thus, HA is accepted and return
on assets has significant influence on stock return. Having an unstandardized beta coefficient of 1.453, it means that for every 1 percent increase in the return on assets + 0.5, stock return + 0.5 will increase by 1.453 percent.
The p-value of debt to equity ratio is 0.844, which is above the significance level (0.05). Thus, HA is rejected and
debt to equity ratio does not have significant influence on stock return. Even though this variable has an unstandardized beta coefficient of -.025, the writer cannot conclude that for every 1 percent increase in debt to equity ratio + 0.5, stock return + 0.5 will decrease by 0.025 percent.
The p-value of dividend yield is 0.013, which is below the significance level (0.05). Thus, HA is accepted and
dividend yield has significant influence on stock return. Having an unstandardized beta coefficient of 0.97, it means that for every 1 percent increase in dividend yield + 0.5, stock return + 0.5 will increase by 0.97 percent.
The p-value of earnings yield is 0.002, which is below the significance level (0.05). Thus, HA is accepted and
earnings yield has significant influence on stock return. Having an unstandardized beta coefficient of .566, it means that for every 1 percent increase in earnings yield +0.5, stock return + 0.5 will increase by 0.566 percent.
The p-value of book to market ratio is 0.001, which is below the significance level (0.05). Thus, HA is accepted and
book to market ratio has significant influence on stock return. Having an unstandardized beta coefficient of 0.536, it means that for every 1 percent increase in book to market ratio + 0.5, stock return + 0.5 will increase by 0.536 percent.
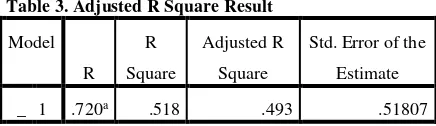
To proceed further, the writer needs to analyze the adjusted R square result. Adjusted R2 is an indication that
shows how much variance in dependent variable can explained for when the model had been derived from the population from which the sample was taken. The model summary in the table below shows that the adjusted R2 value
of the regression model is 0.493. It means that 49.3% variance in stock return can explained by return on assets, debt to equity ratio, dividend yield, earnings yield, and book to market ratio, when the model had been derived from the population from which the sample was taken.
Table 3. Adjusted R Square Result
Model
R R
Square
Adjusted R
Square
Std. Error of the
Estimate
_ 1 .720a .518 .493 .51807
a. Predictors: (Constant), BM, DY, DER, EY, ROA
This outcome is consistent with the finding in “The Impact of Financial Ratios toward The Stock Return of Food and Beverage Manufacturing Companies in Indonesian Stock Exchange” by Farkhan & Ika (2013) that says return on assets has a partial impact toward stock return. Also, it is consistent with the findings in “Financial Ratios as Empirical Predictors of Stock Return” by Kheradyar & Ibrahim (2011) that stated dividend yield, earnings yield, and book to market ratio have partial influence toward stock return.
On the other hand, the fact that debt to equity ratio does not have a partial significant influence on stock return among listed companies in Indonesian Manufacturing Index during 2008 – 2013. This finding is not consistent with the findings in “The Impact of Financial Ratios toward The Stock Return of Food and Beverage Manufacturing Companies in Indonesian Stock Exchange” by Farkhan & Ika (2013) and the findings in “The Influence of Debt to Equity Ratio, Earning Per Share, and Net Profit Margin toward Stock Return” by Hermawan (2012), that stated debt to equity ratio has significant partial influence on stock return. Thus, this research has proven that most investors in listed Indonesian manufacturing companies do not pay attention to debt to equity ratio since this variable does not significantly affect the stock return. The insignificant influence of debt to equity ratio toward stock return is also mentioned by Adi, Darminto, and Atmanto (2013) in their research on listed consumer goods companies in period of 2008 – 2011.
Since the t-test shows a negative unstandardized beta coefficients of -0.025 on debt to equity, the writer thinks that debt to equity ratio has a slight negative correlation on stock return, though insignificant. Gitman & Zutter (2012) stated that the higher the debt in a company, the higher the chance of bankruptcy. In fact, when a company is indebted, it is required to pay interest. Thus, its profitability may decrease as they pay the interest to the lender. Both the risk of bankruptcy and the obligation to pay interest may hurt stock return.
However, debt is not always bad. Gitman and Zutter (2012) commented on signaling theory that debt financing may be a positive signal that the management of a company may see the company’s stocks as undervalued stocks. Thus, due to a profitable investment opportunity, managers of the company may choose debt financing so that shareholders are benefited by the positive net cash flow from the discrepancies between fixed interest payment and a positive cash flow from the investment.
270 zero-sum variable that has no significant effect on stock return.
Finally, the adjusted R Square result shows that 49.3% variance in stock return can explained by return on assets, debt to equity ratio, dividend yield, earnings yield, and book to market ratio, when the model had been obtained from the population from which the sample was taken. The rest of the variance in stock return can be explained by other variables outside this model. Ferson and Harvey (1994) mentioned that equity return is strongly affected by interest rate and gross domestic product growth. Also, Haugen and Baker (1996) stated that the determinants of stock return are related to risk, liquidity, price-level, growth potential, and stock price history. Hence, the writer suspects that the remaining variance in stock return can be explained by other variables that can be categorized into macro-economic performance, other valuation ratios than book to market ratio, stock liquidity, potential growth, and stock price history.
CONCLUSION
In this chapter, the writer will summarize all the discussions and research findings that have been made in the entire study. This research focuses on analyzing the effect of financial ratios toward stock return among Indonesian manufacturing industry. The samples are taken using judgmental sampling from the population of listed Indonesian manufacturing companies that results in 100 data from 20 companies. Furthermore, before the data is statistically analyzed, classic assumption tests are required to be conducted. Unfortunately, the data does not pass normality and heteroscedasticity tests. Thus, data is transformed using double log regression.
After transformed, the classic assumption test is rerun. This time, the transformed data passes the whole classic assumption test. Moreover, this research has revealed that profitability, debt, and market ratio have simultaneous influence on stock return among listed companies in Indonesian Manufacturing Index during 2008 – 2013from the F-test result. This research also proves that return on assets, dividend yield, earnings yield, and book to market ratio partially have significant influence on stock return among listed companies in Indonesian Manufacturing Index during 2008 – 2013. Among these variables, return on assets is proven to have the strongest influence on stock return. However, this research fails to prove whether debt to equity ratio has a significant individual influence on stock return among listed companies in Indonesian Manufacturing Index during 2008 – 2013.
Having explained the conclusions and recommendations of this research, the writer understands that there are some limitations within this research. In this research, the writer uses only manufacturing industry as the research object. In fact, inside the Indonesian economy, there are many other industries such as finance, agriculture, trade, property, construction, services, infrastructure, communications, and mining industries. Had the writer include those industries, the findings in this research may have cross-industries applicability.
Despite the findings discovered in this research, it still has limitations and possible improvement to be done. The
writer suggests that future researchers may use other industries inside the Indonesian economy. The possible industries may be finance, agriculture, trade, property, construction, services, infrastructure, communications, and mining industries. The writer believes that by including those industries, the findings in the further research may have better cross-industries applicability.
REFERENCES
Adi, A., Darminto, & Atmanto, D. (2013). Pengaruh Return On Equity, Debt To Equity Ratio, Earning Per Share Dan Book Value Per Share Terhadap Harga Saham (Studi pada Perusahaan Consumer Goods Industry yang Terdaftar di BEI Periode Tahun 2008 – 2011). Fakultas Ilmu Administrasi Universitas Brawijaya Malang.
Anderson, C. W., & Garcia-Feijóo, L. (2002). Corporate Investment, Book-to-Market, Firm Size, and Stock Returns: Empirical Evidence .
Badan Pusat Statistik. (2015, February 11). GDP By Industrial Origin At Current Market Price, 2013. Retrieved from Statistics Indonesia: http://www.bps.go.id/eng/pdb.php
Beckert, J. (2011). Where Do Prices Come From? Sociological Approaches to Price Formation. Cologne, Germany: Max Planck Institute.
Chiarella, C., Gao, S., & Stevenson, M. (2008). Resolving the Price-Earnings Puzzle and Related Econometrics Issues. School of Finance and Economics, University of Technology, Sydney.
Cooper, D. R., & Schindler, P. S. (2014). Business Research Methods. Singapore: McGraw-Hill.
Delen, D., Kuzey, C., & Uyar, A. (2013). Measuring firm performance using financial ratios: A decision tree approach. Elsevier.
Farkhan, & Ika. (2013). Pengaruh Rasio Keuangan terhadap Return Saham Perusahaan Manufaktur Di Bursa Efek Indonesia (Studi kasus Pada Perusahaan Manufaktur Sektor Food And Beverage).
Ferson, W., & Harvey, C. R. (1994). An Exploratory Investigation of the Fundamental Determinants of National Equity Market Returns. University of Chicago Press.
Field, A. (2009). Discovering Statistics Using SPSS . London: Sage Publications Ltd.
Foltz, J., & Wilson, C. (2011). Appropriate Use of Financial Leverage in Your Feed and Grain Business. Minnesota: Feed and Grain.
G20. (2015, June 12). G20 Members. Retrieved from g20.org: https://g20.org/about-g20/g20-members/ Ghozali, I. (2013). Aplikasi Analisis Multivariate Dengan
Program SPSS. Semarang: Universitas Diponegoro. Gitman, L. J., Zutter, C. J., Elali, W., & Roubaie, A. A. (2013). Principles of Managerial Finance. Harlow: Pearson.
271 Haugen, R. A., & Baker, N. L. (1996). Commonality in the
Determinants of Expected Stock Returns. Journal of Financial Economics.
Hermawan, D. A. (2012). Pengaruh Debt to Equity Ratio, Earning Per Share Dan Net Profit Margin terhadap Return Saham.
Kheradyar, S., & Ibrahim, I. (2011). Financial Ratios as Empirical Predictors of Stock Return.
Kothari, C. (2004). Research Methodology: Methods & Techniques. New Delhi: New Age International Limited, Publisher.
Lemmon, M. L., & Nguyen, T. (2014). Dividend yields and stock return in Hongkong. Managerial Finanance. Leong, K., Pagani, M., & Zaima, J. K. (2009). Portfolio
strategies using EVA, earnings ratio or book-to-market: Is one best? Review of Accounting and Finance.
Linawati, N., & Willy, P. M. (2000). Pengaruh hari perdagangan terhadap return saham di Bursa Efek Jakarta. Petra Christian University.
Myles, G. D. (2003). Investment Analysis. Exeter: University of Exeter.
PT. Bursa Efek Indonesia. (2014). IDX Fact Book 2014. PT. Bursa Efek Indonesia. (2015). Laporan Keuangan &
Tahunan. Retrieved from PT. Bursa Efek Indonesia:
http://www.idx.co.id/id-id/beranda/perusahaantercatat/laporankeuangandant ahunan.aspx
Reinganum, M. R. (1999). The Significance of Market Capitalization in Portfolio Management over Time. The Journal of Portfolio Management. Retrieved from
http://www.iijournals.com/doi/abs/10.3905/jpm.199 9.319750
Schlais, D. E., Davis, R. N., & Schlais, K. A. (2011). Introduction to Business. United States of America: Association Global View.
Undang - Undang Republik Indonesia Nomor 8 Tahun 1995 Tentang Pasar Modal. (1995).
Undang-undang Nomor 40 Tahun 2007 tentang Perseroan Terbatas. (n.d.). Laporan Tahunan pada Perseroan
Terbatas. Retrieved from
hukumperseroanterbatas.com:
http://www.hukumperseroanterbatas.com/2014/04/ 08/laporan-tahunan-pada-perseroan-terbatas/ Weygandt, J. J., Kimmel, P. D., & Kieso, D. E. (2010).
Accounting Principles. Asia: John Wiley & Sons. World Bank Group. (2015, February 5). GDP (Current US$)
| Data | Table. Retrieved from The World Bank Working for a World Free of Poverty: http://data.worldbank.org/indicator/NY.GDP.MKT P.CD
World Bank Group. (2015, February 5). GDP Growth (Annual %) | Data | Table. Retrieved from The World Bank Working for a World Free of Poverty: http://data.worldbank.org/indicator/NY.GDP.MKT P.KD.ZG
Yahoo! Finance. (2015, 2 14). ^JKSE Historical Price | Composite Index. Retrieved from Yahoo Finance!:
http://finance.yahoo.com/echarts?s=%5EJKSE+Inte ractive#%7B%22range%22%3A%2210y%22%2C %22scale%22%3A%22linear%22%7D
Yahoo! Finance. (2015, February 15). GGRM.JK Interactive Stock Chart | Yahoo! Inc. Stock. Retrieved from
Yahoo! Finance:
http://finance.yahoo.com/echarts?s=GGRM.JK+Int eractive#%7B%22range%22%3A%2210y%22%2 C%22scale%22%3A%22linear%22%7D