Comparison of indirect and direct determination of microbial
growth in the rumen simulation technique (Rusitec)
Despal1 and Abel2
1) Dept. Animal Nutrition & Feed Technology, Faculty of animal Science, Bogor Agricultural University, Indonesia. [email protected]
2) Dept. Of Animal Nutrition and physiology. Georg-August University- Goettingen, Germany
Abstract
A study to compare the indirect and direct measurement of microbial protein synthesis in Rusitec using stable isotope nitrogen (15N-urea with 95% enrichment) as a tracer have been conducted. Six type of ration contained 16% CP, 24 - 36% CF, 49 – 62% NDF and 27 – 41% ADF with gradual content of non protein nitrogen (NPN) have been put into nylon bag and fed daily to Rusitec fermentor for 15 days observation. Indirect microbial protein synthesis (MPS) estimated MPS from N-turnover of the ammonia pool, while direct method estimated MPS from microbial isolated. The direct measurement of microbial-N in bacteria isolates resulted in higher microbial protein synthesis compared to the indirect method based. The results obtained are compared and discussed in relation to theoretical stoichiometric data of rumen fermentation.
Keywords: ammonia, isolate, microbial, NPN, protein
1.
Backgrounds
Low protein content of tropical grasses (8 – 12%) forces the farmer to use high
protein concentrate feed. This condition limits ruminant production in the area. To avoid
utilisation of expensive high protein feed, sometime non protein nitrogen (NPN) is added
protein contributor and provides high quality protein for ruminant. To have a figure of
protein supply for ruminant, it is therefore important to quantify microbial protein
synthesis in the rumen.
Several methods have been used to assess microbial protein synthesis. For
instance (1) measurement of microbial protein on protein free diets and assuming that all
protein flowing to the duodenum is of microbial origin, (2) distinguishing feed and
microbial protein on the basis of amino acid profiles, (3) use of endogenous or exogenous
markers such as 35S, 15N, 3H-Leucine, 32P, diaminopimelic acid (DAPA), RNA and
purine and pyrimidine bases to label microbial protein material and (4) near infrared
reflectance spectroscopy methods (Obispo and Dehority (1999); Dewhurst et al., 2000).
So far there is no sophisticated method available. Dewhurst et al. (2000) reviewed
that each of the methods has its own problems including safety (radioisotopes), cost (15N
and amino acid profiles), difficulties of analysis (RNA and DNA) and contamination of
feeds, thereby lacking specificity to the microbial fraction (DAPA, nucleic acid and their
bases).
To overcome cost problem by using 15N exogenous marker, Abel et al. (1990)
tried to measure microbial protein synthesis in rumen simulation fermentor (Rusitec) by
using small quantities of 15N and applying the continuous tracer infusion method. The
method is based on the rate of incorporation of nitrogen into microbes through ammonia
pools (indirect method). It is assumed that ammonia was the only nitrogen source for
microbial protein synthesis.
Van Nevel et al. (1975) had expressed their objection to the 15N based methods
which do not take into consideration the direct incorporation of amino acid or peptide
nitrogen into microbial cells instead of ammonia. The direct incorporation of amino acid
or peptide nitrogen could amount to 20% of the total nitrogen incorporated. With the
2.
Objective
The objective of this study was to compare the indirect (ammonia pool) and direct
(microbial isolate) measurements of microbial protein synthesis using tracer stable
isotope nitrogen 15N in rumen simulation fermentor (Rusitec).
3.
Methods
Three series of Rusitec were run. The Rusitec system consisted of 6
simultaneously operating 1060 ml fermenters. At the beginning of each run, each
fermenter was filled with 690 ml rumen fluid and 80 g of solid fraction of rumen content
taken from rumen fistulated Jersey steers. The solid fraction was contained in a nylon
bag. Simultaneously, two other nylon bags one of 100 m pore size containing 10 g hay
and another of 60 m pore size containing 4 g concentrate (barley, extracted soybean
meal, urea treated cocoa pods and mineral mixtures in different proportions as shown in
table 2) were introduced. Urea was used to treat cocoa pod with a level of 20 g/kg fresh
substances to constitute the proportion of NPN. The fermenters were then filled to
volume with pre-warmed incubation buffer and operated during the following days
according to the established procedure of Rusitec (Czerkawski and Breckenridge, 1977).
The bag containing the solid ruminal fraction was removed after 24h and replaced by
bags containing the feed ration. The ration containing bags were removed after 48h of
incubation.
Six different rations containing (% DM) CP 16, NFE 41 to 52, CF 24 to 36, NDF
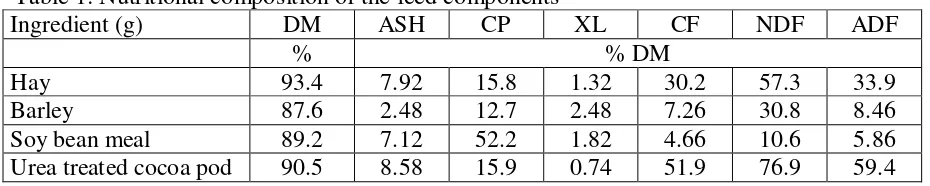
49 to 62 and ADF 27 to 41 were used in this experiment. The nutritional composition of
the ration ingredients is shown in table 1. The daily amounts of the different feed
components supplied to six fermenters in Rusitec and their chemical composition are
Table 1: Nutritional composition of the feed components
buffer (McDougal, 1948) daily using an automatic pump. The overflows were collected
in 1000 ml Erlenmeyer flasks connected to each fermenter, while the gas was collected in
gas bags.
measurements. The amount of 0.2259 g (15NH2)2CO was weighed and solved in 100 ml
distilled water. Five millilitres of the solution was added to 5 l of fresh buffer. The
amount of 15N injected daily was calculated as
15
N (mg/d) = (0.2259 g/100 ml)(1000 mg/1g)(5 ml/5000 ml)(28/60)(95/100)(ml
overflow/d)
The quasi-steady state condition in the fermenters with a nearly constant 15
N-concentration of the ammonia pool was achieved after 5 days.
The proximate nutritional compositions of the feed rations and of the solid
residues after fermentation in Rusitec were analysed according to the conventional
Weende method (Naumann and Bassler, 1997). A differential fibre analysis according to
Van Soest et al., (1991) was also performed. SCFA were detected using a gas
chromatograph (GC-14B, Simadzu) equipped with a packed column (10% Carbowax 20
MTPA SP 1000 with 1% H3PO4 on Cromosorb WAW 80/100) and flame ionisation
detector connected to a chromato-integrator (D-2000 Merck-Hitachi). Hydrogen at 120
kPa pressure served as carrier gas. The injection oven temperature was set at 170oC while
the column and detector temperatures were set at 120oC and 220oC respectively.
Concentration of NH3-N was measured by means of an electrode. While methane
production was measured by gas chromatography (SimadzuGC-8A) in collected gas
samples on a packed silica gel column, at 80oC injection port and detector temperature
and 40oC column temperature (isothermal), TC-detector (Simadzu C-R1B) and argon as
carrier gas (Da Costa Gomez, 1999).
After continuous infusion of 15N-urea, the microbial synthesis was measured
either indirectly by measuring the 15N-enrichment of the ammonia pool or directly by
analysing the 15N-enrichment in microbial isolate. Details of the two methods are
described below.
3.1. Indirect method of MPS measurement
The estimation of MPS from N-turnover of the ammonia pool was done using the
same method described by Abel et al. (1990). Three drops of silicon oil (anti foam), 8
drops of Thymolphthalein (2% in ethanol solution) or methyl red, 10 ml boric acid buffer
(in 1 N KCl solution adjusted with 1 N KOH to pH 9.5) and 4.5 ml 1N KOH were added
to100 ml effluent. The solution was distilled and the distillate collected in a beaker glass
containing 0.1 N H2SO4. Basically 0.1 N H2SO4 would be enough to bind the NH3
process was terminated when 200 – 250 ml of distillate was collected which occurred in
approximately 12 minutes.
Part of the distillate volume containing approximately 0.5 mg nitrogen was
evaporated. The amount of distilled volume to be evaporated was calculated as the
volume of distillate in the beaker divided by NH4-N/100 ml rumen fluid and divided by 2.
This amount was transferred into a 50 ml beaker glass and evaporated at a temperature of
60oC to give a volume of 3 – 4 ml. The temperature was then increased to 100oC to
further reduce the volume to750 l. The remaining solution was transferred into a tin cup
using a pipette and further dried at 105oC. The cup was then formed to a small pellet and
placed into a pallet. The pellets were analysed for 15N enrichment by means of a mass
spectrometer (Finnigan MAT Delta C, Bremen, connected to an elemental analyser,
Fisons 1108 Rodano, Milano).
Assuming steady state conditions, microbial nitrogen was derived according to
the following equation:
Microbial N (mg/d) = ri x ((si/sp) – 1)
Where ri = infusion rate (mg/d), si = 15N-excess in infusion, sp = 15N-excess in NH4-N
pool. Microbial protein synthesis (MPS) in mg/d can be calculated as microbial-N
divided by (8/100), assuming 8% N in microbial cells (Czerkawski, 1986). The efficiency
of microbial protein synthesis (EMPS) is calculated according to
EMPS (mg/g OMAD) = MPS/OMAD
Where OMAD is organic matter apparently degraded.
3.2. Direct isolation method of MPS measurement
Sample reconstitute. The isolation method to estimate microbial protein synthesis
in this study used the same principle as described by Carro & Miller (1999). The samples
taken from the overflow and the solid residuals contained in the nylon bag on day 10 and
The sample was used to isolate bacterial pellets (TB). The sample was kept in an ice bath
during the preparation to prevent microbial activity.
Isolation process. Samples of reconstituted digesta were strained using two layers
of cheese cloth. The strained fluid was centrifuged for 10 min at 500 g and 4oC. The
supernatant was centrifuged again for 25 minutes at 18 000 g, 4oC to retain the bacterial
pellet. The sediment was washed by re-suspension in NaCl solution (9 g/l) followed by
centrifugation for 25 minutes at 18 000 g, 4oC. This sediment was washed again by
re-suspension in distilled water and then again centrifuged for 25 minutes at 18 000 g, 4oC.
The resultant pellet was freeze dried.
The freeze dried isolate was put into a tin cup and the cups were formed to pellets.
The enrichment of 15N in the isolate was detected using a mass spectrometer (Finnigan
MAT Delta C, Bremen, connected to an elemental analyser, Fisons 1108 Rodano,
Milano).
Assuming steady state conditions, microbial protein synthesis (MPS) and
efficiency of microbial protein synthesis (EMPS) were derived as described above,
however, inserting 15N-excess of the microbial isolate instead of the 15N-excess of the
ammonia pool into the formula.
4.
Results and Discussions
4.1. Fermentation characteristic and organic matter degraded
Fermentation characteristics inform the activities of microbial in a media.
Fermentation characteristics and organic matter apparently degraded (OMAD) in the
fermenters used in this experiment are shown in Table 3. The values represent mean of
pooled samples from different ration with different proportion of NPN and collection
phase (n = 18).
Table 3: OMAD and fermentation characteristics in Rusitec (n = 18)
Parameters Dimension average maximum minimum STD
Protozoa cts/ml 6240 9691 3465 1795
fermentation conditions were suitable for rumen microbial growth (pH > 6). A higherpH
would create an environment more conducive to the growthof rumen cellulolytic bacteria
(Harrison et al., 1988; Beharka and Nagaraja, 1991;Yoon and Stern, 1996), ultimately
increasing fibre digestion. The same fermenters pH values were also found by Miller et
al. (2009) and Carro et al. (2009). Decreasing pH below 6 even in a short duration of a
cyclic nature will cause a moderate depression in fibre digestion (Hoover, 1986).
The ammonium concentration in the liquid phase (5.11 – 8.63 mmol/d) during the
experiments showed that the conditions in the fermenters were within the physiological
range for rumen microbes (SATTER & SLYTER, 1974; MCDONALD et al., 1995). However,
the counts of protozoa in the rumen fluid (3.4 – 9.7 x10³ per ml) were less than is usual
for the normal rumen physiology where up to 10 x 106 protozoa per ml may be expected
(MCDONALD, et al., 1995; Karnati et al., 2007). The protozoa were even decreased in
Rusitec to about 5000 counts/ml during the collection phase. Apart from methodological
reasons associated with the discrepancy between protozoal generation interval and
substrate exchange, the survival of only one tenth of the initial introduced protozoa
during the collection phase might also have been caused by the restricted substrate
available for protozoa when high fiber diets are used (WELLER & PILGRIM, 1974;
COLEMAN et al., 1980). The lower amount of protozoa (103) in rusitec fermenters were
Total of SCFA (22.5 – 37.6 mmol/d) were lower than the values found by Carro
et al. (2009) which were range from 84 – 130 mmol/L. If the average of effluent per day
about 600 ml, then total SCFA found in the fermenters were only 37.5 – 62.7 mmol/L.
The low SCFA values found in this experiment may caused by SCFA measurement
procedure using liquid gas chromatography equipment. The lower value of SCFA using
liquid gas chromatography was also found by Hutabarat et al. (2009) in compare to steam
distillation methods by Asti et al. (2009). In average, proportion of acetic, propionic, and
butyric acid were 56.13, 24.58 and 13.77. Ratio acetic to propionic acids (2.2 – 2.5 to 1)
found in this experiment was also lower than that found by Carro et al. (2009).
OMAD from all fermenters expressed low microbial activities. Maximum ration
degradation coefficient was <50%. The OMAD values were in line with SCFA
fermentation products.
4.2. Microbial Protein Synthesis
Incorporation rate of 15N into microbes (% atom excess) which was measured
directly in microbial isolates and indirectly through the ammonia pool is given in Table 4.
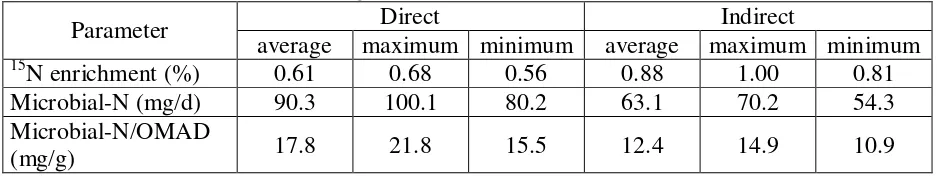
Table 4: Average values of 15N enrichment (% atom excess), microbial protein synthesis and their efficiency using the direct and indirect method
Parameter Direct Indirect
average maximum minimum average maximum minimum
15
N enrichment (%) 0.61 0.68 0.56 0.88 1.00 0.81
Microbial-N (mg/d) 90.3 100.1 80.2 63.1 70.2 54.3
Microbial-N/OMAD
(mg/g) 17.8 21.8 15.5 12.4 14.9 10.9
The 15N enrichment in bacteria isolate (direct) was lower than in the ammonia
pool (indirect). This resulted in higher bacterial-N fixation calculated for the direct
microbial isolate method compared to the indirect approach. Correspondingly,
microbial-N per gram of organic matter apparently degraded was higher when 15N-enrichment was
Microbial-N measured by means of 15N-enrichment in the microbial isolate was
higher than that determined from the ammonia pool. It may support the argument of VAN
NEVEL et al. (1975) that the method based on the rate of incorporation of nitrogen
through the ammonia pool (indirect) does not take into consideration the direct
incorporation of amino acid or peptide nitrogen into microbial cells. The direct
incorporation of amino acids or peptide nitrogen may amount to 20% of the total nitrogen
incorporated. In this experiment, however, unaccounted nitrogen incorporation as
proportion of total nitrogen incorporated reached 33% (different value between direct and
indirect method). Feed particle contamination in bacterial isolates may have contributed
to the lower 15N-enrichment thus leading to higher calculated microbial N-incorporation
with the direct method.
A comparison of the measured MPS values with the microbial protein synthesis to
be expected theoretically from the stoichiometry of rumen fermentation may be helpful.
The amount of synthesised microbial cells can be calculated from SCFA production.
According to DEMEYER et al. (1995) the amount of hexose fermented (HF) can be
calculated:
HF = hexose fermented (mol/d) = (A + P)/2 + B + V
Where A is acetate, P is propionate, B is butyrate and V is valerate expressed in mol/d
respectively. The amount of hexose fermented (HF; g/d) is calculated as 162 x HF
(mol/d). The fermentation of 100 g hexose is assumed to result in the synthesis of 30 g
microbial cells (BERGNER & HOFMANN, 1996).
If the average SCFA values from table 3 are taken for the formula above and
assuming 8% nitrogen in microbial cells (Czerkawski, 1986), 68 mg microbial-N are
theoretically expected per day. This is lower than the average microbial-N measured with
the direct method but higher than that calculated with the indirect method.
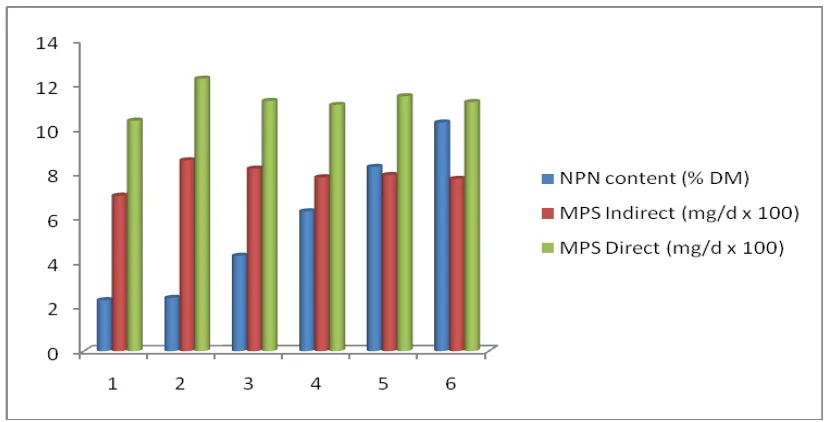
Relationship between MPS measured using indirect and direct methods and the
amount of NPN in the ration were shown in figure 1.
Figure 1: Relationship between differences amount of NPN in ration and MPS measured
from different methods
The figure showed that the differences MPS measured from indirect and direct
methods were constant and did not depend on the amount of NPN in the ration. The fact
showed that microbe synthesized protein mainly from ammonia-N and only small
proportion of them were synthesized directly from amino acid-N and other peptide-N
(< 30%). Therefore, it is necessary to protect extensive degradation of high quality feed
protein and replace them with cheaper NPN sources.
5.
Conclusions
Fermentation characteristics showed an optimal condition for rumen microbial
growth. However, low degradation activities lead to low fermentation product and
microbial protein synthesis. For the range of rations used, it can be concluded that
microbial-N synthesis in Rusitec measured by the direct method (based on 15
N-incorporation in microbial isolates) is higher than that determined with the indirect
method (based on the rate of incorporation of nitrogen into microbes through the
ammonia pool). The direct method also results in higher microbial-N synthesis compared
to the theoretically expected microbial-N synthesis. To maximize microbial protein
peptide were needed. Because rumen microbe synthesize protein mainly from
ammonia-N sources, therefore extensive degradation of expensive feed protein, should be protected
and replace them with cheaper NPN sources.
6.
References
Abel, Hj., Coenen, G., Immig, I. 1990. Untersuchungen zum Einfluß von Fett- und Stärkezulagen auf den mikrobiellen Stoffwechsel im Pansensimulationssystem RUSITEC. J. Anim. Physiol. A. Anim. Nutr. 64: 62 – 73.
Asti, N.D., Suryahadi, Permana, I.G. and Despal. 2009. Technical effect and drying time on the quality of ramie (Boehmeria nivea L. GAUD) leaf hay. Abstract the 1st International Seminar and the 7th Biennial Meeting of Indonesian Nutrition and Feed Science Association (AINI), Purwokerto, July 18 – 19, 2009.
Beharka, A. A., and Nagaraja, T.G. 1991. Effects of Aspergillus oryzae extract (AMAFERM) on ruminal fibrolytic bacteria and in vitro fiber degradation. 21st Biennial Conference on Rumen Function. Chicago, IL. P 32.
Bergner, H. and Hofmann, L. 1996. Bionergetik und Stoffproduktion Landwirtschaftlicher Nutztiere. Harwood Academic Publishers. Singapore.
Carro, M.D. and Miller, E.L. 1999. Effect of supplementing a fibre basal diet with different nitrogen forms on ruminal fermentation and microbial growth in an in vitro semi-continuous culture system (RUSITEC). British J. Nutr. 82: 149 – 157.
Carro, M.D., Ranilla, M.J., Marti’n-Garci’a, A.I. and Molina-Alcaide, E. 2009. Comparison of microbial fermentation of high- and low-forage diets in Rusitec,
single-flow continuous-culture fermenters and sheep rumen. Animal. 3 (4): 527 –
534.
Colleman, G.S., Dawson, R.M.C., and Grime, D.W. 1980. The rate of passage of ciliate protozoa from the ovine rumen. Proc. Nutr. Soc. 39: 6.
Czerkawski, J.W. and Breckenridge, G. 1977. Design and development of a long-term rumen simulation technique (rusitec). British J. Nutr. 38: 371 – 374.
Czerkawski, J.W. 1986. An Introduction to Rumen Studies. Pergamon Press, Oxford.
Demeyer, D.I., Woestyne, M.V. and Prins, R. 1995. Mikrobiologie der Verdauung. In: Abel, Hj.; Molnal, S.; Flachowsky, G.; Jeroch, H., (Eds.): Nutztierernährung: Potentiale – Verantwortung – Perspektiven. Gustav Fischer Verlag. Jena, 18 – 206.
Dewhurst, R.J., Davies, D.R. and Merry, R.J. 2000. Microbial protein supply from the rumen. Anim. Feed Sci. Technol. 85 : 1 - 21
Karnati, S.K.R., Sylvester, J.T., Noftsger, S.M., Yu, Z., St-Pierre, N.R. and Firkins, J.L. 2007. Assessment of Ruminal Bacterial Populations and Protozoal Generation Time in Cows Fed Different Methionine Sources. J. Dairy Sci. 90 : 798 – 809.
Harrison, G. A., Hemken, R.W., Dawson, K.A. and Barker, K.B. 1988. Influence of addition of yeast culture supplement to diets of lactating cows on ruminal fermentation and microbial populations. J. Dairy Sci. 71 : 2967 – 2975.
Hillman, K.A., William, G and Loyd, D.L. 1991. Evaluation of matrices in the rumen simulation technique (RUSITEC) for the maintenance of ciliate protozoa. Letters in Applied Microbiology. 12 : 129 – 132
Hoover, W. H. 1986. Chemical factors involved in rumen fibre digestion. J. Dairy Sci. 69 : 2755 – 2766.
Hutabarat, I.M.L., Suryahadi, Permana, I.G. and Despal. 2009. Impact of king grass substitution in the diet of PE goat with silage and hay of Boehmeria nivea, L. Gaud on digestibility and fermentation in vitro. Abstract the 1st International Seminar and the 7th Biennial Meeting of Indonesian Nutrition and Feed Science Association (AINI), Purwokerto, July 18 – 19, 2009.
McDonald, P., Edwards, R.A., Greenhalgh, J.F.D. and Morgan, C.A. 1995. Animal Nutrition 5th ed. Pearson Education Limited, Edinburgh Gate, Harlow.
McDougal, E.I. 1948. Studies on ruminant saliva I. The composition and output of sheep’s saliva. Biochem. J. 43, 99 – 109.
Miller, T.W., Hoover, W.H., Holt, M. and Nocek, J.E. 2009. Influence of Yeast Culture on Ruminal Microbial Metabolism in Continuous Culture. J. Dairy Sci. 85 : 2009 – 2014.
Naumann, C. and Bassler, R. 1997. VDLUFA-Methodenbuch Band III, Die chemische Untersuchung von Futtermitteln. 3rd ed. VDLUFA-Verlag, Darmstadt, Germany.
Obispo, N.E. and Dehority, B.A. 1999. Feasibility of using total purines as a marker for ruminal bacteria. J. Anim. Sci. 77, 3084 – 3095.
Van Nevel, C.J., Demeyer, D.I. and Henderickx, H.K. 1975. Use of 32P to estimate microbial synthesis in the rumen. In: Studies on non-protein nitrogen for ruminants II. Proceedings of a Research Co-ordination Meeting and Panel. Vienna, 18 – 22 February 1974, 15 – 20.
Van Soest, P. J., Robertson, J.B. and Lewis, B.A. 1991. Methods for dietary fiber, neutral detergent fibre and non-starch polysaccharides in relation to animal nutrition. J. Dairy Sci. 74, 3583 – 3597.
Weller, R.A. and Pilgrim, A.F. 1974. Passage of protozoa and volatile fatty acids from the rumen of the sheep and from a continuous in vitro fermentation system. British J. Nutr. 32, 341 – 351.